Munich Personal RePEc Archive
Southern Innovation and Foreign Direct
Investment
Suzuki, Keishun
10 June 2014
Southern Innovation and Foreign Direct Investment
∗
Keishun Suzuki
†June 10, 2014
Abstract
Many empirical studies have yielded mixed results about the impact of foreign direct investment (FDI) on domestic innovation in developing countries. This pa-per investigates the effect of FDI-promoting policy on innovation in the South in a
general equilibrium model that incorporates both the knowledge spillover effect and the market stealing effect via FDI. Specifically, we conduct the analyses of both the short-run effect and the long-run effect. While FDI-promoting policy temporarily
discourages Southern innovation in transitional dynamics through the market steal-ing effect, the accumulation of Southern knowledge via FDI helps domestic firms
begin innovation again in the long-run. In the long-run, FDI-promoting policy may generate an inverted-U effect on innovation depending on whether the knowledge spillover is strong. This paper also examines the effect of FDI-restriction policy on
Southern innovation, and the model shows that FDI protectionism has only a short-term effect and may decrease the innovation rate in the long-run.
JEL-Classification: O11, O31, F21.
Keywords: Southern Innovation, Foreign Direct Investment, Market Stealing Effect, Transitional Dynamics
∗I would like to thank Ryo Horii, Akiomi Kitagawa, and Masao Nakagawa. This study was financially
supported by Grant-in-Aid for Japan Society for the Promotion of Science (JSPS) Fellows (No.25-10619). Of course, all remaining errors are my own.
†Graduate School of Economics and Management, Tohoku University, 27-1 Kawauchi Aoba-ku, Sendai,
1
Introduction
Many developing countries have changed the investment policies that affect inward for-eign direct investment (FDI), including both liberalization and restriction. According to
the UNCTAD (2013), the world economy was keen to attract FDI between 2000-2012, and almost 70% of FDI-related policies in the world in 2012 were FDI-promoting.1 As a result,the European Commission (2012) reported that the overseas R&D expenditures of U.S. firms have increased in non-OECD Asia (e.g., China, India, Singapore, etc.). At the same time, domestic R&D investment in developing countries has recently expanded. For example,the OECD (2013)reported that China had increased their Gross Domestic Expenditure on R&D as a per cent of GDP by 218% between 2000 and 2012, and strong R&D growth led the number of patents granted to domestic inventors in China to more than triple between 2006 and 2011.2
Although emerging countries such as China seem to have experienced both rising do-mestic R&D investment and increasing FDI inflows, the relationship between them is not empirically clear. Intuitively, FDI in developing countries, including advanced technolo-gies in developed countries, has a positive impact on domestic firms through knowledge spillovers.Anwar and Sun (2013)found that foreign presence had significantly increased the R&D intensity of Chinese manufacturing industries by using firm-level panel data from 2005 to 2007. Some other studies also found that a domestic firm’s productivity was positively related to the extent of foreign presence in the industry (e.g.,Caves 1974;
Blomstrom and Persson 1983). However, some studies note that the presence of a foreign entrant has atemporalnegative effect on domestic firms. Using panel data on Venezuela,
Aitken and Harrison (1999)showed that FDI has a temporal negative impact on domestic firms’ productivity through a market stealing effect, while this effect is temporary and positive FDI spillovers dominate in the long-run. Kosova (2010) also found that FDI in the Czech Republic has both technology spillovers and the crowding out of domestic firms in the short-term. These empirical findings naturally raise the following scenario: Because FDI, which acts as a point of entry of strong foreign firms, decreases the market share of domestic firms initially, FDI has a negative effect on the Southern firms in the short-run. However, in the long-run, knowledge spillovers help domestic firms to inno-vate more efficiently, and the foreign presence conversely works to encourage domestic
1
For example, China has raised the ownership ceiling of foreign investors and simplifies review pro-cedures related to capital flows, and Pakistan recently enacted a special economic zones and offers tax incentives to foreign investors.
2
firms’ R&D.Sembenelli and Siotis (2005)showed that this story holds in Spanish manu-facturing sectors during the period 1983-1996.Liu (2008)also found that FDI lowers the productivity of domestic firms in the short-run but raises the growth rate of productivity in the long-run in Chinese manufacturing sectors.
This paper demonstrates the above story by investigating both the short-run effect and the long-run effect of promoting policy on Southern innovation. In the model, FDI-promoting policy (lowering the FDI cost) has two opposing effects on the incentive of Southern innovators. First, stimulated FDI accumulates the Southern knowledge stock, and this reduces R&D cost of domestic firms (Knowledge spillover effect). Second, a higher FDI rate decreases the firm value of the Southern innovators because their mar-kets are easily deprived by foreign firms (Market stealing effect). The model shows that FDI-promoting policy always temporarily reduces the Southern innovation rate because Southern innovation does not pay in the short-run. However, Southern knowledge stock is gradually accumulated by FDI over time, and the Southern innovation rate in the long-run becomes higher than one in the short-long-run. We conduct a comparative statics of the steady state and show that depending on the strength of the knowledge spillover there are inverted-U relationships between FDI-promoting policy and the Southern innovation rate in the long-run. In the labor market, FDI-promoting policy increases the amount of effective labor, while it decreases the share of researchers who are employed in Southern
firms. This labor reallocation effects causes a non-monotonic effect on Southern innova-tion. This result may explain the mixed evidence about the relationship between FDI and
domestic innovation. In addition, similar to FDI-friendly policy, this paper also exam-ines the effects of FDI-restriction policy (increasing the FDI cost) on domestic innovation in the short-run and one in the long-run. The model shows that FDI-restriction policy instantly enhances domestic innovation through the increase of the firm value of the do-mestic firms reflecting the reduction of risk of market stealing via FDI. However, this positive effect is just a short-term effect, and the innovation rate gradually goes down in the long-run. This result suggests that FDI-restriction policy that aims to protect domestic firms from foreign competition is only effective over a short length of time.
2
Literature Review
Several theoretical studies have recently analyzed the effects of FDI-promoting policy on Southern innovation. He and Maskus (2012) developed a North-South model with FDI and imitation in the South and showed that an FDI-promoting policy (lowering the FDI cost) always encourages both Southern innovation and FDI. Lorenczik (2012) also found that lower impediments to FDI necessarily increase Southern innovation through the spillover of FDI. Both studies have the same result by using the variety expansion model in which FDI accumulates knowledge capital in the South. In their model, intense FDI reduces Southern research costs through the knowledge spillover, and this stimulates Southern innovation. This result is very intuitive. However, these studies do not consider the market stealing effect of FDI, which is observed in empirical studies. To evaluate the effect of FDI-promoting policy on Southern innovation correctly, we need to consider the market stealing effect.
The variety expansion model, which is used inHe and Maskus (2012)andLorenczik (2012), would not be suitable for the demonstration of the market stealing effect of FDI because all goods are imperfect substitutes. Therefore, even if a new technology is intro-duced in the South by FDI, it does not drastically exclude old technologies. Consequently, the market stealing effect is too weak in the variety expansion model. In addition, as long as the model considers international trade in the North-South, even typical quality ladder models cannot demonstrate the market stealing effect of FDI. For example, Glass and Saggi (2002)employed a product cycle model as illustrated in Panel (a) in Fig1. In their model, a Southern firminstantlyloses the monopoly power when a Northern innovation occurs in the industry because Southern households can consume traded Northern goods. Therefore, no Southern firm is replaced by FDI. Glass and Wu (2007)used a different product cycle as depicted in Panel (b) in Fig1. Their model assumed that a Northern in-novator chooses whether she exports or conducts costless FDI, and a Northern inin-novator who chose FDI starts the production in the South and replaces a Southern imitator. FDI seems to have market stealing effect in this setup. However, in their model, a Northern innovator who chose to export still replaces the Southern imitator in the industry. More-over, as long as FDI simultaneously takes place with a Northern innovation, the model intrinsically captures the market stealing effect of Northern innovation, not of FDI.
To clearly investigate the relationship between FDI and Southern innovation, this pa-per only considers FDI-promoting policy that lowers the FDI cost, and we do not consider the effects of intellectual property rights (IPR) protection policy in the South.3
Nonethe-3
(a) Glass and Saggi (2002)
[image:6.595.191.431.81.292.2](b) Glass and Wu (2007)
Figure 1: The Product Cycle of Existing Models.
less, this paper is also related to numerous other literature on IPR protection in the South, where FDI is the channel for technology transfer.4 Recently,Chu et al. (2014)developed a model in which incorporates the market stealing effect of FDI, by assuming that FDI always takes place after the Southern innovation. They showed that a stronger IPR protec-tion has an inverted-U effect on the size of Southern innovaprotec-tion because of the trade-off between encouraging FDI, which has the displacement effect on Southern innovators, and discouraging imitation, which stimulates the Southern innovation. Although they only considered the situation that a stronger IPR protection always enhances both FDI and Southern innovation, their model potentially has an inverted-U shaped relationship between FDI and innovation.
The present paper has several advantages compared with the existing literature. First, using a simple model, we can investigate the short-run effects of FDI-promoting policy on the transition path. He and Maskus (2012) and Lorenczik (2012) only investigated the long-run effect by using a numerical method due to the complexity of their model. However, the present model can analytically investigate the transitional dynamics after
showed that patent reform in developing countries does not significantly encourage R&D of U.S. multina-tional firms because the markets in developing countries are relatively small. Theoretical studies are also inconclusive; for example,Glass and Saggi (2002)showed that strengthening IPR protection discourages FDI, whereasLai (1998)showed that strengthening IPR protection promotes FDI.
4See for exampleDinopoulos and Segerstrom (2010),Branstetter and Saggi (2011),Gustafsson and
the policy change.5 Second, we obtain a non-monotonic relationship between FDI and Southern innovation in the long-run, while most studies showed a monotonic one. Al-though the non-monotonic relationship between them is also demonstrated byChu et al. (2014), their result is generated through the negative effect on the imitation by strength-ening IPR protection, while we can show the non-monotonic relationship between them without this channel.
3
Model
3.1
Basic Setup
The basic structure is based onGrossman and Helpman (1991, Ch.4). FollowingChu et al. (2014), we mainly focus on the Southern economy given by the Northern economy for tractability. We do not consider the international trade between the North and the South.6 The world technology frontier expands exogenously, and we assume that the Southern technologies never catch up with the frontier. Because this model focuses on the process of catching-up with the technology frontier, we do not consider the situation after the catching-up.
In this country, the labor size is constant over time and given byL. Each household serves one unit of labor supply inelastically at each point in time, and earns a wage ofw. The industries continuously exist, and the total number is unity. Letj ∈[0,1]denote the index of industries. In industryj, there are many different generations of good that are in-dexed bym = 0,1,2, ...,m˜j according to their order of birth. They have different unique
qualities, and the quality of generationm’s good is given byλm. Therefore, generation
˜
mj’s good represents the latest good, which has the highest quality in industryj.
5Tanaka and Iwaisako (2014) highlighted the importance of analyses in the equilibrium path after a
policy change. Even if comparative statics of the steady-state are well done, the result cannot be applied to the evaluation of the policy change without showing the equilibrium path because we cannot know how (and whether) the economy approaches to a new steady state from an old one. In fact,Tanaka and Iwaisako (2014)showed that the model ofGlass and Wu (2007)does not have an equilibrium path and the economy will reach to corner-solution equilibrium after the policy change.
6
3.2
Households
All households have following intertemporal utility function and instantaneous utility function:
Ut=
∫ ∞
t
e−ρ(τ−t)
lnC(τ)dτ, (1)
lnC(τ) =
∫ 1
0
ln
(m˜j
∑
m=0 λmx
m,τ(j)
)
dj, (2)
whereρdenotes the discount rate, andxm,τ(j)denotes the consumption level of goodm
in industryjat timeτ.7
The intertemporal utility maximization problem yields a familiar equation: E/E˙ =
r−ρ, whereErepresents the expenditure andris the common interest rate in the world.8 All household clearly purchase only the latest generation goods that have the highest quality in each industry (m˜j). By solving the instantaneous utility maximization problem,
we can obtain the demand function of each goodm˜j.
xm˜j =
φE pm˜j
. (3)
By using aggregate expenditure as the num´eraire (E = 1), we get r = ρ. For more detailed explanation, seeGrossman and Helpman (1991, Ch.4).
3.3
Foreign Firms and Domestic Firms
In the South, both foreign firms and Southern domestic firms engage in innovative ac-tivities that aim to improve the quality of existing goods that have the highest quality in each industry. We assume that only foreign firms can access all Northern goods. How-ever, each Northern good cannot be consumed in the South without a costly localization that orients this good to the characteristics of the South.9 We call this type of investment
7For convenience, we hereafter omit the time subscript of time-variant variables.
8The interest rate is not given here. In the model, we implicitly consider the individuals that invest in
the Northern domestic firms and the multinational firms in the South. Therefore, the interest rate becomes identical between the countries in the equilibrium. For this reason, this model is neither a closed-economy model nor small-open economy model.
9
“FDI”. We assume that a foreign firm cannot orient a Northern good that has a two-step newer generation than at least the current latest generation of the Southern product in the industry due to the lack of knowledge, infrastructure, and so on. Therefore, she can only introduce a Northern good that has one-step higher quality than the current highest quality of the Southern product in the industry.
Southern domestic firms also can improve the quality of an existing good in the South. We call their invention “Southern innovation” or just innovation. Because they cannot access a Northern good, they engage in innovative activities with their own knowledge. For this reason, Southern innovation is neither just imitation nor technology transfer, even though the “new” generation that is provided by Southern innovation was already invented in the North. When a Northern good is brought into the South by FDI, Southern firms realize the technologies surrounding the Northern good, which gives new knowledge to Southern innovators. We later formulate this knowledge spillover via FDI.
3.4
Production
If a firm succeeds in innovating a new good in an industry, she becomes new incumbent and serves the good monopolistically. All firms have one-to-one production technology. Because the nearest rival of a firm is the previous incumbent in the industry, the price of goods becomes p = λw, by limit-pricing. Therefore, the instantaneous profit of a firm becomesπ = 1−λ−1
.
All industries can be classified into two types, state-S and state-F. In the industry in state-S, a Southern firm is incumbent and produces the highest quality good in the industry. She can earn a profit until new Southern innovation or FDI occurs in the industry. If the FDI takes place, this industry moves to state-F where a foreign firm monopolistically produces the highest quality good in the South until new Southern innovation or FDI occurs in the industry. After that, when Southern innovation occurs, the industry moves to state-S again. Fig2illustrates the image of product cycle.
We denote the fraction of state-Xindustries asnX. Therefore,ns+nf = 1naturally
holds. In addition, we denote the Southern innovation rate and the FDI rate aszsandzf,
respectively. Then, the instantaneous flow can be written as follows:
˙
Figure 2: The Product Cycle.
3.5
Knowledge, Southern Innovation, and FDI
Both Southern firms and foreign firms employ researchers and engage in innovative ac-tivities. We assume that the success of Southern innovation and FDI follows a Poisson process. If a Southern innovator devotes (zs/ks)dt units of labor for a time interval of
dt, it succeeds in developing a next generation of goods with probability zsdt. Here, ks
indicates the volume ofactive knowledgeof Southern innovators, for which active means that these knowledge are not yet obsolete in the South. When a foreign firm succeeds in transferring a high-quality Northern good by FDI, Southern innovators meet the new knowledge associated with the foreign good, and this gives them ideas for innovation. After a domestic firm succeeds in improving the quality of a foreign good, the associated knowledge is no longer active because the Southern firm completely acquired the knowl-edge. Therefore, the volume of active knowledge is increased by FDI and decreased by Southern innovation that improves the goods produced by foreign firms. We assume that
kstakes the following functional form.
ks=κ(nf), (5)
κ′
(nf)>0, κ
′′
(nf)≤0, κ(1)≡κ, κ¯ (0)≡κ > ρ/[L(λ−1)].
An example of ks = κ(nf)is illustrated in Fig 3. In this specification, (κ−κ¯) stands
for the level of knowledge spillover from FDI. For example, small(κ−κ¯)means that an additional technology transfer by FDI only slightly increase the Southern knowledge. For the free-entry of innovation, the following condition must be hold.
Vs≤
w κ(nf)
Figure 3: The Active Knowledge in the South.
Similarly, successful FDI in an industry in an interval ofdtwith a probability ofzfdt
needs(zf/µ)dtunits of labor, whereµ >0represents the inverse of the difficulty of FDI.
A higherµmeans that foreign firms can succeed FDI with lower costs, soµis the level of FDI-promoting policy in the South. In contrast to Southern innovators, foreign firms do not receive spillovers from FDI because they already know all Northern goods. Then, the free-entry condition for FDI can be written as follows:
Vf ≤
w
µ (equality holds whenzf >0). (7)
3.6
Asset Market
Stockholders earn a return that is the sum of the dividend and the capital gain in each period, even though there is a risk of losing the value with a certain probability. Under asset market equilibrium, the period return of each equity must be the same as the return of other risk-free investments.
In the model, the firm value of a Northern firm and that of foreign firms are identical for all time (Vs = Vf). Let V denote the firm value of a Northern firm or foreign firms.
The instantaneous profit is(1−λ−1
), which it loses with a Poisson rate of(zs+zf)in an
interval ofdt. Then, we obtain the no-arbitrage condition as follows:
rV = (1−λ−1
3.7
Labor Market
Labor is allocated to the production of goods, innovation, and FDI. The labor demand must be equal to the domestic labor supply in the equilibrium. Therefore, the labor market clearing condition is
1
λw +
zs
κ(nf)
+zf
µ =L. (9)
4
Equilibrium Dynamics
In this section, we characterize the equilibrium dynamics of the model by deriving the key differential equations that describe the phase diagram of the model. For convenience, we denote byX∗
the steady-state value of a variable X. We hereafter focus on the interior equilibrium in which both the innovation rate and FDI rate are strictly positive in the steady-state (z∗
s > 0, z
∗
f > 0). However, there are corner equilibrium cases in which the
innovation rate or FDI rate is zero in the steady-state when the level of FDI-promoting policy (µ) is extremely low or high. The Appendix provides the detailed derivation of the
equilibrium dynamics in corner equilibrium cases.
Suppose that the level of FDI-promoting policy is a moderate value such that µ ∈
(κ,¯κ). Onceµis determined in the range, the steady-state value of the fraction of foreign firms (n∗
f) is also determined as follows:
n∗
f =κ
−1
(µ) (10)
This is an increasing function ofµand satisfies0 < n∗
f < 1by the definition ofκ(nf).
The characteristics of the transitional dynamics of the model depend on whether the initial
nf is higher thann∗f or not. We will observe each case in following subsections.
4.1
The Transitional Dynamics when
n
f< n
∗fSuppose that the initialnf is lower thann
∗
f. This indicates that the initialks(= κ(nf))is
lower thanµ(= κ(n∗
f))and then the cost of innovation is strictly higher than the cost of
FDI. In this case, only FDI takes place in the equilibrium path (zf > 0, zs = 0). Then,
w = µV holds from free-entry condition (7). By substituting w = µV into the labor market equilibrium condition (9), we derivezf =µL−(λV)
−1
. Using this equation, law of motion (4), and no-arbitrage condition (8), we obtain following equations.
˙
nf = (1−nf)
(
µL− 1
λV
)
and,
˙
V = (ρ+Lµ)V −1. (12)
In above equation (12), onlyV is a jump variable. Therefore,V must jump to its steady-state value immediately. Otherwise, the firm value never reach to the steady-steady-state because the coefficient of V is strictly positive. Then, V˙ = 0 always holds in this case, and we obtain the steady-state value as follows:
˙
V = 0⇔V∗
= (ρ+µL)−1
. (13)
Because we consider the case ofzf >0, the firm value in the steady state must be higher
than a critical value:
V∗
>(µλL)−1
. (14)
This condition always holds by the assumption ofρ/[L(λ−1)]< κ.
In addition, fromzf >0and (11), we obtain the behavior ofnf as follows:
˙
nf ≥0 (equality only holds whennf = 1). (15)
4.2
The Transitional Dynamics when
n
∗f< n
fNext, consider the case that the initialnf is higher thann∗f. In this case,ks is larger than
µ, and then only innovation takes place (zs >0, zf = 0). Then,w=κ(nf)V holds from
free-entry condition (6). By substituting this equation into the labor market equilibrium condition (9), we derivezs = κ(nf)L−(λV)−1. Using (4), (8), and zs > 0, we obtain
following equations:
˙
nf ≤0 (equality only holds whennf = 0), (16)
and,
> >
˙
V = 0⇔V = [ρ+L·κ(nf)]
−1
.
< <
(17)
4.3
The Steady-State
In the steady-state (nf =n∗f), both innovation rate and FDI rate are strictly positive, and
the cost of innovation and the cost of FDI must be same. Then, from free-entry conditions,
κ(n∗
f) = µholds. This implies that the line ofn
∗
f = κ
−1
(µ) corresponds to the line of ˙
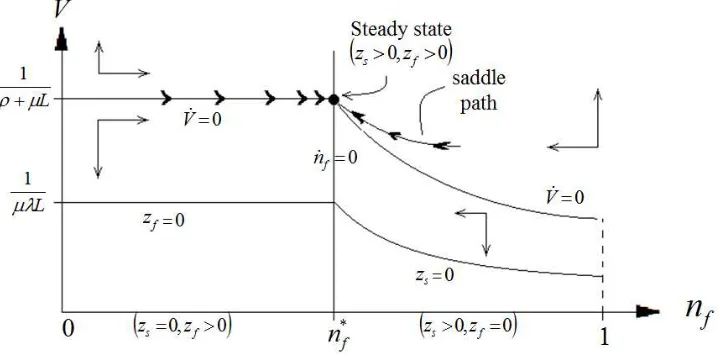
Figure 4:The Phase Diagram (Interior case).
of innovation rate and FDI rate as follows: z∗
s +z
∗
f = µL−(λV)
−1
. Substituting this equation into no-arbitrage condition (8), we can derive same differential equation as (12). Then,V˙ = 0always hold as already discussed, and we obtain the equation of the line of
˙
V = 0:
˙
V = 0⇔V∗
= (ρ+µL)−1
. (18)
Consequently, the steady-state(n∗
f, V
∗
)is given by (10) and (18).
4.4
The Phase Diagram
Then, we can describe the equilibrium dynamics of the model. The phase diagram is depicted in Fig4. As illustrated, the steady-state is unique, and the equilibrium path to the steady-state is also unique.
The left region of Fig 4 (nf < n
∗
f) stands for the case of only FDI. In this case,
the economy must jump to on the line of V˙ = 0. Otherwise, the firm value diverges to infinity or negative infinity.10 The economy gradually approaches to the steady-state
along with this straight line. The right region of Fig4 (n∗
f < nf) represents the case of
only Southern innovation. In this case, the FDI cost is very large, and only innovation satisfies the equality of free-entry condition. There is a unique saddle path aboveV˙ = 0 line, and the economy must lie on the path in this case. Then, the economy converges to
10Moreover, free-entry condition for FDI is not satisfied above the line ofV˙ = 0, where the labor demand
the steady-state along with the path. We already observed that, in the steady-state, both ˙
nf = 0andV˙ = 0hold and both FDI and innovation occur. Consequently, we obtain the
following result:
Proposition 1. The steady-state is unique and saddle-path stable for allµ ∈ (0,∞). In the interior steady-state, the FDI rate and the Southern innovation rate are positive. In the corner steady-state, either the FDI rate or the Southern innovation rate is positive.
Proof. See Appendix for the corner equilibrium case.
5
The Effects of FDI-promoting Policy
In this section, we examine the effects of FDI-promoting policy (µ → µ′
, µ′
> µ) on the innovation rate, the FDI rate, and the wage rate. First, we analytically derive the innovation rate and the FDI rate in the transitional path and the steady-state. Then, we consider the short-run effects by analyzing the transition of the model after the policy is implemented, and observe the long-run effects by comparing the value in new steady-state to original one in old steady-state.
5.1
Innovation rate and FDI rate
First, we solve the innovation rate and the FDI rate in the steady-state. As discussed in Sec 4.3, the firm value of the steady-state is given byV∗
= (ρ+µL)−1
. Substituting this intoz∗
s+z
∗
f =µL−(λV)
−1
, we obtain the sum of innovation rate and FDI rate as below.
z∗
s +z
∗
f =L(1−λ
−1
)µ−ρλ−1
. (19)
From (4),n∗
f =z
∗
f/(z
∗
f +z
∗
s)must hold in the steady-state. This implies that the ratio of
FDI rate to total research intensity coincides the fraction of foreign firms to all firms in the South. Therefore, FDI rate and innovation rate in the steady-state are solved as follows.
z∗
f =n
∗
f
[
L(1−λ−1
)µ−ρλ−1]
, (20)
z∗
s = (1−n
∗
f)
[
L(1−λ−1
)µ−ρλ−1]
. (21)
Next, we derive the innovation rate and FDI rate in the transition where nf < n∗f
holds. This case corresponds to the left region of Fig4. As discussed in Sec 4.1, the firm value is constant and given byV = (ρ+µL)−1
. Substituting this intozf =µL−(λV)−1,
we obtain FDI rate and innovation rate in this case:
zf =L(1−λ
−1
)µ−ρλ−1
, (22)
Figure 5:The Transitional Dynamics after FDI-promoting Policy.
5.2
The Short-run Effects
The transition after FDI-friendly policy is represented in Fig5. Suppose that the economy is initially in the state (the point A). FDI-promoting policy increases the steady-state value ofnf asn
∗
f →n
∗∗
f becausen
∗
f =κ
−1
(µ)is an increasing function ofµ. Then, the economy instantaneously jumps to the point A’ from A, in the region where only FDI occurs, and the economy approaches to the new steady-state (the point B).
By FDI-promoting policy, which lowers the cost of FDI, foreign firms have strong incentive for FDI, and this increases the FDI rate (zf ↑). On the other hand, the
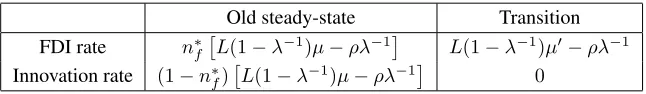
inno-vation rate falls to zero because the higher FDI rate discourages the innovators through market stealing effect. From the perspective of innovators, a higher FDI rate means that the expected interval of monopoly after innovation becomes short because the possibility of market stealing by foreign firms is high. This directly decreases the firm value of in-novators, and therefore FDI-promoting policy discourages the innovation. We can verify that the FDI rate is necessarily increased by FDI-promoting policy in the short-run from (19) and (20). Table1briefly shows the result of the calculation. From this, we obtain the following result.
Old steady-state Transition FDI rate n∗
f [
L(1−λ−1)µ−ρλ−1]
L(1−λ−1)µ′−ρλ−1
Innovation rate (1−n∗
f) [
L(1−λ−1)µ−ρλ−1]
[image:17.595.151.474.98.145.2]0
Table 1:The Short-run Effects of FDI-friendly Policy.
5.3
The Long-run Effects
We consider the long-run effect of FDI-promoting policy on domestic innovation, con-ducting comparative statics of the steady-state. As shown in the previous subsection, although FDI-promoting policy temporarily extinguishes the incentive to innovate, FDI gradually accumulates the knowledge stock in the South (ks ↑). When innovation costs
become sufficiently small as a result of the accumulation of knowledge through FDI, Southern innovators begin R&D investment again. Therefore, the crowding out of South-ern firms by FDI is a short-term phenomenon, and the innovation rate becomes positive again in the long-run.
However, the impact of FDI-promoting policy on Southern innovation is not clear due to both the knowledge spillover effect and the market stealing effect. As we calculated, the innovation rate in the steady-state is solved as follows:
z∗ s =
(1−λ−1
)κL−ρλ−1
µ∈(0, κ) [1−κ−1
(µ)] [(1−λ−1
)µL−ρλ−1
] µ∈[κ,κ¯]
0 µ >κ¯
(24)
where z∗
s in the case of corner equilibrium is derived in the Appendix. The curve of
the above function is illustrated in Fig 6. In the region of µ ∈ [κ,κ¯], the innovation rate is an inverted-U shaped curve of µ because z¯s ≡ (1− λ−1)κL > ρλ−1 holds by
assumption in (5). Panel (a) in Fig6corresponds to the case that κis smaller thanκ∗
≡
[¯κ+ρ(L(λ−1))−1
]/2. On the other hand, whenκ > κ∗
, the inverted-U shape disappears, and FDI-promoting policy cannot enhance the innovation in this case, as shown in Panel (b) in Fig 6. The latter case happens when (¯κ − κ) is small, which implies that the knowledge spillover effect is very weak. In this case, the market stealing effect dominates the knowledge spillover effect, the innovation rate in the new steady-state cannot be higher than initial value in the old steady-state. However, if the knowledge spillover effect is so strong thatκ < κ∗
holds, FDI-promoting policy can enhance the innovation inµ∈[κ, κ∗
(a) Strong spillover (b) Weak spillover
Figure 6:The Long-run Effect of FDI-promoting Policy on Innovation.
We can also interpret this inverted-U relationship by considering the allocation of researchers. In the steady-state, from (19)-(21), the total number of researchers is(1− λ−1
)µL−ρλ−1
and they are allocated to FDI and innovation by the proportion ofn∗
f and
1−n∗
f, respectively. FDI-friendly policy increases the total number of researchers, while
simultaneously decreasing the share of researchers who are employed by domestic firms. These opposing effects generate an inverted-U shaped curve. Finally, we summarize the long-run effects as follows.
Proposition 3. There is an inverted-U relationship between FDI-promoting policy and the the innovation rate in the steady-state when knowledge spillover by FDI is sufficiently strong. When the knowledge spillover is weak, FDI-promoting policy may discourage innovation in the long-run.
What does determine the magnitude of knowledge spillover via FDI in host countries? Both theoretical studies and the empirical literature suggest that the absorptive capacity of domestic firms and moderate technological backwardness is crucial to enhance knowledge spillovers because there is a vast room for improvement potentially (e.g.,Glass and Saggi 1998;Kokko et al. 1994). If this view is correct, we can interpret Proposition3as follows: an economy in which domestic technology is far from the frontier and the absorptive capacity is also high can enhance the domestic innovation by FDI-promoting policy if the current policy is not as FDI-friendly (not highµ). This result seems to be consistent with the recent Chinese experience of both rising domestic R&D investment and increasing FDI inflows because China has recently adopted FDI-promoting policy even though FDI has not been fully liberalized, especially in the service sector (e.g.,Branstetter and Lardy 2008).11
11
5.4
The Effect on the Wage
Finally, we briefly examine the effect of FDI-promoting policy on wage rate. As expected, FDI-promoting policy raises the labor demand and increases the wage in the model. This result is consistent with empirical studies that analyze the the effect on wage.12
Proposition 4. Suppose that the economy is initially in the interior steady-state. Then, FDI-promoting policy always increases the wage in both short-run and long-run.
Proof. From (7) and (18), we can solve the steady-state value of wage as follows: w∗
=
µ/(ρ+µL). Because this is an increasing function ofµ, FDI-promoting policy always increases the wage in the long-run. In addition, as already discussed in Sec 4.1, (7) and (18) also hold in the transition after FDI-promoting policy. This indicates that w = w∗
also holds in the short-run. Therefore, FDI-promoting policy always increases the wage in both short-run and long-run.
6
The Effects of FDI-restriction Policy
In this section, we consider whether FDI-restriction policy can enhance domestic innova-tion or not. In reality, the governments in the world often adapt the FDI-regulainnova-tion policy that aims to protect the domestic owned firms from foreign competition. According tothe UNCTAD (2013), the share of new investment regulations and restrictions has increased year and year.13 Does this policy reform have the expected effect in our model?
Suppose that the economy is in the steady state initially (the pointAin Fig7). When FDI-restriction policy (µ↓) is implemented,V˙ = 0line shifts to above, and the economy immediately jumps to the pointA′
on the saddle path. After that, the economy approaches to the new steady state (the pointB). Then, how does this policy reform affect domestic innovation in the short-run? To see this, we compare the innovation rate in the old steady state with one in the transition. The innovation rate in the old steady state is given by (21), and the innovation rate at pointA′
isµL−(λV)−1
. Becausenf is same between the
pointAandA′
, andV at the pointA′
is higher than one at the pointA, the innovation rate instantly increases when FDI-restriction policy is implemented. However, as the economy
country and ranked 127 countries in the world. They scored almost average point on the FDI attractiveness of China.
12
For detailed examples, see an excellent survey ofLipsey (2004).
13
approaches to the new steady state, the foreign presencenf is getting small and the cost
[image:20.595.191.435.212.348.2]of innovation is gradually increased. Then, the innovation rate turns to decrease in the medium-run. Because the characteristics of the long-run is completely same as Sec 5.3, the innovation rate in the new steady state may or may not strictly lower than one in the old steady state (inverted-U shape). If the spillover effect is not so strong, the FDI-restriction policy does not decrease domestic innovation both in the short-run and in the long-run at least, as illustrated in Fig6.
Figure 7:The Transitional Dynamics after FDI-restriction Policy.
Proposition 5. Suppose that the economy is initially in the interior steady-state. Then, FDI-restriction policy temporarily increases the innovation rate. However, in the long-run, the innovation rate becomes strictly lower than one before the policy is implemented.
7
Conclusion
model. As a result, FDI-promoting policy may generate an inverted-U effect on innova-tion in the long-run depending on whether the knowledge spillover is strong or not. In addition, we also investigated the effect of FDI-restriction policy. The model shows that FDI-restriction policy necessarily enhances domestic innovation in the short-run, while the long-run effect on domestic innovation is unclear. Specifically, when the spillover effect via FDI is strong, FDI-restriction policy may decrease the innovation rate in the long-run. This suggests that FDI protectionism has only a short-term effect and would not be effective in the long-run.
Although we succeed in showing the short-run negative effect of FDI on Southern innovation by considering perfect substitution (quality-ladder) instead of imperfect sub-stitution (variety-expansion), the short-run effect, in which the Southern innovation rate goes down to zero, may be an extreme result, and a more moderate negative effect would be realistic. This would be worth conducting in future research. In addition, we assumed that the process of technology spillover is costless and automatic in the model. However, in reality, domestic firms in the developing countries engage in costly processes to learn foreign knowledge. We will address this issue in future studies.
Appendix
Corner Equilibrium
In this Appendix, we consider the corner equilibrium in which FDI rate or innovation rate becomes zero in the steady-state. This case happens whenκ < µ¯ orµ < κ. However, the characteristics of transitional dynamics in this case is almost same as that in the interior equilibrium, because extreme value ofµjust changes the position of the steady-state.
When κ < µ¯ holds, µ is extremely high, and ks cannot be higher than µ for all
nf ∈[0,1]. Therefore, in this case, only FDI occurs for allnf ∈[0,1]and the steady-state
is on the vertical line ofn∗
f = 1as shown in Panel (a) of Fig 8. As already discussed in
Sec 4.1, in only FDI case,V must jump to its steady-state value immediately, andV˙ = 0 always holds. Because the line ofn∗
f = 1is same as the line ofn˙f = 0in this case, the
steady-state is given by(nf, V) = (1,[ρ+µL]
−1
). We can verify that the steady-state is unique and stable. The economy starts on the line ofV˙ = 0initially, and then converges to the steady-state. In this case, only FDI occurs in the steady-state even if knowledge spillover is maximum (nf = 1).
spillover (nf = 0). The equations that describe the behavior of stock variable nf and
control variableV are given by (16) and (17) in Sec 4.2. Panel (b) of Fig8depicts the phase diagram in this case, and the steady-state is given by(nf, V) = (0,[ρ+κL]−1). We
[image:22.595.131.497.204.377.2]can see that the steady-state is unique, and there is a saddle path to the steady-state. No FDI occurs in the steady-state in this case. Therefore, we proved a part of Proposition 1 that mentions the corner equilibrium.
Figure 8: The Phase Diagram (Corner-equilibrium).
References
[1] Aitken, B. and A. Harrison. (1999): “Do domestic firms benefit from direct foreign investment? Evidence from Venezuela.” American Economic Review, 89: 605-618. [2] Anwar and Sun (2013): “Foreign entry and firm R&D: evidence from Chinese
man-ufacturing industries.” R&D Management, 43(4): 303-317.
[3] Blomstrom, M. and H. Persson. (1983): “Foreign investment and spillover efficiency in an underdeveloped economy: evidence from the Mexican manufacturing indus-try.” World Development, 11(6): 493-501.
[4] ranstetter, L. and N. Lardy. (2008): “China’s embrace of globalization.”, China’s great economic transformation, Cambridge University Press.
[5] Branstetter, L. and K. Saggi. (2011): “Intellectual property rights, foreign direct investment and industrial development.” The Economic Journal, 121: 1161-1191. [6] Caves, R. (1974): “Multinational firms, competition, and productivity in
host-country markets.” Economica, 41: 176-193.
[7] Chu, A., Cozzi, G., and S. Galli. (2014): “Stage-dependent intellectual property rights.” Journal of Development Economics, 106: 239-249.
[9] Doytch, N. and M. Uctum (2011): “Does the worldwide shift of FDI from manufac-turing to services accelerate economic growth? A GMM estimation study.” Journal of International Money and Finance, 30: 410-427.
[10] European Commission. (2012): “Internationalisation of business investments in R&D and analysis of their economic impact.”
[11] Glass, A. and K, Saggi. (1998): “International technology transfer and the technol-ogy gap.”Journal of Development Economics, 55(2): 369-398.
[12] Glass, A. and K, Saggi. (2002): “Intellectual property rights and foreign direct in-vestment.” Journal of International Economics, 56: 387-410.
[13] Glass, A. and X. Wu. (2007): “Intellectual property rights and quality improvement.” Journal of Development Economics, 82: 393-415.
[14] Groh, A. and M. Wich. (2012): “Emerging economies’ attraction of foreign direct investment.” Emerging Markets Review, 13: 210-229.
[15] Grossman, G. and Helpman, E. (1991): “Innovation and growth in the global econ-omy.” MIT Press, Cambridge, MA.
[16] Gustafsson, P. and P. Segerstrom (2011): “North-South trade with multinational firms and increasing product variety.” International Economic Review, 52: 1123-1155.
[17] He, Y. and K. Maskus. (2012): “Southern innovation and reverse knowledge spillovers: A dynamic model.” International Economic Review, 53: 279-302. [18] Iwaisako, T., Tanaka, H., and K. Futagami. (2011): “A welfare analysis of global
patent protection in a model with endogenous innovation and foreign direct invest-ment.” European Economic Review, 55: 1137-1151.
[19] Kokko, A., Tansini, R., and M. Zejan. “Local technological capability and produc-tivity spillovers from FDI in the Uruguayan manufacturing sector.” Journal of De-velopment Studies, 32(4): 602-611.
[20] Kosova, R. (2010): “Do foreign firms crowd out domestic firms? evidence from the Czech Republic.” The Review of Economics and Statistics, 92(4): 861-881.
[21] Lai, E. (1998): “International intellectual property rights protection and the rate of product innovation.” Journal of Development Economics, 55: 133-153.
[22] Lipsey, E. (2004): “Home- and host-country effects of foreign direct investment.” Challenges to Globalization, Chicago: University of Chicago Press: 333-382. [23] Liu, Z. (2008): “Foreign direct investment and technology spillovers: Theory and
evidence.” Journal of Development Economics, 85: 176-193.
[24] Lorenczik, C. (2012): “Intellectual property rights as determinants of FDI, technol-ogy spillovers and R&D in developing countries.” working paper.
[25] OECD. (2013): “OECD economic surveys China.” March 2013.
[26] OECD. (2014): “The Internationalisation of Business R&D, Evidence, Impacts and Implications.”
[27] Park, W. (2012): “North-South models of intellectual property rights: an empirical critique.” Review of World Economics, 148: 151-180.
[28] Sembenelli, A. and G. Siotis. (2005): “Foreign direct investment, competitive pres-sure and spillovers, an empirical analysis of spanish firm level data.” CEPR, Discus-sion Paper Series no. 4903.
[29] Tanaka, H. and T. Iwaisako. (2014): “Intellectual property rights and foreign direct investment: A welfare analysis.” European Economic Review, 67: 107-124.