ISSN Online: 2161-7589 ISSN Print: 2161-7570
Soil Salinity and Alkalinity Map Preparation
Based on Spatial Analysis of GIS
(Case Study: Tabriz Plain)
A. Farajnia
1, J. Yarahmadi
21Soil and Water Research Department, East Azerbaijan Agricultural and Natural Resources Research and Education
Center, Tabriz, Iran
2Soil Conservation and Watershed Management Research Department, East Azerbaijan Agricultural and Natural Resources
Re-search and Education Center, Tabriz, Iran
Abstract
Better management of agricultural fields is related to valuable information which can derived from soil salinity and alkalinity maps. These maps are con-sidered as one of the most important factors which restrict plant growth as well as decline crops yield. The objective of this research was preparing of soil salinity and alkalinity maps in Tabriz plain over 50,000 hectares based on dif-ferent techniques of spatial analysis in GIS software. For this mean, study area was divided in 1500 × 1500 m2 grid cells. Then, geographical coordinate of each grid recorded in UTM system. So, they were transferred into GPS for na-vigating to the exact excavation location. After soil sampling and transferring to the lab, their EC and PH were measured in saturation extract of soil sam-ples. So, spatial distribution of soil sampling points was prepared in form of point map by GIS software. Generalization of point information to surface was performed using different interpolation algorithms and based on stan-dards of Soil and Water Research Institute. Accuracy of interpolated maps was evaluated due to the MAE and MBE values. The results showed that the lowest observed error is related to the Spline method and therefore, this method was used for spatial modeling of salinity and alkalinity maps in the intended area. The research findings demonstrated that from total of 50,000 hectares, only 3066 hectares were without salinity and alkalinity limitation (6.1%), 9066 hectares had low salinity and alkalinity (18.1%); 17,772 hectares had average limitation for salinity and alkalinity (35.6%) and the remaining 20,096 hec-tares had high and very high limitation for salinity and alkalinity.
Keywords
GIS, Interpolation Techniques, Salinity and Alkalinity Map, Tabriz Plain How to cite this paper: Farajnia, A. and
Yarahmadi, J. (2017) Soil Salinity and Alka-linity Map Preparation Based on Spatial Analysis of GIS (Case Study: Tabriz Plain). Open Journal of Geology, 7, 778-788.
https://doi.org/10.4236/ojg.2017.76052
Received: January 10, 2017 Accepted: June 4, 2017 Published: June 7, 2017
Copyright © 2017 by authors and Scientific Research Publishing Inc. This work is licensed under the Creative Commons Attribution International License (CC BY 4.0).
http://creativecommons.org/licenses/by/4.0/
1. Introduction
and description of spatial data. Geostatistics is included all statistical methods (classical statistics and spatial statistics) which are used in earth sciences. [8]
dust ultimately. This subject has been caused to environmental concerns in re-cent years [19]. Restoration committee of Urmia Lake was described effect of the Urmia Lake drying on agriculture and residents of this area, in his third report as follows: 1) development of salty micro dust due to increment of dust produc-tion center and desertificaproduc-tion 2) fertility decline, resonance of soil salinity and loss of agricultural lands, orchards and pastures due to salt dispersal by wind 3) entrance of toxic compounds to food chain and creation of incurable diseases in the region 4) augmentation of immigration specially villages evacuation around the lake 5) ecosystem alteration and intensification of climate change and drought [20]. With regards to large area of saline soils in this region and intensi-fication of soil salinity due to the lake drying, it is necessary to determine salinity and alkalinity of area soils and define its future changes by continuous sampling and periodic trends and with application of necessary management prevent from expansion of saline lands and intensification of soil salinity. In this regard, the study was carried with purpose of zoning maps preparation for salinity and alka-linity of Tabriz plain soils at level of 50 thousand hectares, using various tech-niques of spatial analysis in GIS 12.3.2 software.
2. Materials and Methods
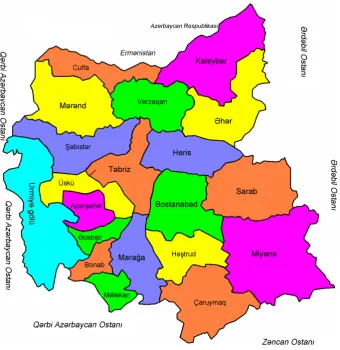
Location of the studied areaTabriz plain with more than 100 thousand hectares is located in the east part of Uremia Lake. This area is on two physiographic units of floodplains and lowlands. Generally, slope of these lands is less than 2% without lateral slope and topography; in some parts have minor roughness. Water sources of Tabriz plain are Aji Chai River, Sinikh Chai River, Sofiyan Chai River, Lighvan Chai River, semi-deep and deep wells with salty water and brackish water. Aji chai is the largest river of Tabriz. Water of this river is fresh in upper parts and head-waters but it dissolves various solutes due to going across from marl formations in its path and turn into salts, so that it is unusable in case of water shortage and in summer and autumn months due to high salinity. Aji Chai River in time of flooding which soil salinity has been intensified with drying of Urmia Lake and irrigation with saline water of wells. Diversity of native plants is high rela-tively which are mostly in form of small bushes of halophytes plants. Crop plants are involved: wheat, barley, alfalfa, sugar beet and onion [8]. Soft depo-sits of Uremia Lake are mainly as result of sediments from lake depodepo-sits of Ma-ragheh formation, shales and sandstones of Cretaceous and Neogene, limestone of Qom formation and masses of granite. Material of lake deposits is often clay, silt, fine sand and very low situ chemical sediments. In its detrital deposits; quartz, calcite and mica are more abundant than other minerals. Clay-minerals in these detrital deposits are mainly illite, kaolinite and chlorite also situ depo-sits have the highest values of aragonite. Generally, amount of organic matters in the sediments of Urmia Lake are low, but this value increase in wetlands and salt marshes of the Lake [21]. Location of studied area has been presented in
Figure 1. Location of studied area.
Research Methodology
Figure 2. grids map and position of sampling points.
Table 1. Classification standard of lands in terms of salinity (4).
Sign Electrical conductivity (dS/m)
Description
So
<4 Without salinity limitation
S1
4 - 8 Low salinity limitation
S2
8 - 16 Relatively high salinity limitation
S3
16 - 32 High salinity limitation
S4
>32 Very high salinity limitation
Table 2. Classification standard of land in terms of alkalinity (4).
Sign pH amount
Description
Ao
<8 Without alkalinity limitation
A1
8 - 8.5 Low alkalinity limitation
A2
8.5 - 9 Relatively high alkalinity limitation
A3
9 - 9.5 High alkalinity limitation
A4
[image:6.595.206.542.648.734.2]cross-validation and based on criteria of MAE and MBE. This means that in each interpolation method, the observed values were removed from total data temporarily and interpolation process was run again with others samples and the new value was estimated for that point. Finally, validation of different interpola-tion methods was carried out by comparing observainterpola-tional amounts with its cor-responding estimated values and if the numerical values of mentioned criteria was zero or close to zero, it was indicated that this method is proper and what-ever distance from zero was higher, it was indicated deviation from desirability of interpolation or otherwise deviation from the actual values and shouldn’t be used that method for preparation of surface maps. After determination of the most suitable interpolation method, surface maps of soils salinity and alkalinity were prepared by selected interpolation method. Homogeneous zones in terms of salinity and alkalinity were done in GIS software based on standards which were presented by the Institute of Soil and Water Research (Table 1 and Table 2) and using Re-classify method. Surface maps were prepared in order to esti-mate alteration of EC and pH in the studied area and then one map as salinity and alkalinity map was prepared with combining two maps for ease of use in management application and suggestion of improvement programs.
3. Results
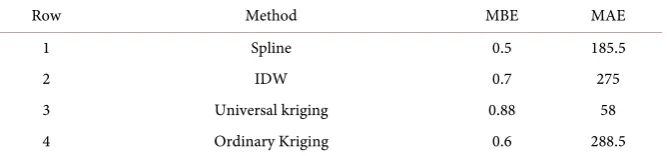
According to the research method and based on different algorithms of interpo-lation in GIS software and using ILWIS software in each interpointerpo-lation method, the observed values were removed from total data temporarily and interpolation process was run again with others samples and the new value was estimated for that point and a table was formed with observed and estimated values for each mentioned interpolation algorithms. In the next phase, the results of different interpolation methods in preparation of considered maps was assessed through statistical comparison of observed values with its corresponding estimated values which have been presented in Table 3. According to this information, the least amount of error was belonged to spline interpolation method and ordinary Kriging method was after that.
Therefore, surface maps of salinity and alkalinity for soils of Tabriz plain were prepared based on spline method. At this stage, referred maps were classified to different groups based on classification values which were presented in Table 1
[image:7.595.207.541.653.731.2]and Table 2; final combination map was provided for the studied area by com-bining maps of salinity and alkalinity classes.
Table 3. Results of different spatial interpolation methods.
MAE MBE
Method Row
185.5 0.5
Spline 1
275 0.7
IDW 2
58 0.88
Universal kriging 3
288.5 0.6
4. Discussion and Conclusion
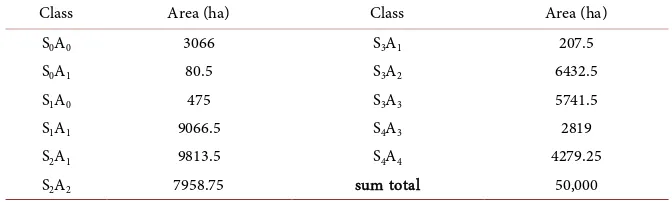
The results of interpolation and surface map preparation of salinity and alkalin-ity for Tabriz plain are given in Table 4 which showed amounts of salinity and alkalinity increased in close parts to Urmia Lake so that from total of 50,000 hectares, only 3066 hectares (6.1%) were without salinity and alkalinity limita-tion. 9066 hectares (18.1%) had low salinity and alkalinity; it means salinity is below 4 - 8 dS and pH is 8 - 8.5. In case of supplying proper water, cultivation pattern should be reformed in these lands and salt-tolerant crops such as saffron, safflower, canola and pistachio should be cultivated instead of crops with high water demand such as alfalfa, onion and sugar beet. Naturally, development of greenhouses especially for vegetables and also modified irrigation from basin to drip systems in orchards is recommended in this part of the plain. In 17,772 hectares (35.6%) of these lands, salinity is 8 - 16 dS and pH is 8.5 - 9. These lands are barren now, but remnant of old plots show that cultivation has been existed at these lands in not too distant days. Therefore, in these lands, salinity tolerant crops such as barley and pistachio can be cultivated by supplying proper water, drainage and specific management. Existence of multiple waterways assembles possibility of drains construction and depletion of canals area and performance downfall in these lands will also be evident absolutely.
These results are conformed with studies in recent 20 years, anomaly exploita-tion of water and soil resources, unauthorized digging wells and uncontrolled exploitation of groundwater which were caused groundwater salinization and eventually were led to soil salinity in marginal east lands of Lake Urmia or Ta-briz plain where until a few years ago agriculture was booming in there [23]. As it is clear in the maps, amount of salinity and alkalinity in soil have the converse relationship with distance from the lake and with approaching to the lake, salin-ity and alkalinsalin-ity increase in soils due to augmentation of influence possibilsalin-ity of salt water from the lake into groundwater and irrigation with saline water have been caused further increase of salinity and alkalinity in these lands. These re-sults correspond with the rere-sults of Wang et al.; they reported that soil salinity in the Yellow River delta in China increased by reducing the distance from Bo Sea which had salty water [24].
[image:8.595.204.540.634.735.2]About 12,000 hectares (12%) of study area have high salinity and alkalinity; from past times, farmers used these lands as pasture. These lands are lowlands mainly in which cultivation is not possible due to clay soil texture and increment
Table 4. Various classes area of salinity and alkalinity in Tabriz Plain.
Area (ha) Class
Area (ha) Class
207.5 S3A1
3066 S0A0
6432.5 S3A2
80.5 S0A1
5741.5 S3A3
475 S1A0
2819 S4A3
9066.5 S1A1
4279.25 S4A4
9813.5 S2A1
50,000 sum total
of sodium surface adsorption ratio in these soils and on the other hand, reduc-tion of soil permeability as well as poor drainage. It is necessary to amplify these lands with management application and with abatement of uncontrolled graz-ing; because by losing vegetation and with approaching to dry bed of the lake, it can be focuses of dust. The remaining 8000 hectares are the western part of the studied area which has high salinity and alkalinity and years away, were parts of Uremia Lake but these parts have come out of water with retrogression of the lake and are now bare and without of any vegetation. High water level in saline groundwater is certain in some seasons of the year in this part of the region so that in constructed profiles, temporary wetlands symptoms are clear which in-clude brick and black pigments that represent restored iron and manganese, re-spectively. In summer, these lands become as focuses of salty micro dust, due to destruction of soil structure caused by sodium ion-specific effect in severe winds. Soil salinity and alkalinity are a continuous quantity, as the maps show; these factors increased from south and east-south to west gradually until lands become with high salinity and alkalinity which from this area to the next, a leap forward occurs in values so that, Ec reaches to more than 100 dS/m and pH reaches to more than 10. In this area, these factors will lose their continuity, and in the past, these lands were part of the lake bed and had come out of the water over time with drying of the lake. In recent years, the lake lost miry status due to surface water drop and became source of salty micro dust in the dry seasons. Retrogres-sion of Uremia Lake is as a result of imbalanced development and dominance of individual profits over regional and national profits in which one of its implica-tions is intensification of salinity and alkalinity in the region soils. Therefore, it is essential to evaluate changes of these two factors in short, medium and long-term and it should be prevented from salinity development and specially focuses of salty micro dust with creation of information bank and management application by updated information.
References
[1] Ahangaree Zonozie, R. and Jafaree, M. (1999) Zonation Salt Development Using GIS. The 1st National Conference on the Impact of the Recession Lake Urmia on Soil and Water Source, Tabriz, Iran, 54-66.
[2] Gahrodi, T.M. (2005) GIS in Three-Dimensional Environment (In Arc GIS). Re-search and Geography Journal, 1st Edition, Publications University of Tarbiat Moa-lem, Tehran, Iran.
[3] Gallichand, J. (1988) Weighted Moving Average Program. Depth. of Agric., Lava Uni., Canada.
[4] Ghassemi, F., Jakeman, A.J. and Nix, H.A. (1995) Salinization of Land and Water Resources: Human Causes, Extend, Management and Case Studies. University of New South Wales Press, Sydney.
[5] Jaberipor, H., Abtahee, A. and Mosavi, S.A. (2013) Assess the Efficiency of Some Interpolation Models in Zoning and Mapping Soil Salinity. The 1st National Con-gress on Science and New Technologies in Agriculture, Zanjan University, Zanjan, Iran, 112-124.
Sa-linity and AlkaSa-linity in a Semi-Arid Region. Annals of Warsaw University of Life Sciences—SGGW. Land Reclamation, No. 44, 3-14.
[7] Khaksan, D., Sokuti Oskuiee, R. and Mahmodi, S. (2013) Compare Some Geostatis-tical Methods for Spatial Variability of Soil Salinity Plains of Urmia. 12Th Iranian Soil Science Congress, Tabriz, Iran.
[8] Laslett, G.M., Macbratney, A.B., Phal, P.I. and Hutchinson, M.F. (1987) Compar-sion of Several Spatial Prediction Methods for Soil pH. EuropeanJournal of Soil Science, 38, 325-341. https://doi.org/10.1111/j.1365-2389.1987.tb02148.x
[9] Madani, H. (1994) Foundations Land Statistics. 1st Edition, Amikabir University Publication, Tehran, Iran.
[10] Peer kharate, H. (2013) Geology and Sediment Rocks around Lake Urmia. National Conference Environmental Crisis Lake Urmia, Islamic Azad University, Naghadeh, Iran, 66-74.
[11] Tóth, T. (2005) Monitoring, Predicting and Quantifying Soil Salinity, Sodicity and Alkalinity in Hungary at Different Scales. Past Experiences, Current Achievements and an Outlook with Special Regard to European Union initiatives. Research Insti-tute for Soil Science and Agricultural Chemistry of the Hungarian Academy of Sci-ences (RISSAC), Budapest, Herman, Hungary.
[12] Walter, C., McBratney, B.,Douaoui, A. and Minasny, B. (2001) Spatial Prediction of Topsoil Salinity in the Chelif Valley, Algeria, Using Local Ordinary Kriging with Local Variograms versus Whole-Area Variogram. Australian Journal of Soil Re-search, 39, 259-272.
[13] Amini, M. (1999) Statistical Land Survey Salinity and Alkalinity in Some of Rodasht Soils. Master Thesis in Esfahan University, Esfahan, Iran.
[14] Anonymous (2015) Risk and Threat and Drought the Lake. 3rd Package, Social and Cultural Committee Headquarters Revive Lake Uremia, Tabriz, Iran.
[15] Anonymous (1989) Guidelines for the Classification of Land and Irrigation Poten-tial. Publication 205, Soil and Water Research Institute, Agricultural Research, Edu-
cation and Extension Organization, Tehran, Iran.
[16] Ehyaee, M. and Behbahani, A. (1993) Description of the Methods of Chemical Ana- lysis of Soil. Soil and Water Research Institute, AgriculturalResearch, Education
and ExtensionOrganization, Tehran, Iran.
[17] Faraji Sabokbar, H. and Azizi, G. (2006) The Accuracy of Spatial Interpolation Me-thods. Research and Geography Journal, No. 54, 1-15.
[18] Farajnia, A. (2010) Application of GIS in Mapping Harzandi Marand Plain Soil. 4th Regional Conference on Agricultural Research findings (WestIran), Sanandaj, Iran. [19] Farajnia, A. and Seyed Jalali, S.A. (2001) Determine the Appropriateness and Poten-tial Production of Wheat in Saline Lands in Iran. Technical Bulletin No. 1134, Soil and Water Research Institute, AgriculturalResearch, Education and Extension
Or-ganization, Tehran, Iran.
[20] Wang, Z.R., Zhao, G.X., Gao, M.X., Chang, C.Y., Jia, J.C. and Li, J. (2014) Characte-ristics and Spatial Variability of Saline-Alkaline Soil Degradation in the Typical Ye- llow River Delta Area of Kenli County, China. Journal of Environmental Protection, 5, 1053-1063.
[21] Mandal, A., Sharma, C. and Singh, G. (2009) Assessment of Salt Affected Soils in India Using GIS. Geocarto International, 24, 437-456.
https://doi.org/10.1080/10106040902781002
Journal of Soil Science, 34, 137-162.
[23] Naderi, M. (2005) Salinity Hazard Mapping Using GIS and Multi-Criteria Evalua-tion. 9th Iranian Soil Science Congress, Soil Conservation and Watershed Manage-ment Research Institute, Tehran, Iran.
[24] Nezami, M.T. and Alipor, Z.T. (2012) Preparing of the Soil Salinity Map Using Geo- statistics Method in the Qazvin Plain. Journal of Soil Science and Environmental Management, 3, 36-41.
Submit or recommend next manuscript to SCIRP and we will provide best service for you:
Accepting pre-submission inquiries through Email, Facebook, LinkedIn, Twitter, etc. A wide selection of journals (inclusive of 9 subjects, more than 200 journals)
Providing 24-hour high-quality service User-friendly online submission system Fair and swift peer-review system
Efficient typesetting and proofreading procedure
Display of the result of downloads and visits, as well as the number of cited articles Maximum dissemination of your research work