ISSN Print: 2168-5436
DOI: 10.4236/ijmpcero.2018.73027 Aug. 7, 2018 330 Int. J. Medical Physics, Clinical Engineering and Radiation Oncology
Technical Note: Identification of CT Texture
Features Robust to Tumor Size Variations for
Normal Lung Texture Analysis
Wookjin Choi
1, Sadegh Riyahi
1, Seth J. Kligerman
2, Chia-Ju Liu
3, James G. Mechalakos
1, Wei Lu
1*1Department of Medical Physics, Memorial Sloan Kettering Cancer Center, New York, USA 2Department of Radiology, University of California at San Diego, San Diego, USA
3Department of Radiology, Memorial Sloan Kettering Cancer Center, New York, USA
Abstract
Normal lung CT texture features have been used for the prediction of radia-tion-induced lung disease (RILD). For these features to be clinically useful, they should be robust to tumor size variations and not correlated with the normal lung volume of interest, i.e., the volume of the peri-tumoral region (PTR). CT images of 14 lung cancer patients were studied. Different sizes of gross tumor volumes (GTVs) were simulated and placed in the lung contrala-teral to the tumor. 27 texture features [nine from intensity histogram, eight from the gray-level co-occurrence matrix (GLCM) and ten from the gray-level run-length matrix (GLRM)] were extracted from the PTR. The Bland-Altman analysis was applied to measure the normalized range of agreement (nRoA) for each feature when GTV size varied. A feature was considered as robust when its nRoA was less than the threshold (100%). Sixteen texture features were identified as robust. None of the robust features was correlated with the volume of the PTR. No feature showed statistically significant differences (P < 0.05) on GTV locations. We identified 16 robust normal lung CT texture fea-tures that can be further examined for the prediction of RILD.
Keywords
Radiation-Induced Lung Disease, Normal Lung Texture, Radiomics, CT, Stereotactic Body Radiotherapy
1. Introduction
Stereotactic body radiotherapy (SBRT) has emerged as a standard therapy for early-stage non-small cell lung cancer (NSCLC), especially in patients who are How to cite this paper: Choi, W., Riyahi,
S., Kligerman, S.J., Liu, C.-J., Mechalakos, J.G. and Lu, W. (2018) Technical Note: Identification of CT Texture Features Ro-bust to Tumor Size Variations for Normal Lung Texture Analysis. International Journal of Medical Physics, Clinical Engineering and Radiation Oncology, 7, 330-338. https://doi.org/10.4236/ijmpcero.2018.73027
Received: June 12, 2018 Accepted: August 4, 2018 Published: August 7, 2018
Copyright © 2018 by authors and Scientific Research Publishing Inc. This work is licensed under the Creative Commons Attribution International License (CC BY 4.0).
http://creativecommons.org/licenses/by/4.0/
W. Choi et al.
DOI: 10.4236/ijmpcero.2018.73027 331 Int. J. Medical Physics, Clinical Engineering and Radiation Oncology considered poor surgical candidates. Despite its excellent cure rate, radiation-induced lung disease (RILD) is a frequent dose-limiting complication of SBRT [1] [2] [3]. Predicting the risk of RILD is very helpful for treatment planning and disease management [4] [5] [6].
Normal tissue complication probability (NTCP) models were proposed to predict the possibility of toxicity according to the dose [7] [8]. Dosimetric and clinical risk factors have been well established for the NTCP models for RILD, but they are limited regarding performance and generalizability [5] [9]. Recently radiomics particularly computed tomography (CT) texture features have been used to improve the prediction accuracy [10] [11]. CT texture features quantify the spatial patterns of tissue density, such as homogeneity, coarseness, and cor-relation of CT attenuation [12]. Therefore they can characterize the radiologic manifestations of RILD, which include ground-glass opacities, consolidation, and pleural effusions [4]. They have been used to predict radiation pneumonitis in the peri-tumoral region (PTR) [13].
It is important to identify which features are robust to assure the accuracy and generalizability of a prediction model. Previous robustness studies concerned about registration [10] [14] [15], test-retest [16] [17] [18], machine variability
[17] [18] [19], and inter-observer variabilities on tumor delineation [16] [20]. For a feature to be clinically useful, it should also be robust (relatively invariant or unbiased) to tumor size variations and not correlated (non-redundant) with the normal lung volume of interest [21] [22]. We performed a simulation study to examine CT texture features extracted from the PTR in the lung.
2. Methods
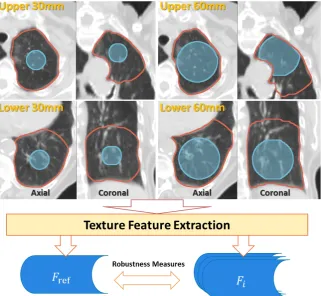
We simulated different sizes of gross tumor volumes (GTVs) on free-breathing planning CT scans from 14 patients with lung cancer. This retrospective study was approved by our institutional review board. Fourteen patients treated with SBRT for non-small cell lung cancer were randomly identified. All CT scans were acquired with a Philips Big Bore Brilliance 16-slice CT scanner (Philips Healthcare; Andover, MA) using the same acquisition parameters: 120 kV, 400 mAs, 16 × 1.5-mm collimation, 3-mm slice thickness, and approximately 1 × 1 × 3-mm resolution. We excluded two patients who had multiple tumors on the right lung and the left lung. The remaining patients had a single primary lung tumor. We simulated various sizes of spherical GTVs in the normal lung con-tralateral to the tumor. The peri-tumor regions of the simulated GTVs were analyzed for texture feature robustness. Figure 1 shows the flowchart of the fea-ture robustness analysis and the details are given in the following sections. The following image analysis was implemented using the Insight Segmentation and Registration Toolkit (ITK, National Library of Medicine; Bethesda, MD) [23].
2.1. GTV Simulation
DOI: 10.4236/ijmpcero.2018.73027 332 Int. J. Medical Physics, Clinical Engineering and Radiation Oncology
Figure 1. A flow chart for the robustness analysis of normal lung CT texture features ex-tracted from the PTR (red contour excluding the simulated blue GTV). The mid-size (30 mm) GTV was used as the reference tumor [ref].
mm diameters) were simulated in the contralateral lung. We placed all GTVs in the upper and lower lobes of the lung respectively, resulting in 12 GTVs for each patient and a total of 168 GTVs for all patients. The GTVs were placed to in-clude homogeneous normal lung tissues at the same (upper or lower lobe) loca-tion for each patient while trying to exclude large blood vessels and underlying diseases (such as emphysema).
2.2. Texture Feature Extraction
A total of 27 texture features were extracted from each normal lung volume of interest, i.e., the PTR [13], defined as a 30 mm 3D expansion around the GTV (not including the GTV itself) excluding the chest wall and mediastinum. The texture features included nine intensity-histogram-based features and 18 spa-tial-frequency-based features (eight from the gray-level co-occurrence matrix [GLCM] [12] and ten from the gray-level run-length matrix [GLRM] [24] [25]).
Intensity-histogram-based texture features quantify the level and distribution of CT attenuations. The features were obtained by statistical measures of CT attenuation for all voxels within each PTR. These intensity features include first-order statistical measures and higher-order statistical measures.
W. Choi et al.
DOI: 10.4236/ijmpcero.2018.73027 333 Int. J. Medical Physics, Clinical Engineering and Radiation Oncology voxels or groups of voxels. The CT attenuation within each PTR was first nor-malized to the range from 0 to 255. The texture features were then computed on the GLCM and GLRM of the normalized volumes. The mean value of each ture was computed over all 13 directions to obtain rotationally invariant fea-tures.
2.3. Feature Robustness
We chose the mid-size (30 mm diameter) GTV as the reference tumor [ref]. The robustness of a feature F when GTV size varied was assessed using the norma-lized range of agreement (nRoA) with Bland-Altman method [14] [26]
(
bias bias) (
bias bias)
95% Limit upper bound 95% Limit lower boundnRoA 100%
Mean value
1.96 1.96
100%,
F F F F
F
F
µ σ µ σ
µ −
= ×
+ ⋅ − − ⋅
= ×
with
nGTVs 1
1 ,
nGTVs
F i Fi
µ
=∑
=where Fbias_i =Fref−Fi was the difference of Fref (F calculated in the PTR of the [ref] tumor) and Fi (F calculated in the PTR of the ith GTV);
µ
Fbias andbias F
σ
were the mean and the standard deviation of Fbias_i over all GTVs; and nGTVs and µF were the total number of GTVs (168) and the mean F valueacross all patients, respectively. A smaller nRoA indicated smaller variation in F as GTV size changed, and thus higher robustness of a feature. A feature was considered as robust if its nRoA was less than a threshold chosen around the nRoA of the volume of the PTR [10]. Furthermore, a feature was regarded as not correlated with the volume of the PTR when their correlation was lower than 0.70.
3. Results
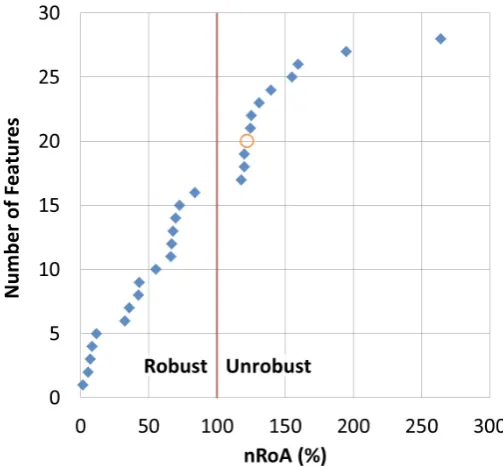
We considered a feature as a robust feature if its nRoA was smaller than the nRoA of the volume of the PTR. However, as shown in Figure 2, although the nRoAs of three features (GNU, Sum, and Kurtosis, Feature #17-19) were smaller than the nRoA of the volume (#20), we considered them as unrobust features. Because (1) there was a large gap in nRoA between Inertia (#16, 83.6%, robust) and the three features, and (2) the nRoAs of the three features were very similar to the nROA of the volume (122.3%). Based on these observations, we chose an nRoA threshold of <100% to define a robust feature.
DOI: 10.4236/ijmpcero.2018.73027 334 Int. J. Medical Physics, Clinical Engineering and Radiation Oncology
Figure 2. The cumulative graph of features vs. nRoA. Blue diamonds: texture features, orange circle: volume of the PTR, and red line: the threshold for robustness.
three high gray-level emphasis features (HGRE, SRHGE, and LRHGE) were ro-bust. On the contrary, both nonuniformity features (GNU and RNU), and all three low gray-level emphasis features (LGRE, SRLGE, and LRLGE) were unro-bust. Particularly, all three low gray-level emphasis features had large nRoAs (155% - 264%), indicating large variations when GTV size changed.
None of the robust features was correlated with the volume of the PTR (Table 1), suggesting that they can provide supplemental information to the volume. Two unrobust features (sum and RNU) were highly correlated with the volume of the PTR. No feature showed statistically significant differences (P < 0.05) on GTV location (upper vs. lower lobe).
4. Discussion
Lung texture contains a distribution of both low attenuation and high attenua-tion tissues. Low attenuaattenua-tion predominates as a large porattenua-tion of the lung volume consists of air within the airways and alveoli. However, a percentage of the lung is comprised of higher attenuation normal tissues including the vasculature and interstitium. Also, various pathologic states such as a tumor, pneumonia, he-morrhage, edema, and fibrosis lead to increased lung attenuation.
Most of the intensity and GLCM features are scale-invariant by definition, but some of them (e.g., maximum, kurtosis, CS, CP, and HC) were unrobust to GTV variations. Because, they were very sensitive to intensity variation affected by the volume change.
W. Choi et al.
[image:6.595.205.538.103.715.2]DOI: 10.4236/ijmpcero.2018.73027 335 Int. J. Medical Physics, Clinical Engineering and Radiation Oncology
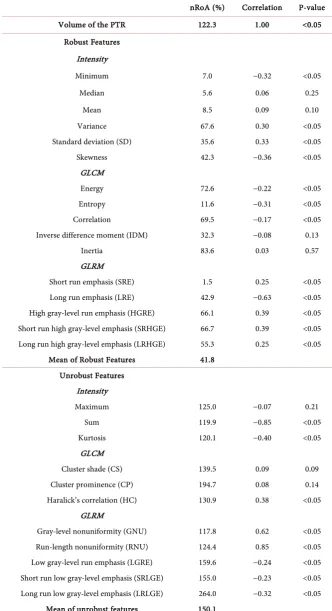
Table 1. Normal lung CT texture features: normalized range of agreement (nRoA), cor-relation with the volume of the PTR, and P-value of the corcor-relation.
nRoA (%) Correlation P-value
Volume of the PTR 122.3 1.00 <0.05
Robust Features Intensity
Minimum 7.0 −0.32 <0.05
Median 5.6 0.06 0.25
Mean 8.5 0.09 0.10
Variance 67.6 0.30 <0.05
Standard deviation (SD) 35.6 0.33 <0.05
Skewness 42.3 −0.36 <0.05
GLCM
Energy 72.6 −0.22 <0.05
Entropy 11.6 −0.31 <0.05
Correlation 69.5 −0.17 <0.05
Inverse difference moment (IDM) 32.3 −0.08 0.13
Inertia 83.6 0.03 0.57
GLRM
Short run emphasis (SRE) 1.5 0.25 <0.05 Long run emphasis (LRE) 42.9 −0.63 <0.05 High gray-level run emphasis (HGRE) 66.1 0.39 <0.05 Short run high gray-level emphasis (SRHGE) 66.7 0.39 <0.05 Long run high gray-level emphasis (LRHGE) 55.3 0.25 <0.05
Mean of Robust Features 41.8 Unrobust Features
Intensity
Maximum 125.0 −0.07 0.21
Sum 119.9 −0.85 <0.05
Kurtosis 120.1 −0.40 <0.05
GLCM
Cluster shade (CS) 139.5 0.09 0.09
Cluster prominence (CP) 194.7 0.08 0.14
Haralick’s correlation (HC) 130.9 0.38 <0.05 GLRM
Gray-level nonuniformity (GNU) 117.8 0.62 <0.05 Run-length nonuniformity (RNU) 124.4 0.85 <0.05 Low gray-level run emphasis (LGRE) 159.6 −0.24 <0.05 Short run low gray-level emphasis (SRLGE) 155.0 −0.23 <0.05 Long run low gray-level emphasis (LRLGE) 264.0 −0.32 <0.05
DOI: 10.4236/ijmpcero.2018.73027 336 Int. J. Medical Physics, Clinical Engineering and Radiation Oncology short high gray-level runs from the vasculature, interstitium and various patho-logic states as well as some long low gray-level runs from the distal airway. When the GTV size increased, long low gray-level runs within the PTRs were truncated into shorter runs. Therefore, all three low gray-level emphasis features (LRGE, SRLGE, and LRLGE) and both run-length distribution features (GNU and RNU) varied significantly due to different truncation effects of various-size GTVs. On the contrary, the high-attenuation tissues like small vasculature or interstitium had mainly short runs, the distribution of these short high gray- level runs was not significantly affected. Therefore, all three high gray-level em-phasis features (HGRE, SRHGE, and LRHGE) had smaller variations (nRoAs = 66.1%, 66.7%, and 55.3%).
This study has a limited scope: examining the robustness of normal lung CT texture features when simulated tumor volume changes. As such it has several limitations: it was only a simulation study, the simulated spherical GTV were much simplified compared to the shapes of real tumors. In addition, no predic-tion model was constructed, and no real RILD case was studied. In the future, we will feed the identified robust texture features along with the conventional dose and clinical risk factors [8] [9], to prediction models in real RILD datasets.
5. Conclusion
We identified 16 robust lung CT texture features which were relatively invariant to tumor size variations and not correlated with the volume of the PTR. Particu-larly the three GLRM high gray-level emphasis features (HGRE, SRHGE, and LRHGE) can characterize the radiologic manifestations (increased lung attenua-tion) of pulmonary abnormalities. Hence these features can be further examined for the prediction of the RILD.
Acknowledgements
This work was supported in part by the NIH/NCI Grant No. R01 CA172638 and the NIH/NCI Cancer Center Support Grant P30 CA008748.
Conflict of Interests
The authors declare that there is no conflict of interests regarding the publica-tion of this paper.
References
[1] Maebayashi, T., Ishibashi, N., Aizawa, T., Sakaguchi, M., Sato, T., Kawamori, J. and Tanaka, Y. (2016) Radiation Pneumonitis Changes over Time after Stereotactic Body Radiation Therapy for Lung Tumors: Post-Treatment Cavity (Sunny-Side-up Egg-Like) Changes. Anticancer Research, 36, 5563-5570.
https://doi.org/10.21873/anticanres.11141
W. Choi et al.
DOI: 10.4236/ijmpcero.2018.73027 337 Int. J. Medical Physics, Clinical Engineering and Radiation Oncology Radiation Therapy for Lung Cancer. International Journal of Radiation Oncology * Biology * Physics, 83, e545-e549. https://doi.org/10.1016/j.ijrobp.2012.01.018
[3] Yamashita, H., Takahashi, W., Haga, A. and Nakagawa, K. (2014) Radiation Pneu-monitis after Stereotactic Radiation Therapy for Lung Cancer. World Journal of Radiology, 6, 708-715. https://doi.org/10.4329/wjr.v6.i9.708
[4] Choi, Y.W., Munden, R.F., Erasmus, J.J., Park, K.J., Chung, W.K., Jeon, S.C. and Park, C.K. (2004) Effects of Radiation Therapy on the Lung: Radiologic Appear-ances and Differential Diagnosis. Radiographics: A Review Publication of the Radi-ological Society of North America, Inc, 24, 985-998.
[5] Zhang, X.J., Sun, J.G., Sun, J., Ming, H., Wang, X.X., Wu, L. and Chen, Z.T. (2012) Prediction of Radiation Pneumonitis in Lung Cancer Patients: A Systematic Review. Journal of Cancer Research and Clinical Oncology, 138, 2103-2116.
https://doi.org/10.1007/s00432-012-1284-1
[6] Takeda, A., Ohashi, T., Kunieda, E., Enomoto, T., Sanuki, N., Takeda, T. and Shi-gematsu, N. (2010) Early Graphical Appearance of Radiation Pneumonitis Corre-lates with the Severity of Radiation Pneumonitis after Stereotactic Body Radiothe-rapy (SBRT) in Patients with Lung Tumors. International Journal of Radiation On-cology * Biology * Physics, 77, 685-690. https://doi.org/10.1016/j.ijrobp.2009.06.001
[7] Emami, B., Lyman, J., Brown, A., Coia, L., Goitein, M., Munzenrider, J.E., Shank, B., Solin, L.J. and Wesson, M. (1991) Tolerance of Normal Tissue to Therapeutic Ir-radiation. International Journal of Radiation Oncology * Biology * Physics, 21, 109-122. https://doi.org/10.1016/0360-3016(91)90171-Y
[8] Bentzen, S.M., Constine, L.S., Deasy, J.O., Eisbruch, A., Jackson, A., Marks, L.B., Ten Haken, R.K. and Yorke, E.D. (2010) Quantitative Analyses of Normal Tissue Effects in the Clinic (QUANTEC): An Introduction to the Scientific Issues. Interna-tional Journal of Radiation Oncology * Biology * Physics, 76, S3-S9.
https://doi.org/10.1016/j.ijrobp.2009.09.040
[9] Appelt, A.L., Vogelius, I.R., Farr, K.P., Khalil, A.A. and Bentzen, S.M. (2014) To-wards Individualized Dose Constraints: Adjusting the QUANTEC Radiation Pneu-monitis Model for Clinical Risk Factors. Acta Oncologica, 53, 605-612.
https://doi.org/10.3109/0284186X.2013.820341
[10] Cunliffe, A., Armato, S.G., Castillo, R., Pham, N., Guerrero, T. and Al-Hallaq, H.A. (2015) Lung Texture in Serial Thoracic Computed Tomography Scans: Correlation of Radiomics-Based Features with Radiation Therapy Dose and Radiation Pneumo-nitis Development. International Journal of Radiation Oncology * Biology * Physics, 91, 1048-1056. https://doi.org/10.1016/j.ijrobp.2014.11.030
[11] Mattonen, S.A., Tetar, S., Palma, D.A., Louie, A.V., Senan, S. and Ward, A.D. (2015) Imaging Texture Analysis for Automated Prediction of Lung Cancer Recurrence af-ter Saf-tereotactic Radiotherapy. Journal of Medical Imaging (Bellingham), 2, 041010.
https://doi.org/10.1117/1.JMI.2.4.041010
[12] Haralick, R.M., Shanmugam, K. and Dinstein, I. (1973) Textural Features for Image Classification. IEEE Transactions on Systems, Man, and Cybernetics, 3, 610-621. [13] Palma, D.A., van Sornsen de Koste, J.R., Verbakel, W.F. and Senan, S. (2011) A New
Approach to Quantifying Lung Damage after Stereotactic Body Radiation Therapy. Acta Oncologica, 50, 509-517. https://doi.org/10.3109/0284186X.2010.541934
DOI: 10.4236/ijmpcero.2018.73027 338 Int. J. Medical Physics, Clinical Engineering and Radiation Oncology [15] Cunliffe, A.R., Armato, S.G., Fei, X.M., Tuohy, R.E. and Al-Hallaq, H.A. (2013) Lung Texture in Serial Thoracic CT Scans: Registration-Based Methods to Compare Anatomically Matched Regions. Medical Physics, 40, 061906.
https://doi.org/10.1118/1.4805110
[16] Balagurunathan, Y., Gu, Y., Wang, H., Kumar, V., Grove, O., Hawkins, S., Kim, J., Goldgof, D.B., Hall, L.O., Gatenby, R.A. and Gillies, R.J. (2014) Reproducibility and Prognosis of Quantitative Features Extracted from CT Images. Translational On-cology, 7, 72-87. https://doi.org/10.1593/tlo.13844
[17] Mackin, D., Fave, X., Zhang, L., Fried, D., Yang, J., Taylor, B., Rodriguez-Rivera, E., Dodge, C., Jones, A.K. and Court, L. (2015) Measuring Computed Tomography Scanner Variability of Radiomics Features. Investigative Radiology, 50, 757-765.
https://doi.org/10.1097/RLI.0000000000000180
[18] Hunter, L.A., Krafft, S., Stingo, F., Choi, H., Martel, M.K., Kry, S.F. and Court, L.E. (2013) High Quality Machine-Robust Image Features: Identification in Nonsmall Cell Lung Cancer Computed Tomography Images. Medical Physics, 40, 121916.
https://doi.org/10.1118/1.4829514
[19] Lo, P., Young, S., Kim, H J., Brown, M.S. and McNitt-Gray, M.F. (2016) Variability in CT Lung-Nodule Quantification: Effects of Dose Reduction and Reconstruction Methods on Density and Texture Based Features. Medical Physics, 43, 4854-4865.
https://doi.org/10.1118/1.4954845
[20] Parmar, C., Rios Velazquez, E., Leijenaar, R., Jermoumi, M., Carvalho, S., Mak, R.H., Mitra, S., Shankar, B.U., Kikinis, R., Haibe-Kains, B., Lambin, P. and Aerts, H.J. (2014) Robust Radiomics Feature Quantification Using Semiautomatic Volu-metric Segmentation. PLoS ONE, 9, e102107.
https://doi.org/10.1371/journal.pone.0102107
[21] Choi, W., Riyahi, S. and Lu, W. (2016) SU-F-R-31: Identification of Robust Normal Lung CT Texture Features for the Prediction of Radiation-Induced Lung Disease. Medical Physics, 43, 3379-3380. https://doi.org/10.1118/1.4955803
[22] Choi, W., Riyahi, S., Liu, C.-J. and Lu, W. (2017) Robust Normal Lung CT Texture Features for the Prediction of Radiation-Induced Lung Disease. International Jour-nal of Radiation Oncology*Biology*Physics, 99, S196-S197.
https://doi.org/10.1016/j.ijrobp.2017.06.488
[23] Ibanez, L., Schroeder, W., Ng, L. and Cates, J. (2005) The ITK Software Guide: Kit-ware.
[24] Galloway, M.M. (1975) Texture Analysis Using Gray Level Run Lengths. Computer Graphics and Image Processing, 4, 172-179.
https://doi.org/10.1016/S0146-664X(75)80008-6
[25] Tang, X. (1998) Texture Information in Run-Length Matrices. IEEE Transactions on Image Processing, 7, 1602-1609. https://doi.org/10.1109/83.725367