ISSN Online: 2160-8806 ISSN Print: 2160-8792
DOI: 10.4236/ojog.2018.814148 Dec. 4, 2018 1465 Open Journal of Obstetrics and Gynecology
Effect of Metformin on Endometrial Thickness
and Subendometrial Flow Patterns in
Anovulatory Patients with Polycystic Ovarian
Syndrome
Waleed M. Khalaf
1*, Sherif A. Akl
1, Rania R. Ramadan
21Obstetrics and Gynecology Department, Faculty of Medicine, Ain Shams University, Cairo, Egypt 2Misr University for Sciences and Technology, Giza, Egypt
Abstract
Background: Polycystic ovarian syndrome (PCOS) is considered the com-monest endocrinological disorder affecting reproductive aged women. PCOS compromises fertility through various pathways. These pathways include hyperandrogenism, insulin resistance and impedance of the uterine and en-dometrial blood flow. Metformin improves the blood flow to the endome-trium. It acts by reducing androgen level and correction of insulin resistance. Endometrial vascular indices were evaluated in this study to evaluate endo-metrial receptivity in anovulatory patients with PCOS. Aim of the Work: To evaluate the outcome of metformin administration in anovulatory patients with PCOS and its effect on the endometrium. This included its role in ovula-tion and improvement of pregnancy rates. Patients and Methods: This study included 85 patients from Ain Shams University outpatient infertility clinics from 1st of January, 2018 till 30th of June, 2018. We investigated these patients before treatment with ultrasound on day 14, 21. We evaluated endometrial thickness, uterine artery flow pattern, endometrial and subendometrial flow patterns. The patients received metformin 500 mg three times per day for three months. After this duration, we reevaluated them by ultrasound at days 14, 21. Results: Metformin therapy resulted in a significant increase of en-dometrial thickness and had a significant decrease on uterine, enen-dometrial and subendometrial resistance index (R.I) and pulsatility index (P.I) at day 14, 21 compared to pre-treatment values indicating better blood flow. Con-clusion: Metformin therapy resulted in improvement of endometrial flow patterns. Also, it resulted in increase in endometrial thickness and improve-ment of uterine artery flow.
How to cite this paper: Khalaf, W.M., Akl, S.A. and Ramadan, R.R. (2018) Effect of Metformin on Endometrial Thickness and Subendometrial Flow Patterns in Anovula-tory Patients with Polycystic Ovarian Syn-drome. Open Journal of Obstetrics and Gynecology, 8, 1465-1475.
https://doi.org/10.4236/ojog.2018.814148
Received: November 8, 2018 Accepted: December 1, 2018 Published: December 4, 2018
Copyright © 2018 by authors and Scientific Research Publishing Inc. This work is licensed under the Creative Commons Attribution International License (CC BY 4.0).
http://creativecommons.org/licenses/by/4.0/
DOI: 10.4236/ojog.2018.814148 1466 Open Journal of Obstetrics and Gynecology
Keywords
Endometrial Thickness, Subendometrial Flow Patterns, Anovulatory PCOS, Metformin
1. Introduction
Most women with polycystic ovarian syndrome (PCOS) have some degree of insulin resistance. It is a known fact that hyperinsulinemia augments androgen production in PCOS [1]. Insulin resistance has further been associated with ab-normal endometrial development and endometrial defects in women with PCOS. [2]. Abnormal uterine blood flow has been observed in women with PCOS; the subfertile population in general [3] and in women with idiopathic recurrent miscarriage [4].
Infertility associated with PCOS also results from chronic anovulation. There are increasing data suggesting that implantation failure can further reduce preg-nancy rates in these women [5]. Although ovulation is readily obtained with medical induction, implantation rates remain lower than fertile controls and early pregnancy loss rates are increased [2].
Metformin, an insulin sensitizer, is widely used in women with PCOS to cor-rect this biochemical disorder helping ovulation [6]. One study reported that insulin reduction with metformin enhanced uterine vascularity and reduced ute-rine vascular resistance, as demonstrated by a 20% reduction in vascular resis-tance in spiral arteries after metformin use [2]. Endometrial receptivity could be indirectly assessed by ultrasound. This includes the assessment of uterine artery velocimetry and the endometrial characteristics such as thickness, pattern and vascularity [7].
In the current study, we evaluated the effect of metformin received by anovu-latory patients with PCOS on endometrial thickness and endometrial vascular flow patterns, in addition to ovulation and pregnancy rates in these women.
2. Patients and Methods
Eighty five patients complaining of infertility due to chronic anovulation asso-ciated with PCOS were recruited from Ain Shams University Outpatient Infer-tility Clinic from January 1st, 2018 until June 30th, 2018. Patients were between 20 and 35 years of age complaining of irregular menses and fulfilling the following criteria for diagnosis of PCOS according to the Androgen Excess and Polycystic Ovarian Syndrome Society [8]:
• presence of hyperandrogenism in the form of hirsutism and/or
hyperandro-genaemia;
• presence of ovarian dysfunction in the form of oligo or anovulation and/or
polycystic ovaries by transvaginal ultrasound.
defi-DOI: 10.4236/ojog.2018.814148 1467 Open Journal of Obstetrics and Gynecology cient non-classic adrenal hyperplasia, androgen-secreting neoplasms, andro-genic/anabolic drug use or abuse, Cushing’s syndrome, the Hyperandrogen-ic-Insulin Resistance-Acanthosis Nigricans Syndrome, thyroid dysfunction and hyperprolactinemia.
Patients with regular monthly menses, receiving weight loss eating programs and/or physical exercising were excluded. Furthermore, patients with chronic medical disorders or with uterine fibroids or endometriosis or patients with en-docrinological disorders like diabetes mellitus, hypothyroidism, hyperprolacti-naemia, Cushing’s syndrome and non-classical congenital adrenal hyperplasia were also excluded.
The current study was approved by the Ethical Committee of the Department of Obstetrics and Gynecology, Faculty of Medicine, Ain Shams University. It was registered on Clinical trial.gov with I.D:NCT03486626. Written informed con-sents were obtained from all participants.
[image:3.595.209.543.441.706.2]Pretreatment with metformin, all participants were subjected to detailed his-tory taking and examination, including body mass index (BMI) calculation and hirsutism scoring using modified Ferriman Gallwey Index [9]. Hormonal pro-files for all patients were determined including follicle stimulating hormone (FSH), luteinizing hormone (LH), prolactin, thyroid stimulating hormone (TSH), androstienodione, free testosterone and 17-hydroxyprogesterone. Serum progesterone level was also measured on day 21 after withdrawal bleeding due to progestin administration. A value less than 3 ng/ml confirmed anovulation in these patients (Figure 1). Transvaginal ultrasound was done for all participants on days 14 and 21 to determine endometrial thickness, uterine artery flow pattern,
DOI: 10.4236/ojog.2018.814148 1468 Open Journal of Obstetrics and Gynecology endometrial and subendometrial flow patterns. Samsung R5 ultrasound machine equipped with a 7.5 MHz vaginal probe was used. Uterus was visualized in the longitudinal section. Endometrial thickness was identified as a double layer and maximum distance between each myometrial/endometrial interface was meas-ured. Colour flow images of the ascending main branch of the right and left ute-rine arteries at the level of the internal os in a longitudinal plane before it en-tered the uterus were visualized and studied by positioning a sample volume over the area of maximum color and by activating the pulsed Doppler. The mean of three consecutive waveforms of good quality were analyzed. Blood flow im-pedances of both uterine arteries were calculated and expressed as pulsatility in-dex [PI = (peak systolic velocity − peak diastolic velocity)/mean velocity] and re-sistance index [RI = (peak systolic velocity − peak diastolic velocity)/peak sys-tolic velocity]. Furthermore, color flow images of endometrial blood vasculature and subendometrial vessels lying within 10 mm of the echogenic endometrial borders were detected by color Doppler energy and PI and RI were calculated electronically when three similar, consecutive waveforms of good quality were obtained.
All participants received metformin 500 mg three times daily for three months. After this duration, transvaginal ultrasound was done on days 14 and 21 of a spontaneous or progestin induced menses. Serum progesterone on day 21 of a spontaneous or progestin induced menses was measured and ovulation was confirmed by a level > 3 ng/ml on day 21 of the cycle.
N.B: We measured serum progesterone on day 21 of progestin induced menses in patients with amenorrhea and in patients who got regular menses every 28 days with metformin treatment. Serum progesterone was measured one week before time of expected menses in patients who got regular cycles longer than 28 days, for example day 28 of 35 day cycle.
During the 3 months period of metformin treatment, we asked the partici-pants to measure serum B-hCG monthly in patients with amenorrhea or one week after missed period in patients who regular menses with metformin treat-ment.
Data analysis was done using SPSS program version 24. Quantitative variables were presented as mean and standard deviation, while qualitative variables were presented as count and percent. Student t test was used to compare quantitative variables between two independent groups and paired samples t test was used to compare them before and after treatment for the same group. A p-value < 0.05 was considered statistically significant.
3. Results
DOI: 10.4236/ojog.2018.814148 1469 Open Journal of Obstetrics and Gynecology Table 1. Personal data and baseline hormonal profile.
N Minimum Maximum Mean SD
Age(years) 85 20.00 36.00 24.95 3.36
BMI(kg/m2) 85 21.40 43.00 30.23 4.33
Waist/hip ratio 85 0.82 0.90 0.86 0.02
Modified FerrimanGallway score 85 12.00 19.00 16.15 1.59
FSH (mIU/ml) 85 3.60 12.00 5.80 1.33
LH (mIU/ml) 85 2.40 16.80 10.06 2.85
E2 (pg/ml) 85 23.00 78.00 42.80 12.66
Prolactin (ng/ml) 85 3.60 25.00 12.36 4.97
TSH (µIU/ml) 85 0.49 3.00 1.39 0.60
Progesterone (nmol/l) 85 1.25 3.26 2.48 0.50
17-OH-Progesterone (nmol/l) 85 3.10 79.00 6.12 8.10 Androstenedione (nmol/l) 85 5.00 6.00 5.54 0.29 Free Testosterone (pg/dl) 85 0.30 16.00 2.07 1.75
Table 2. Comparison between ultrasonographic findings before and after treatment.
Pre Post
t* Mean diff. 95% CI for diff. P value
Mean SD Mean SD Lower Upper
Endometrial Thickness day 14 (mm) 6.67 1.14 11.82 2.25 17.355 −5.15217 −5.74457 −4.55978 < 0.001 Endometrial thickness day 21 (mm) 7.84 1.13 13.21 1.50 23.943 −5.36957 −5.81708 −4.92205 < 0.001 Endometrial vascularity P.I day 14 0.93 0.09 0.80 0.09 8.584 0.13159 0.10100 0.16219 < 0.001 Endometrial vascularity R.I day 14 0.63 0.06 0.54 0.10 7.254 0.09493 0.06881 0.12104 < 0.001 Subendometrial vascularity P.I day 14 0.90 0.07 0.79 0.09 9.010 0.10826 0.08428 0.13224 < 0.001 Subendometrial vascularity R.I day 14 0.91 0.06 0.57 0.06 33.000 −0.33754 −0.35795 −0.31713 < 0.001 Endometrial vascularity P.I day 21 0.96 0.11 0.77 0.08 10.972 0.18812 0.15390 0.22233 < 0.001 Endometrial vascularity R.I day 21 0.64 0.07 0.52 0.07 9.611 0.11638 0.09221 0.14054 < 0.001 Subendometrial vascularity P.I day 21 0.95 0.05 0.77 0.06 18.817 0.18116 0.16195 0.20037 < 0.001 Subendometrial vascularity R.I day 21 0.65 0.06 0.54 0.07 1.580 0.10899 −0.02862 0.24660 0.119
Uterine artery doppler P.I day 14 3.50 0.55 2.75 0.26 10.634 0.74667 0.60656 0.88678 < 0.001 Uterine artery doppler R.I day 14 0.94 0.10 0.86 0.08 6.090 0.08203 0.05515 0.10891 < 0.001 Uterine artery doppler P.I day 21 3.42 0.61 2.70 0.25 8.309 0.72348 0.54973 0.89723 < 0.001 Uterine artery Doppler R.I day 21 0.95 0.08 0.82 0.08 9.038 0.12275 0.09565 0.14986 < 0.001 *Paired samples t test.
[image:5.595.63.539.358.634.2]DOI: 10.4236/ojog.2018.814148 1470 Open Journal of Obstetrics and Gynecology values on day 14 were 2.75 ± 0.26, 0.86 ± 0.08 and on day 21 were 3.42 ± 0.61, 0.95 ± 0.08 respectively, (p < 0.001). Pretreatment values of endometrial vessels P.I and R.I on day 14 were 0.93 ± 0.09, 0.63 ± 0.06 and on day 21 were 0.96 ± 0.11, 0.64 ± 0.07 respectively, while post-treatment values on day 14 were 0.80 ± 0.09, 0.54 ± 0.1 and on day 21 were 0.77 ± 0.08, 0.52 ± 0.07 respectively; (p < 0.001). Pretreatment values of subendometrial vessels P.I and R.I on day 14 were 0.90 ± 0.07, 0.91 ± 0.06 and on day 21 were 0.95 ± 0.05, 0.65 ± 0.06 respectively, while post-treatment values on day 14 were 0.79 ± 0.09, 0.57 ± 0.06 and on day 21 were 0.77 ± 0.06, 0.54 ± 0.07 respectively (Figure 2).
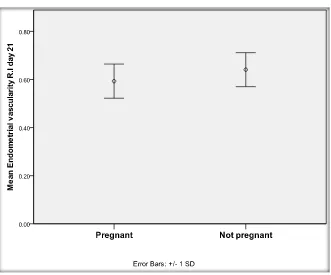
Spontaneous ovulation occurred in 30.6% of patients. Spontaneous pregnancy occurred in 16 patients (18.8%). Twelve patients got pregnant in the 3rd month of treatment, while 3 patients got pregnant in the 2nd month of treatment and only one patient got pregnant in the 1st month of treatment. Table 3 shows that there is a statistically insignificant difference between all personal data and hor-monal profiles between pregnant and non-pregnant patients. Table 4 shows that there is no statistically significant difference regarding ultrasound data between pregnant and non-pregnant participants before treatment with metformin (p > 0.05) except for 2 measurements which are endometrial flow R.I on day 21 and subendometrial flow P.I on day 21 which were significantly different (p < 0.001) (Figure 3).
4. Discussion
[image:6.595.210.541.422.697.2]For Implantation to be of great success, it depends on an interaction between the
DOI: 10.4236/ojog.2018.814148 1471 Open Journal of Obstetrics and Gynecology Table 3. Comparison between pregnant and non-pregnant regarding personal data and baseline hormonal profile.
Pregnant
(N = 16) Not pregnant (N = 69) t* Mean diff. 95% CI for diff. P value
Mean SD Mean SD Lower Upper
Age (years) 24.63 2.66 25.03 3.51 0.432 −0.40399 −2.26490 1.45693 0.667 BMI (kg/m2) 31.34 3.65 29.97 4.46 1.147 1.37708 −1.01056 3.76473 0.255 waist/hip ratio 0.86 0.02 0.86 0.02 0.453 −0.00222 −0.01195 0.00751 0.651 Modified FerrimanGallway score 16.19 1.87 16.14 1.54 0.096 0.04257 −0.84150 0.92665 0.924 FSH (mIU/ml) 5.42 0.85 5.89 1.41 1.292 −0.47487 −1.20590 0.25615 0.200 LH (mIU/ml) 9.70 1.78 10.15 3.04 0.779 −0.44931 −1.61624 0.71762 0.441 E2(pg/ml) 42.96 11.50 42.77 13.00 0.054 0.19103 −6.83959 7.22165 0.957 Prolactin (ng/ml) 13.66 5.73 12.06 4.78 1.163 1.60076 −1.13786 4.33938 0.248 TSH(µIU/ml) 1.16 0.48 1.44 0.62 1.726 −0.28535 −0.61416 0.04346 0.088 Progesterone (nmol/l) 2.37 0.49 2.50 0.51 0.937 −0.13106 −0.40917 0.14705 0.351 17-OH-Progesterone (nmol/l) 4.83 1.08 6.41 8.96 0.703 −1.58324 −6.06494 2.89846 0.484 Androstenedione (nmol/l) 5.56 0.30 5.54 0.29 0.209 0.01712 −0.14592 0.18016 0.835 Free Testosterone (pg/dl) 1.91 0.79 2.11 1.91 0.424 −0.20679 −1.17650 0.76292 0.673 *Student t test.
Table 4. Comparison between pregnant and non-pregnant regarding ultrasonographic data before treatment.
Pregnant
(N = 16) Not pregnant (N = 69) t* Mean diff. 95%CI for diff. P value
Mean SD Mean SD Lower Upper
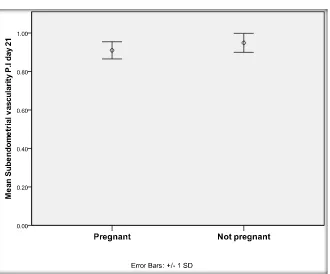
[image:7.595.69.540.407.707.2]DOI: 10.4236/ojog.2018.814148 1472 Open Journal of Obstetrics and Gynecology Figure 3. Comparison between pregnant and not pregnant regarding subendometrial vascularity P.I day 21 before treatment.
receptive endometrium and the blastocyst. Endometrial receptivity can be eva-luated by histologic evaluation of an endometrial biopsy, endometrial proteins in uterine flushing, or more commonly ultrasound examination of the endome-trium. Different ultrasound parameters have been used to assess endometrial re-ceptivity including endometrial thickness, endometrial pattern, endometrial vo-lume, Doppler study of uterine arteries, and endometrial blood flow. [10]
Anovulatory women with PCOS were investigated before and after 3 months of treatment with metformin regarding endometrial thickness, uterine, endome-trial and subendomeendome-trial vascular indices. Endometrium was significantly thin-ner before the treatment. All vascular indices were significantly higher before treatment with metformin compared to post-treatment values. These results were the same as Palomba et al. [11]
Battaglia et al. concluded that anovulatory patients with PCOS have an altera-tion in uterine vascularizaaltera-tion [12]. In fact, PI and RI values, two measures of blood impedance inversely related to blood flow, were not only unchanged throughout the cycle [13] but also significantly higher before the treatment.
indi-DOI: 10.4236/ojog.2018.814148 1473 Open Journal of Obstetrics and Gynecology cators of endometrial receptivity [16].
In the current study, metformin therapy led to significant increase in endo-metrial thickness and had a significant effect on uterine RI and PI. On the en-dometrial level, enen-dometrial and subenen-dometrial R.I and P.I were significantly reduced after metformin treatment indicating better blood flow. In response to metformin therapy, ovulation was achieved in 26 women (30.6%). Pregnancy rate was 18.8%. Twelve patients got pregnant in the 3rd month of treatment. That may be explained by the cumulative effect of metformin action. There were no significant differences between pregnant and non-pregnant women regarding endometrial thickness, personal data nor hormonal profiles. Likewise, pretreat-ment values of uterine RI and PI were insignificantly different in pregnant com-pared to non-pregnant women; however, decreased endometrial flow R.I on day 21 and decreased subendometrial flow P.I on day 21 was significantly different.
Metformin did improve the ovulation and clinical pregnancy rates when add-ed to letrozole or clomiphene citrate for ovulation induction in PCOS patients this is attributed to the addition of either letrozole or clomiphene citrate [17]. Endometrial thickness was considered a marker for uterine receptivity and for pregnancy prediction with different results. Although Kocak et al. [18] demon-strated a significant effect of metformin on endometrial thickness in PCOS women treated with clomiphene citrate, the study done by Maged et al. [19] showed that there was no improvement in endometrial thickness with min therapy and that treatment with N-Acetyl Cysteine was superior to metfor-min. In the current study, metformin treatment increased endometrial thickness significantly. This variation in results could be attributed to the lower Ferriman Gallway starting score used or the different inclusion criteria. The results of the current study demonstrated the vascular effect of metformin on the endome-trium and uterine artery flow pattern. It also demonstrated an improvement of endometrial and subendometrial flow patterns after metformin therapy.
Limitation of the Study
Longer duration of treatment might give more conclusive results. Also investi-gating hormonal profile post treatment could have been done to give an idea on whether metformin has an effect on the hormonal profile in this group of pa-tients. Better assessment of the parameters of the endometrium should have been done by 3-dimensional ultrasound.
5. Conclusion
DOI: 10.4236/ojog.2018.814148 1474 Open Journal of Obstetrics and Gynecology of the variables also renders it impossible to establish a practical cut-off level.
Acknowledgements
Special thanks goes to the U/S team of Ain Shams University Maternity Hospital who participated in the study and to our patients for great support to our work. Also, special thanks to Prof. Dr/Alaa Sayed Abdelhafeez for her great support and help.
Funding
No funds were received from any funding agency.
Conflicts of Interest
No potential conflict of interest was reported by the authors.
Informed Consent
Informed consents were obtained from all participants.
References
[1] Blank, S.K., McCartney, C.R., Chhabra, S., Helm, K.D., Eagleson, C.A., Chang, R.J., et al. (2009) Modulation of GnRH Pulse Generator Sensitivity to Progesterone Inhi-bition in Hyperandrogenemic Adolescent Girls: Implications for Regulation of Pu-bertal Maturation. The Journal of Clinical Endocrinology & Metabolism, 94, 2360-2366.
[2] Jakubowicz, D.J., Seppala, M., Jakubowicz, S., Rodriguez-Armas, O., Rivas-Santiago, A., Koistinen, H., Koistinen, R. and Nestler, J.E. (2001) Insulin Reduction with Metformin Increases Luteal Phase Serum Glycodelin and Insulin-Like Growth Fac-tor-Binding Protein 1 Concentrations and Enhances Uterine Vascularity and Blood Flow in the Polycystic Ovary Syndrome. The Journal of Clinical Endocrinology & Metabolism, 86, 1126-1133.
[3] Isaksson, R., Tiitinen, A., Reinikainen, L.M. and Cacciatore, B. (2003) Comparison of Uterine and Spiral Artery Blood Flow in Women with Unexplained and Tubal Infertility. Ultrasound in Obstetrics & Gynecology, 21, 174-180.
https://doi.org/10.1002/uog.27
[4] Ferreira, A.M., Pires, C.R., Moron, A.F., Araujo, E., Traina, E. and Mattar, R. (2007) Doppler Assessment of Uterine Blood Flow in Recurrent Pregnancy Loss. Interna-tional Journal of Gynecology & Obstetrics, 98, 115-119.
https://doi.org/10.1016/j.ijgo.2007.05.006
[5] Korgun, E.T., Denir, R., Hammer, A., Dohr, G., Desoye, G., Skofitch, G. and Hahn, T. (2001) Glucose Transporter Expression in Rat Embryo and Uterus during Deci-dualization, Implantation, and Early Postimplantation. Biology of Reproduction, 65, 1364-1370. https://doi.org/10.1095/biolreprod65.5.1364
[6] Creanga, A.A., Bradley, H.M., McCormick, C. and Witkop, C.T. (2008) Use of Metformin in Polycystic Ovary Syndrome: A Meta-Analysis. Obstetrics & Gynecol-ogy, 111, 959-968. https://doi.org/10.1097/AOG.0b013e31816a4ed4
DOI: 10.4236/ojog.2018.814148 1475 Open Journal of Obstetrics and Gynecology https://doi.org/10.1016/S1701-2163(16)30578-3
[8] Azziz, R., Carmina, E., Dewailly, D., Diamanti-Kandarakis, E., EscobarMorreale, H.F., Futterweit, W., et al. (2009) The Androgen Excess and PCOS Society Criteria for the Polycystic Ovary Syndrome: The Complete Task Force Report. Fertility and Sterility, 91, 456-488. https://doi.org/10.1016/j.fertnstert.2008.06.035
[9] Archer, J.S. and Chang, R.J. (2004) Hirsutism and Acne in Polycystic Ovary Syn-drome. Best Practice & Research Clinical Obstetrics & Gynaecology, 18, 737-54 [10] Tropea, A., Miceli, F., Minici, F., Orlando, M., Lamanna, G., Gangale, M., Catino,
S., Lanzone, A. and Apa, R. (2004) Endometrial Evaluation in Superovulation Pro-grams: Relationship with Successful Outcome. Annals of the New York Academy of Sciences, 1034, 211-218. https://doi.org/10.1196/annals.1335.023
[11] Palomba, S., Russo, T., Orio, F., Falbo, A., Manguso, F., Cascella, T., Tolino, A., Carmina, E., Colao, A. and Zullo, F. (2006) Uterine Effects of Metformin Adminis-tration in Anovulatory Women with Polycystic Ovary Syndrome. Human Repro-duction, 21, 457-465. https://doi.org/10.1093/humrep/dei351
[12] Battaglia, C., Mancini, F., Persico, N., Zaccaria, V. and de Aloysio, D. (2004) Ultra-sound Evaluation of PCO, PCOS and OHSS. Reproductive Biomedicine Online, 9, 614-619. https://doi.org/10.1016/S1472-6483(10)61770-1
[13] Vrtačnik-Bokal, E., Meden-Vrtovec, H. and Verdenik, I. (2006) Uterine Arterial Blood Flow and the Substances of Ovarian Renin-Angiotensin System in Women with Polycystic Ovaries Undergoing In Vitro Fertilization. European Journal of Ob-stetrics & Gynecology and Reproductive Biology, 124, 77-81.
https://doi.org/10.1016/j.ejogrb.2005.08.004
[14] Mohsen, I.A., Elkattan, E., Nabil, H. and Khattab, S. (2013) Effect of Metformin Treatment on Endometrial Vascular Indices in Anovulatory Obese/Overweight Women with Polycystic Ovarian Syndrome Using Three-Dimensional Power Doppler Ultrasonography. Journal of Clinical Ultrasound, 41, 275-282.
https://doi.org/10.1002/jcu.22006
[15] Özkan, S., Vural, B., Çalışkan, E., Bodur, H., Türköz, E. and Vural, F. (2007) Color Doppler Sonographic Analysis of Uterine and Ovarian Artery Blood Flow in Women with Polycystic Ovary Syndrome. Journal of Clinical Ultrasound, 35, 305-313. https://doi.org/10.1002/jcu.20358
[16] Rosenfield, R.L. and Ehrmann, D.A. (2016) The Pathogenesis of Polycystic Ovary Syndrome (PCOS): The Hypothesis of PCOS as Functional Ovarian Hyperandro-genism Revisited. Endocrine Reviews, 37, 467-520.
https://doi.org/10.1210/er.2015-1104
[17] Khan, Z., Khan, R., Bukhari, A.S. and Ahmad, W. (2017) Comparative Effectiveness of Ovulation Induction Therapy in Women with Polycystic Ovarian Syndrome. Journal of the Society of Obstetrics and Gynaecologists of Pakistan, 7, 128-132. [18] Kocak, M., Caliskan, E., Simsir, C. and Haberal, A. (2002) Metformin Therapy
Im-proves Ovulatory Rates, Cervical Scores, and Pregnancy Rates in Clomiphene Ci-trate-Resistant Women with Polycystic Ovary Syndrome. Fertility and Sterility, 77, 101-106. https://doi.org/10.1016/S0015-0282(01)02941-7