PRODUCTION, CHARACTERIZATION AND SENSORY ANALYSIS OF WINES (
FROM GRAPES PRODUCED IN A SUBTROPICAL REGION
*,1
Tatiana Abreu Reis,
2 1Renata de Paulo Rocha
and
1
Food Science Department – DCA, Federal University of Lavras
2Agriculture Department – DAG, Federal University of Lavras
ARTICLE INFO ABSTRACT
The aim of this study was to evaluate the physical, chemical and sensory characteristics of wines from different grape cultivars (
‘Niagara Rosada’, ‘Bordo’, ‘Isabel Precoce’, ‘BRS Rúbea’, ‘BRS Cora’ and ‘Concord Clone 30’, used to produce the experimental wines, were produced in the orchard of the University Federal of Lavras, from August to December 2013. The winemaking fo
analyses used to physically and chemically characterize the wines were: soluble solids (SS), titratable acidity (TA), SS/TA ratio, pH, total sugars, reducing and non
alcohol/reduced dry extract ratio, density, antioxidant activity by DPPH and β
phenolics, vitamin C, anthocyanins and color (L*, a*, b* and C). The sensory analysis ac
performed with 50 tasters, who evaluated the attributes: appearance, aroma, taste, overall impression and purchase intention. The different wines produced are within the standards of wine identity and quality, proposed by Brazilian legisl
studies with wines from traditional wine the 'Niagara Rosada' wine was light
among cultivars, considering the biochemical aspect and the grape metabolism, the antioxidant activity, phenolic compounds content, ascorbic acid and anthocyanin content varied. Thes
interference of soil and climate conditions on the cultivar adaptation response in the region where the experiment was conducted, especially the cultivars ‘Bordô’ and ‘BRS Cora’. Overall, average sensory analysis scores o samples fell between 4.56 and 7.22 on the hedonic scale, represented by the categories "neither liked nor disliked” and “liked moderately”, respectively, highlighting the ‘Bordô’, ‘Niagara Rosada’, ‘BRS Rúbea’ and ‘Concord Clone 30’ cultivars, which
purchase intention attributes. Regarding purchase intent of the different wines, the tasters answered "do not know if I would buy” and/or “I probably would not buy", which may be
context, production of grapes from different cultivars (
conducted as an alternative for the development and establishment of rural populations, si
positively influence physicochemical composition and sensory aspects of cultivated grapes. This allows, therefore, the development of products derived from grapes, with competitive features which may be accepted by a different public, which has a preference for dryer wines.
Copyright©2016, Tatiana Abreu Reis et al. This is an open access article distributed under the Creative Commons Att use, distribution, and reproduction in any medium, provided the original work is properly cited.
INTRODUCTION
The American grape is a fruit that has aroused interest because of its high productivity, rusticity and fruit use in various forms. The products obtained from its processing are greatly
*Corresponding author: Tatiana Abreu Reis,
Food Science Department – DCA, Federal University of Lavras UFLA; PO Box 3037; Zip code 37200.000 - Lavras, Minas Gerais, Brazil.
ISSN: 0975-833X
Article History: Received 03rd May, 2016
Received in revised form 20th June, 2016
Accepted 07th July, 2016
Published online 31st August,2016
Key words: American grapes, Seasonality, Winemaking, New product, Physicochemical and Sensory characteristics.
Citation: Tatiana Abreu Reis, Gabriel Abreu Reis, Rafaela Araújo Zambaldi Lima wines (Vitis spp.) from grapes produced in a subtropical region
RESEARCH ARTICLE
PRODUCTION, CHARACTERIZATION AND SENSORY ANALYSIS OF WINES (
FROM GRAPES PRODUCED IN A SUBTROPICAL REGION
2
Gabriel Abreu Reis,
2Rafaela Araújo Zambaldi Lima
Rocha,
2Antonio Decarlos Neto,
1Taciene Carvalho Mesquita
and
1Luiz Carlos de Oliveira Lima
DCA, Federal University of Lavras - UFLA; PO Box 3037; Zip code 37200.000
Lavras, Minas Gerais, Brazil
DAG, Federal University of Lavras - UFLA; PO Box 3037; Zip code 37200.000
Lavras, Minas Gerais, Brazil
ABSTRACT
The aim of this study was to evaluate the physical, chemical and sensory characteristics of wines from different grape cultivars (Vitis spp.) produced in Lavras, in the southwest of Minas Gerais, Brazil. Grapes of ‘Niagara Rosada’, ‘Bordo’, ‘Isabel Precoce’, ‘BRS Rúbea’, ‘BRS Cora’ and ‘Concord Clone 30’, used to produce the experimental wines, were produced in the orchard of the University Federal of Lavras, from August to December 2013. The winemaking followed the methodology proposed by Malgarin
analyses used to physically and chemically characterize the wines were: soluble solids (SS), titratable acidity (TA), SS/TA ratio, pH, total sugars, reducing and non-reducing sugars, dry extract, reduced dry extract, alcohol content, alcohol/reduced dry extract ratio, density, antioxidant activity by DPPH and β
phenolics, vitamin C, anthocyanins and color (L*, a*, b* and C). The sensory analysis ac
performed with 50 tasters, who evaluated the attributes: appearance, aroma, taste, overall impression and purchase intention. The different wines produced are within the standards of wine identity and quality, proposed by Brazilian legislation and the values of the variables found in the samples are close to reference values presented in studies with wines from traditional wine-growing regions in Brazil. The wines were classified as dry table wines; the 'Niagara Rosada' wine was light-bodied and the others were considered more full
among cultivars, considering the biochemical aspect and the grape metabolism, the antioxidant activity, phenolic compounds content, ascorbic acid and anthocyanin content varied. Thes
interference of soil and climate conditions on the cultivar adaptation response in the region where the experiment was conducted, especially the cultivars ‘Bordô’ and ‘BRS Cora’. Overall, average sensory analysis scores o samples fell between 4.56 and 7.22 on the hedonic scale, represented by the categories "neither liked nor disliked” and “liked moderately”, respectively, highlighting the ‘Bordô’, ‘Niagara Rosada’, ‘BRS Rúbea’ and ‘Concord Clone 30’ cultivars, which were preferred by consumers regarding aroma and taste, overall impression and purchase intention attributes. Regarding purchase intent of the different wines, the tasters answered "do not know if I would buy” and/or “I probably would not buy", which may be related to the profile of the tasters. In this context, production of grapes from different cultivars (Vitis spp.) for wine production in subtropical regions can be conducted as an alternative for the development and establishment of rural populations, si
positively influence physicochemical composition and sensory aspects of cultivated grapes. This allows, therefore, the development of products derived from grapes, with competitive features which may be accepted by a different
, which has a preference for dryer wines.
is an open access article distributed under the Creative Commons Attribution License, which use, distribution, and reproduction in any medium, provided the original work is properly cited.
The American grape is a fruit that has aroused interest because of its high productivity, rusticity and fruit use in various forms. The products obtained from its processing are greatly
DCA, Federal University of Lavras - Lavras, Minas Gerais,
appreciated by consumers, who increasingly demand food products ready for consumption, especially those with high nutritional and technological value.
have shown that a healthy diet, with high vegetable intake, can minimize the risk of chronic
emergence (Cerqueira et al., 2007), contributing to improved life quality and successful aging (
According to the Pan American Health Organization (2003), insufficient fruit consumption is among the ten most important
International Journal of Current Research
Vol. 8, Issue, 08, pp.36733-36744, August, 2016
INTERNATIONAL
Tatiana Abreu Reis, Gabriel Abreu Reis, Rafaela Araújo Zambaldi Lima et al. 2016. “Production, characterization and sensory analysis of spp.) from grapes produced in a subtropical region”, International Journal of Current Research, 8, (08), 36733
PRODUCTION, CHARACTERIZATION AND SENSORY ANALYSIS OF WINES (Vitis spp.)
FROM GRAPES PRODUCED IN A SUBTROPICAL REGION
Rafaela Araújo Zambaldi Lima,
Taciene Carvalho Mesquita
Box 3037; Zip code 37200.000 -
UFLA; PO Box 3037; Zip code 37200.000 -
The aim of this study was to evaluate the physical, chemical and sensory characteristics of wines from different spp.) produced in Lavras, in the southwest of Minas Gerais, Brazil. Grapes of cultivars ‘Niagara Rosada’, ‘Bordo’, ‘Isabel Precoce’, ‘BRS Rúbea’, ‘BRS Cora’ and ‘Concord Clone 30’, used to produce the experimental wines, were produced in the orchard of the University Federal of Lavras, from August to llowed the methodology proposed by Malgarin et al., (2006), adapted. The analyses used to physically and chemically characterize the wines were: soluble solids (SS), titratable acidity (TA), dry extract, reduced dry extract, alcohol content, alcohol/reduced dry extract ratio, density, antioxidant activity by DPPH and β-carotene/linoleic acid methods, total phenolics, vitamin C, anthocyanins and color (L*, a*, b* and C). The sensory analysis acceptance test was performed with 50 tasters, who evaluated the attributes: appearance, aroma, taste, overall impression and purchase intention. The different wines produced are within the standards of wine identity and quality, proposed by ation and the values of the variables found in the samples are close to reference values presented in growing regions in Brazil. The wines were classified as dry table wines; ed and the others were considered more full-bodied. Due to the difference among cultivars, considering the biochemical aspect and the grape metabolism, the antioxidant activity, phenolic compounds content, ascorbic acid and anthocyanin content varied. These differences suggest the possible interference of soil and climate conditions on the cultivar adaptation response in the region where the experiment was conducted, especially the cultivars ‘Bordô’ and ‘BRS Cora’. Overall, average sensory analysis scores of the samples fell between 4.56 and 7.22 on the hedonic scale, represented by the categories "neither liked nor disliked” and “liked moderately”, respectively, highlighting the ‘Bordô’, ‘Niagara Rosada’, ‘BRS Rúbea’ and ‘Concord were preferred by consumers regarding aroma and taste, overall impression and purchase intention attributes. Regarding purchase intent of the different wines, the tasters answered "do not know related to the profile of the tasters. In this spp.) for wine production in subtropical regions can be conducted as an alternative for the development and establishment of rural populations, since climate conditions positively influence physicochemical composition and sensory aspects of cultivated grapes. This allows, therefore, the development of products derived from grapes, with competitive features which may be accepted by a different
ribution License, which permits unrestricted
appreciated by consumers, who increasingly demand food products ready for consumption, especially those with high nological value. Epidemiological studies have shown that a healthy diet, with high vegetable intake, can minimize the risk of chronic no communicable disease 2007), contributing to improved life quality and successful aging (Terra et al., 2011). According to the Pan American Health Organization (2003), insufficient fruit consumption is among the ten most important
INTERNATIONAL JOURNAL OF CURRENT RESEARCH
risk factors for disease development. Some studies suggest that red wine consumption, in moderate doses, provides a protective effect on the cardiovascular system, causing an increase in HDL-c levels (Soares Filho et al. 2011; De Moraes and Locatelli, 2012; Chiva-Blanchet et al., 2013) and a reduction in LDL levels (Abe et al., 2007; Cerqueira et al., 2007). Furthermore, studies by Karling (2013) report multiple biological effects related to dietary phenolic compounds, such as antioxidant, antiinflammatory, antimicrobial and anticarcinogenic activity. Among the vegetable products, wine has attracted scientific interest as it presents a wide range of substances, highlighting the oxidants, reducing agents and catalysts, as well as phenolic compounds, tannins and anthocyanins, which contribute to the definition of its sensory characteristics such as taste, texture and color. However, it is known that the phenolic compounds composition and concentration are influenced by numerous factors, such as grape cultivar and climatic and cultivation conditions (Recamales et al., 2006; Orduña, 2010; Karling, 2013).
According to studies by Oliveira (2012), Brazilian red wines currently are at quality level comparable to major global wine producers. Soil, climate and production conditions provide favorable conditions for the grapes to develop high phenolic compound concentrations, which are potential bioactive compounds. As a result, wines produced from grapes planted and grown in Brazilian soil exhibit high levels of antioxidant phenolic compounds, comparable or even superior in some cases, to the average contents mentioned in the literature on wines from other countries. In this context, there is a need for studies that take this approach to wines produced in the Southwest region of Minas Gerais, thus contributing to viticulture implementation in this region. Thus, the aim of this study was to evaluate the physical, chemical and sensory characteristics of wines (Vitis spp.) made from grapes produced at the Federal University of Lavras, in the city of Lavras, southwest of Minas Gerais, Brazil.
MATERIALS AND METHODS
Grape production and harvest
The experiment was conducted in the years 2013 and 2014, at the Federal University of Lavras - MG, Brazil, located at Latitude 21:23° W and Longitude 44.98 °S at an altitude of 919 m. Grapes from ‘BRS Cora’, ‘Isabel Precoce’, ‘BRS Rúbea’, ‘Bordô’, ‘Concord Clone 30’ and ‘Niagara Rosada’ cultivars, used for wine production in this experiment were produced in the institution orchard, from August to December 2013. After the 2013-2014 crop harvest, manual stem removal and hygiene, the grapes were destined for winemaking.
Wine production
The wines were experimentally produced at the Fruit and Vegetable Postharvest Physiology Laboratory of the Food Science Department, Federal University of Lavras (UFLA – Lavras, MG), according to methodology proposed by Malgarin et al. (2006), adapted. For the wine production, de-stemming and must extraction were performed manually. Potassium metabisulfite was added (K2S2O5) at a dosage of 6 g Kg-1 of
must, and in order to achieve an alcohol content of approximately 10.5%, the proportion of 3.56 kg sucrose for each 100 liters of must was added (MALGARIN, et al., 2006). Maceration was carried out in a plastic container with a 10 L capacity. After the maceration period, with three daily remontages, the must was drained with subsequent filtration and separation. After 20 days of fermentation, the first racking was performed, filtering the liquid and topping up every two days. The second racking was performed after 25 days, filtering up again using organza, for a total of 45 days of fermentation. After the wine stabilization period (40 days), it were bottled and the analyses were performed.
Wine characterization analyses
Wine density determination followed methodology proposed by the Association of Official Analytical Chemists (A.O.A.C.) (1990). The pH measurement was made in the filtered wine, using a Tecnal (Tec 3M) pH meter with a glass electrode, according to AOAC (2007) recommendations. Wine soluble solids (SS) were determined in a homogenate filtered through filter paper, prepared in a 1:4 (10 ml of wine in 30 ml of distilled water) ratio using a digital refractometer ATAGO PR-100 and the results were expressed in %, according to AOAC (2007) methodology. Total acidity (TA) determination was done in the same homogenate prepared for SS measurement, following methodology proposed by AOAC (2007). Titration was carried out with sodium hydroxide (NaOH) solution 0.1 mol L-1, and the results were expressed in percentage (%) of tartaric acid 100 mL-1, considering the molecular weight of tartaric acid 150.09 g/mol. To calculate the SS/TA ratio, the total soluble solids content was divided by the titratable acidity. Total sugars, reducing and non-reducing sugars were quantified by the Somogy technique, adapted by Nelson (1944), and the determination was carried out in the ethanolic wine extract. Absorbance readings of the sample were taken at 510 nm in a Beckman 640 B spectrophotometer using a computerized system. Determination of wine samples dry extract and reduced dry extract was performed following the Adolfo Lutz Institute (1985) methodology.
Wine antioxidant activity determination was performed by the DPPH radical (2,2-diphenyl-1-picryl-hydrazyl) sequestration method by antioxidants according to Brand-Williams, Cuvelier and Berset (1995), adapted by Rufino et al. (2007a). To determine the antioxidant activity, the same extracts used for
total phenolics determination were used, as suggested by Larrauri, Rupérez and Saura-Calixto (1997). Evaluation of
system (CIE, 1978) to assess the L*, a* and b* coordinates. The a* and b* values obtained were used in the calculation of Hue angle and chromaticity, following recommendations by McGuire (1992). The Hue angle of the wines was calculated according to the following equation: hº = tan-1 (b*/a*).
Chromaticity was calculated by the equation: C * =
To analyze the wine samples sensory attributes, tests were conducted at the Sensory Analysis Laboratory of the Department of Food Science at the Federal University of Lavras. The tests were approved by the Human Research Ethics Committee with Opinion Number: 728950 and report date: 7/25/2014. For such, affective methods suggested by Meilgaard et al. (1999) were employed. Sensory tests were performed - according to interest and availability - with 50 untrained tasters over 18years of age of both sexes, who reported to appreciate the drink Seccions were held in the Department of Food Science (DCA) - UFLA. Wines were laid out in 50 mL cups, coded with random three-digit numbers and
served in compliance with the sample presentation
order criteria suggested by Wakeling and Macfie (1995).Wine acceptability was measured by applying an Acceptance Test, in which the samples were evaluated on a 9 point hedonic scale, Score 1 representing "extremely disliked" and Score 9, "extremely liked". In this test we evaluated the following wine attributes: appearance, aroma, taste and overall impression. At the same time a Purchase Intent Test was performed, in order to identify consumer attitude towards the product assessed. For such, a structured 5-point scale was used, where Value 1 is "certainly would not buy" and the Value 5 is "certainly would buy”.
Statistical Analysis
This study used a completely randomized design (CRD) containing 6 treatments, composed of wines from 6 different grape varieties, formulated 3 times, all the physical and chemical analyzes being performed in triplicate. The treatments were analyzed by the Scott-Knott average test (Scott and Knott, 1974) at 5% probability. For this, we used the ScottKnott package (Jelihovschi et al., 2014) from the R software (R Development Core Team, 2012).
Multivariate analysis was also performed on the results of acceptance/preference of sensory attributes, obtained from the affective test. A vectorial Internal Preference Map (MPI) was generated. The data set was arranged in a matrix with 6 lines (V1 to V6 treatments) versus 50 columns (consumers). Vectorial internal preference map plots were obtained using the SensoMaker software version 1.8 (PINHEIRO; NUNES; VIETORIS, 2013).
RESULTS AND DISCUSSION
Physicochemical characterization of the produced wines is extremely important because it helps the observation of aspects that make the product accepted, or not, by the consumer.
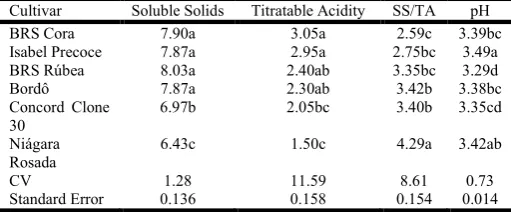
[image:3.595.305.561.98.204.2]Table 1 shows the average values of soluble solids (TSS), titratable acidity (TA), SS/TA ratio and pH of the six different Vitis spp. wines elaborated.
Table 1. Average soluble solids SS (%), titratable acidity TA (% tartaric acid) SS/TA ratio and pH values of six different Vitis spp.
Wines
Cultivar Soluble Solids Titratable Acidity SS/TA pH BRS Cora 7.90a 3.05a 2.59c 3.39bc Isabel Precoce 7.87a 2.95a 2.75bc 3.49a BRS Rúbea 8.03a 2.40ab 3.35bc 3.29d Bordô 7.87a 2.30ab 3.42b 3.38bc Concord Clone
30
6.97b 2.05bc 3.40b 3.35cd
Niágara Rosada
6.43c 1.50c 4.29a 3.42ab
CV 1.28 11.59 8.61 0.73
Standard Error 0.136 0.158 0.154 0.014 Means followed by the same letter in the column do not differ by the Scott-Knott test at 5% probability.
The pH aims to quantify the hydrogen ions (H+) concentration in the product and is related to the drink stability, since the lower its value, the less subject the wine is to the action of spoilage microorganisms. The pH also affects the product taste and color, among other factors (Ough and Amerine, 1988). According to Rizzon and Salvador (1987a), the pH of table wines should not exceed 3.6, all samples of this study being within these parameters.
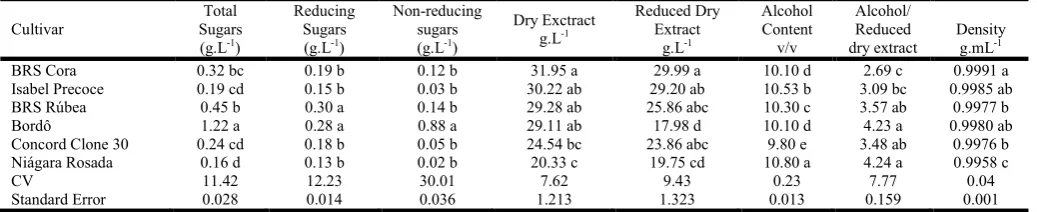
Table 2 presents the average values of reducing and non-reducing sugars, sucrose, dry extract, reduced dry extract, alcohol content, alcohol/reduced dry ratio and density of six different Vitis spp. wines.
It is observed that there was a statistical difference for total sugars (Table 2): the wine made from Bordô grape presented the highest value and that made from Niagara Rosada had the lowest value. For reducing sugars wine samples Bordô and BRS Rúbea showed the highest values when compared to the others. Regarding non-reducing sugars analysis, only the wine made from Bordô grape showed statistical difference, with higher levels when compared to other wines. Regarding the analyzed wine, all samples showed levels lower than 4 g.L-1for reducing sugars, which is the maximum allowed by law - Decree No. 229 of 10/25/88 (Uvibra, 2007, Apud Tecchio, 2007). Higher levels of reducing sugars, besides indicating that the yeast did not complete the alcoholic fermentation, can endanger wine stability. The major sugars present in wine are glucose and fructose, which come from the grape. These are called reducing sugars and correspond to those that have turned into alcohol by yeast during fermentation (Silva et al., 2003b; Almeida, et al., 2011). These molecules present in wine are responsible for the drink sweetness sensation and for the suppressive effect of the acid taste (Nordeloos & Nagel, 1972). In some cases, when the wine undergoes the chaptalization step, sucrose presence can also be observed in the drink. Brazilian law determines that dry table wines must have a maximum level of 5 g.L-1 of glucose, medium dry or demi-sec between 5.1 and 20 g.L-1 and sweet, light or liqueur wines quantities above 20.1 g.L-1 of glucose (Brasil, 1988). According to the results obtained in this study, the different wines produced can be classified as dry table wines. Table 2 shows that there was also statistical difference for dry matter analysis, where the wine made from BRS Cora grape had the highest value and that prepared from Niagara Rosada showed the lowest. The other samples presented intermediate content. As for the reduced dry extract, the wine made from BRS Cora
grape also had the highest content and the lowest was observed in the wine made from Bordô grape. The total dry extract refers to the weight of the remaining dry residue after evaporation of wine volatile compounds. It is composed primarily of non-volatile acids, organic and mineral salts, phenolic compounds, nitrogen compounds, sugars, polysaccharides, tannins and pigments (Rizzon, 1996). The dry extract is related to the body and structure perception of the drink, and its content in the wine depends on the grape variety, its sugar content and chaptalization carried out in the wine processing. The reduced dry extract is the difference between the wine total dry solid content and sugar content. Brazilian wine legislation does not establish dry extract or reduced dry extract values. Hashizume (2001) stated that the extract content determines the wine body: beverages with less than 20 g.L-1 of extract are considered light-bodied and above 25 g.L-1, full-bodied. Thus, among the wines produced in this study only that from ‘Niagara Rosada’ grape is considered light-bodied and the others are considered more full-bodied.
Malgarin and colleagues (2006), in their studies with different microvinification processes of Bordô grapes, found values for this variable between 17.14 and 23.70 g.L-1, which are lower than those observed in the present study, when compared to the same cultivar. The reduced dry extract values ranged between 17.98 and 29.99 g.L-1, which corroborate studies from Uliana
et al. (2015), who observed values from 20.8 to 26.1 g.L-1,
[image:4.595.38.557.87.193.2]which are also close to those found in the literature for these types of wines (Rizzon et al., 2000; Tecchio et al., 2007). The wine total dry matter content has been considered as one of the main parameters which characterizes its quality, structure, body and even its genuineness and may vary depending on the winemaking techniques such as crushing, draining, maceration, maceration time, alcohol content; and also because these are factors that favor the extraction of grape mineral and organic matter (Sampaio, 2005). In the legislation, the alcohol/reduced dry extract ratio is more important than the total dry extract, because it allows to detect the addition of alcohol, water and sugar to the wine before bottling, among other frauds (Avila, 2002). Ordinance No. 229 of 10/25/88 (Uvibra, 2005), provides a maximum level of 4.8 for alcohol/reduced dry extract ratio for common red wine. This ratio represents the balance between wine fixed and volatile constituents (Rizzon and Miele, 1996). Thus, it is observed (Table 1) that the different wines produced are within the limits permitted by law and also in accordance with values found in the literature (Rizzon et al., 2000; Rizzon and Miele, 2006; Tecchio et al.,
Table 2. Average values for total, reducing and non-reducing sugars, dry extract, reduced dry extract, alcohol content, alcohol/ reduced dry extract ratio and density of six different Vitis spp. Wines
Cultivar
Total Sugars (g.L-1)
Reducing Sugars (g.L-1)
Non-reducing sugars (g.L-1)
Dry Exctract g.L-1
Reduced Dry Extract
g.L-1
Alcohol Content
v/v
Alcohol/ Reduced dry extract
Density g.mL-1
BRS Cora 0.32 bc 0.19 b 0.12 b 31.95 a 29.99 a 10.10 d 2.69 c 0.9991 a Isabel Precoce 0.19 cd 0.15 b 0.03 b 30.22 ab 29.20 ab 10.53 b 3.09 bc 0.9985 ab BRS Rúbea 0.45 b 0.30 a 0.14 b 29.28 ab 25.86 abc 10.30 c 3.57 ab 0.9977 b Bordô 1.22 a 0.28 a 0.88 a 29.11 ab 17.98 d 10.10 d 4.23 a 0.9980 ab Concord Clone 30 0.24 cd 0.18 b 0.05 b 24.54 bc 23.86 abc 9.80 e 3.48 ab 0.9976 b Niágara Rosada 0.16 d 0.13 b 0.02 b 20.33 c 19.75 cd 10.80 a 4.24 a 0.9958 c
CV 11.42 12.23 30.01 7.62 9.43 0.23 7.77 0.04
2007; Uliana et al., 2015). The wine alcohol content can be seen in Table 2. There was statistical difference among treatments; the wine made from Rosada Niagara had the highest alcohol content and that from the Concord Clone 30 grape showed the lowest value for this variable. However, all samples presented values within the range considered adequate by Brazilian law, which states that for table wines, the beverage alcoholic content should be between 8.6 and 14% by volume (Brazil, 2004). Values close to those in the present study regarding alcohol content were found in studies from Malgarin et al., (2006). Wine density showed significant difference (Table 2), and was higher for the wine from BRS Cora grape and lower for the wine from Niagara Rosada grape. In fully fermented and sugar-free wines the density is usually less than 1.0. In wines containing higher alcohol content, density ranges from 0.9975 to 0.9925. Consequently, wines with a higher sugar content and lower alcohol content will present densities greater than 1.0 (Vogt, 1972). According to Avila (2002), it should be considered that density varies depending on the wine dry extract, sugar and alcohol content. Studies from Uliana et al. (2015), working with wine from the Bordô cultivar, obtained density values that corroborate those of the present study for the same cultivar and density results correspond to those usually found in this type of wine (Rizzon et al., 2000; Rizzon and Miele, 2006; Tecchio et al., 2007). Most antioxidants present in citrus are Vitamin C and polyphenols, especially flavonoids. Vitamin C provides protection against uncontrolled oxidation in the cell aqueous medium due to its high reducing power. Polyphenols are substances with a high capacity to neutralize free radical molecules (Klimckac et al., 2007; Jayaprakasha and Patil, 2007). Antioxidants can be defined as substances that are present in low concentrations and when in contact with an oxidizable substrate, efficiently delay or inhibit the substrate oxidation (Sies and Sthal, 1995; Handelman, 2001). Studies by Antolovich et al. (2002) suggest that more than one antioxidant analysis method should be performed, as each method contributes to the elucidation of an aspect of the complex phenomenon of biological oxidation inhibition. Based on this assumption, among many available methods, the β-carotene/linoleic acid co-oxidation system and DPPH (2,2-diphenyl-1-picrylhydrazyl) free radical sequestration method can be highlighted, both being procedures which employ distinct action mechanisms (Frankel E Meyer, 2000; Aruoma, 2003). Phenolic compounds comprise a group of several substances found in food plants at concentrations that stimulate scientific interest mainly due to their antioxidant potential offered (Scalbert and Williamsom, 2000). Their variation is can occur due to a number of factors which may interfere with the wine phenolic content, for example, the grape cultivar used, degree of ripeness, agricultural practices and procedures adopted during production and storage (MALACRIDA AND MOTA 2005).
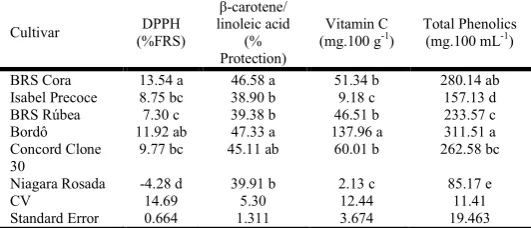
Thus, the antioxidant activity, vitamin C and total phenolic content of different Vitis spp. wines are shown in Table 3.
Significant differences were observed among the wines for the different antioxidant analyses (Table 3). For the DPPH method (% FRS), wines produced with the darker varieties, such as BRS Cora and Bordô, showed the highest values when
[image:5.595.301.567.156.270.2]compared to the others, which presented intermediate FRS%, whereas the wine made with the Niagara Rosada grape presented a negative value.
Table 3. Average values of antioxidant activity by DPPH (% Free Radical Scavenging) and β-carotene/linoleic acid (% Protection)
methods, Vitamin C content (mg/100g) and total phenolics (mg.100 mL-1) of six different Vitis spp. wines
Cultivar DPPH
(%FRS)
β-carotene/ linoleic acid
(% Protection)
Vitamin C (mg.100 g-1)
Total Phenolics (mg.100 mL-1)
BRS Cora 13.54 a 46.58 a 51.34 b 280.14 ab
Isabel Precoce 8.75 bc 38.90 b 9.18 c 157.13 d
BRS Rúbea 7.30 c 39.38 b 46.51 b 233.57 c
Bordô 11.92 ab 47.33 a 137.96 a 311.51 a
Concord Clone 30
9.77 bc 45.11 ab 60.01 b 262.58 bc
Niagara Rosada -4.28 d 39.91 b 2.13 c 85.17 e
CV 14.69 5.30 12.44 11.41
Standard Error 0.664 1.311 3.674 19.463
Means followed by the same letter in the column do not differ by the Scott-Knott test at 5% probability.
According to the β-carotene/linoleic acid method, it can be observed that the wines produced from darker cultivars such as BRS Cora, Bordô and Concord Clone 30 presented a 30% higher protection percentage when compared to the others. Values close to, but above those were described by Vilas Boas (2014), which in his studies of antioxidant activity in juices from Bordô, Isabel Precoce, and BRS Rúbea grapes and blends, observed average protection values of 51.61%. Vilas Boas (2014), also in his antioxidant activity studies in grape juice and blends, noted that most darker cultivars have higher antioxidant activity and Dávalos, Bartolomé and Gómez-Cordovés (2005) reported in their studies that higher antioxidant activity in red grape juices can be attributed to their higher content of total anthocyanins and phenolic compounds. Studies by Vargas, Hoelzel and Rosa (2008), working with red and white grape juices found FRS% ranging from 42% to 114%, with the lowest values related to white grape juice antioxidant activity. According to these authors, while polyphenols are the main determinants of juice antioxidant activity, vitamin C can also contribute to this parameter, but to a lesser extent. The vitamin C content of different wines presented statistical difference and is presented in Table 3. The wine produced with Bordô grapes showed the highest value and that made with Isabel Precoce and Niagara Rosada grapes showed the lowest. The other wines presented intermediate values and were similar.
difference (Table 3). The beverages produced with the Bordô and BRS Cora cultivars showed the highest values, those produced with also red cultivars, such as Concord Clone 30 and BRS Rúbea, showing intermediate values. Beverages elaborated with Isabel Precoce and Niagara Rosada cultivars had the lowest values, respectively, as these drinks have lighter color when compared to the previously cited. Values close to those in the present study were observed in a work by De Oliveira (2011) with fine table wines from different brands, indicating that they are an excellent source of phenolic compounds, with values ranging from 1410.83 to 3718.70 mg.L-1. Differences in the amount of phenolic compounds present in wine depends not only on the type of grape used and the cultivation conditions, but also on several factors related to processing. Presence of seeds and stems in the must, maceration time and temperature, number of rackings made and other technological steps directly interfere in their phenolic content. Due to these factors mentioned, the amount of phenolics can vary considerably in red wine, but in general values between 1000 mg.L-1 and 4000 mg.L-1 are obtained (Mamede and Pastore, 2004). Total phenolic compounds content from several Brazilian red wines ranged from 1041.63 mg.L-1 to 1958.78 mg.L-1 in a study from Granato, Katayama and Castro (2010), whereas Minussi and colleagues (2003) obtained an average of 1920 mg.L-1.
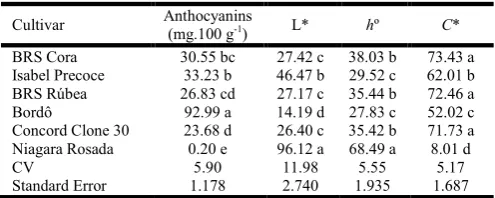
The variability of the phenolic compounds content in the different wines produced can be justified by a number of factors previously mentioned. The wide diversity among grape varieties results in fruit with different characteristics, both in terms of taste and color, which is certainly associated with the polyphenolic content and profile (Abe et al., 2007). According to studies by Abe et al., (2007), the more intense the grape color, the higher the phenolic content and its antioxidant capacity. It is known that anthocyanins are water soluble plant pigments that provide color to a variety of plants and belong to a class of flavonoid compounds, also known as polyphenols. In recent decades, interest in anthocyanins has increased due to their functional potential, collaborating to aid in health promotion (Andersen, 2009). The wine color is considered an important quality indicator, usually the first sensory attribute observed by the consumer. In addition, color tonality and intensity can provide information about the quality of the raw material used in its preparation. Variations in coloration of wines may be related to the grape cultivar used, and can be influenced by the cultivation techniques adopted (Gurak et al., 2010). Mean values for anthocyanins and colorimetric parameters L*, hº (Hue angle) and C* (chroma) in six different Vitis spp. wines can be seen in Table 4.
There was a significant difference in anthocyanins in different wines (Table 4). The highest value was observed for the wine made from the Bordô grape. The beverages made from Concord Clone 30 and Niagara Rosada grapes had the lowest values, respectively. Considering the biochemical aspect of grape metabolism, these results are consistent with the expected, since as different grape varieties undergo maturation, the anthocyanin content becomes different (Pommer, 2003). According to Sampaio (2005), anthocyanin is the constituent most influenced by weather conditions. From the beginning of ripening on, there is an increase in anthocyanin content soon
[image:6.595.309.557.130.229.2]after the color change and that increase is significantly greater in berries exposed to light than in those under shade.
Table 4. Mean values of anthocyanins (mg/100g), and colorimetric parameters L*, Hueº and C* (chroma) in six different Vitis spp.
wines
Cultivar Anthocyanins
(mg.100 g-1) L* hº C*
BRS Cora 30.55 bc 27.42 c 38.03 b 73.43 a Isabel Precoce 33.23 b 46.47 b 29.52 c 62.01 b BRS Rúbea 26.83 cd 27.17 c 35.44 b 72.46 a Bordô 92.99 a 14.19 d 27.83 c 52.02 c Concord Clone 30 23.68 d 26.40 c 35.42 b 71.73 a Niagara Rosada 0.20 e 96.12 a 68.49 a 8.01 d CV 5.90 11.98 5.55 5.17 Standard Error 1.178 2.740 1.935 1.687 Means followed by the same letter in the column do not differ by the Scott-Knott test at 5% probability.
They reach their highest peak and decrease at full maturity and during over-ripeness. Differences among anthocyanin content reflects possible interference of climatic conditions on cultivar adaptation response to climate, rainfall and altitude. Anthocyanin accumulation in the berries is also influenced by the vegetative vigor, a fact that is associated with increased phenolic compound synthesis in the skin, probably as a result of less shade falling on the bunches, which leads to less competition between plant vegetative and reproductive organs for light, being more efficient in anthocyanins synthesis (Mota et al., 2009). Reference values from studies by Pozzan Braga and Salibe (2012) with anthocyanins of the skin of Bordô grapes on different rootstocks and in harvest periods ranged between 55.15 and 307.35 mg.100 g-1, and thus corroborate those of the present study. When referring to instrumental color analysis, the color parameters L*, a*, b*, hº (Hue angle) and C* (chroma) cannot be individually analyzed because they represent a color solid in the color space. Regarding the wine color, the lightness (L*) showed statistical difference among treatments (Table 4). The wine made from Niagara Rosada had the highest value, indicating a wine with lighter color, followed by the wine made from Isabel Precoce, which showed intermediate color. Wines produced with BRS Cora, BRS Rúbea and Concord Clone 30 grapes presented values tending to a more red tonality and were considered similar to each other, while that made from Bordô grapes had the lowest lightness value, which indicates that it is the darkest wine.
this study, C* values presented significant difference among treatments (Table 4). Wines produced from BRS Cora, BRS Rúbea and Concord Clone 30 grapes showed the highest values, and the wine made from Niagara Rosada cultivar had the lowest value, tending toward achromatic. Sensory analysis is the interpretation of stimuli caused to individuals by their interaction with products or foods, that result from various sensations originated from physiological reactions, generating an interpretation of the product intrinsic properties in the individual (Tech, 2013). Sensory analyses are performed from simple and efficient questionnaires to be answered by the tasters.
[image:7.595.36.287.249.395.2]The results of the survey referring to gender, age and wine consumption frequency of the sensory analysis (acceptance test and purchase intent) participants are elucidated in Figure 1.
Figure 1. Profiles of tasters in the sensory analysis of six different wines (Vitis spp.)
Of the 50 tasters who participated in the sensory analysis of different wines, 56% were female and 44% male, 42% were between 18 and 25 years of age and 40% were between 26 and 33 and the others were over 34 (Figure 1). When asked about their wine consumption frequency, 26% said they consumed at least once a month and 24% rarely. A more than biweekly wine consumption frequency was only 2% (Figure 1). Among the sensory tests available to measure consumer acceptance and preference in relation to one or more products, the structured nine point hedonic scale is one of the most used due to its results reliability and validity and its simplicity to be taken by the tasters (Stone & Sidel, 1993; Minim, 2006). Sensory analysis average values for appearance, aroma, taste and overall impression attributes and purchase intention of the six different Vitis spp. wines are in Table 5. According to the statistical analysis, there were differences among treatments for sample acceptance regarding appearance, aroma, taste, overall impression and purchase intention. Regarding the appearance, the wines produced with Bordô, Concord Clone 30 and BRS Rúbea cultivars (Table 5) showed the best results and were slightly and moderately liked by the tasters, when compared to wines made from BRS Cora, Niagara Rosada and Elizabeth Precoce cultivars, which tasters did not like nor dislike. As for the aroma of the beverages, those prepared from Concord Clone 30, Niagara Rosada, Bordô and BRS Rúbea cultivars presented higher values, indicating that the tasters slightly to moderately liked the product when compared to those produced from Isabel Early and BRS Cora cultivars, for
[image:7.595.302.558.390.553.2]which the tasters were neutral in relation to the product acceptance. Regarding the taste, tasters evaluated the produced wines on the scale "did not like nor dislike" for wines elaborated from Bordô, Niagara Rosada, BRS Rúbea and Concord Clone 30 cultivars and on the scale "slightly dislike" for wines elaborated from Isabel Precoce and BRS Cora cultivars. Overall, the average scores for overall impression stood in the hedonic scale between 4.56 and 6.12, listed in the category from "neither liked nor disliked" to "slightly liked", respectively. Therefore, the drinks that showed the highest values were prepared from Bordô, Niagara Rosada, BRS Rúbea and Concord Clone 30 cultivars. Those with the lowest values were elaborated from Isabel Precoce and BRS Cora cultivars. When asked about the purchase intention of the different wines, tasters answered "do not know if I would buy" and "I probably would not buy", standing on a hedonic scale between 2.18 and 3.12, respectively. Besides data analysis by the mean test, in order to analyze the affective data, taking into account the individual response of each consumer and not just the average of the group of consumers who analyzed the products, a technique called Vectorial Internal Preference Mapping was carried out (Marketo et al., 1994). This technique uses multivariate analysis to obtain a graphical representation of the differences in acceptance between the produced wines by identifying the individual and their preferences (REIS, 2006).
Table 5. Mean sensory analysis values for appearance, aroma, taste and overall impression attributes and purchase intention of six different Vitis
spp. Wines
Cultivar Appearance Aroma Taste Overal Impression
Purchase Intention Bordô (V1) 7.22 a 6.90 a 5.76 a 6.12 a 3.12 a BRS Cora
(V2)
5.96 b 5.36 b 3.78 b 4.56 b 2.18 b
Concord Clone 30 (V3)
6.88 a 6.92 a 5.16 a 5.54 a 2.80 a
BRS Rúbea (V4)
6.66 a 6.36 a 5.22 a 5.76 a 2.86 a
Isabel Precoce (V5)
5.26 b 5.88 b 4.38 b 4.84 b 2.28 b
Niágara Rosada (V6)
5.68 b 6.92 a 5.56 a 5.88 a 3.00 a
CV 29.70 27.81 43.55 35.61 43.78 Standard
Error
0.263 0.251 0.306 0.274 0.167
Means followed by the same letter in the column do not differ by the Scott-Knott test at 5% probability.
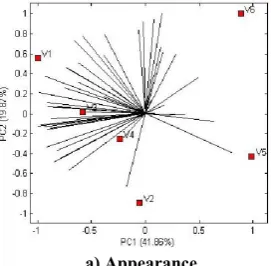
Figure 2 shows the vectorial Internal Preference Maps (IPM) for (a) appearance, (b) aroma, (c) taste and (d) overall impression of six different Vitis spp. wines.
[image:7.595.362.498.621.754.2](b) Aroma
(c) Taste
(d) Overall Impression
Figure 2. Internal Preference Map (IPM) for (a) appearance, (b) aroma, (c) taste and (d) overall impression attributes of six different Vitis spp. wines: Bordô (V1), BRS Cora (V2), Concord Clone 30 (V3), BRS Rúbea (V4), Isabel Precoce (V5) and Niagara Rosada (V6)
Regarding appearance, the map (Figure 2) indicates that wines produced from Bordô, Concord Clone 30 and BRS Rúbea cultivars were preferred by tasters, as a higher concentration of vectors involving these samples indicates preference for them, when compared to wines made from BRS Cora Niagara Rosada and Isabel Precoce cultivars. As for the aroma, wines prepared from Concord Clone 30, Niagara Rosada, Bordô and BRS Rúbea cultivars presented, in the same map, higher vector density, indicating the preference for these samples when compared to wines developed from Isabel Precoce and BRS Cora cultivars. Regarding the taste attribute, tasters preferred the wines produced from Bordô, Niagara Rosada, BRS Rúbea and Concord Clone 30 cultivars over those elaborated from Isabel Precoce and BRS Cora cultivars, since a higher
incidence of vectors near the former group can be seen on the map (Figure 2).
[image:8.595.75.239.61.512.2]In order to assess sample overall acceptance, taking into account the opinion of each tester, the map (Figure 2) reveals that there was a centralization of vectors for wines produced from Bordô, Niagara Rosada, BRS Rúbea and Concord Clone 30 cultivars, when compared to those produced from Isabel Precoce and BRS Cora cultivars.
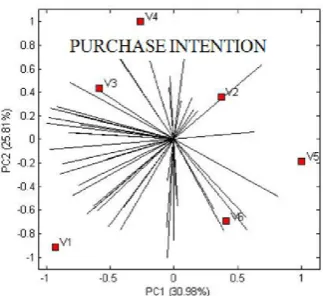
Figure 3. Internal Preference Map (MPI) for the purchase intent of six different Vitis spp. wines: Bordô (V1), BRS Cora (V2), Concord Clone 30 (V3), BRS Rúbea (V4), Isabel Early (V5) and Niagara Rosada (V6)
[image:8.595.352.514.173.321.2]Based on sample spatial separation and vector distribution, it is suggested that wine samples made from Bordô, Concord Clone 30, BRS Rúbea and Niagara Rosada cultivars were more likely to be purchased by consumers compared to the other formulations. This statement is consistent with the average test (Table 5) carried out previously, which can be seen on the map (Figure 3).
Conclusion
overall impression and purchase intent. In this context, production of grapes from different cultivars (Vitis spp.) for wine production in subtropical regions can be undertaken as an alternative for development and establishment of rural populations, as climate conditions positively influence physicochemical composition and sensory aspects of cultivated grapes. This allows, therefore, the development of products derived from grapes, with competitive features which may be accepted by a different public, which has a preference for dry wines.
REFERENCES
Abe, L. T., DA Mota, R. V., Lajolo, F. M., Genovese, M. I. 2007. Compostos fenólicos e a capacidade antioxidante de cultives de uvas Vitis labrusca L. e Vittis vinifera L. Ciência e Tecnologia de Alimento, Campinas, v. 27, n.2, p. 394-400.
Almeida, C. P.; Rocha, J. C.; Caritá, J. S.; Souza, T. M. A.; Souza, P. V. S. 2011. SBRT - Serviço Brasileiro de Respostas Técnicas. DOSSIÊ TÉCNICO. Biotecnologia na produção de alimentos. Universidade de São Paulo - USP. Almeida-Pititto, B. de; Moraes, A. C. F. de; Ferreira, S. R. G.
2013. O lado saudável do consumo de bebida alcoólica. Revista USP, São Paulo, n. 96, p. 55-68.
Andersen, O. M. 2009. Recent advances in the field of anthocyanins — Main focus on structures. In F. Daayf, & V. Lattanzio (Eds.), Recent Advances in Polyphenol Research, 1, Oxford, UK: Wiley-Blackwell.
Antolovich, M. et al. 2002. Methods for testing antioxidant activity, Analyst, v. 127, p. 183-198.
AOAC. (Association of Official Analytical Chemists). (1990). Official methods of analysis. 15.ed. Washington.
Aruoma, O.I. 2003. Methodological characterizations for characterizing potential antioxidant actions of bioactive components in plant foods, Mutation Research, v. 9, p. 523-524.
Association of Official Analytical Chemists 2007. Official Methods of the Association of the Agricultural Chemists, eighteen ed. Association of Official Analytical Chemists, Gaithersburg.
Ávila, L. D. 2002. Metodologias Analíticas Físico-Químicas – Laboratório de Enologia. Apostila de Graduação do Curso Superior de Tecnologia em Viticultura e Enologia, Bento Gonçalves.
Berselli, E. 1998. Caracterização Analítica e Sensorial do Vinho Niágara. Bento Gonçalves.
Brand-Williams, W., Cuvelier, M.E.; Berset, C. 1995. Use of a free radical method to evaluate antioxidant activity. Food Science and Technology, v. 28, p. 25–30.
Brasil, Ministério da Agricultura, Lei n° 10970, de 12 de novembro de 2004. Normas referentes à complementação dos padrões de identidade e qualidade do vinho e dos derivados da uva e do vinho.
Brasil, Ministério da Agricultura, Portaria nº 229, de 25 de outubro de 1998, Normas referentes à complementação dos padrões de identidade e qualidade do vinho e dos derivados da uva e do vinho, Diário Oficial da União, de 31 de outubro de 1988, seção 1, página 20948.
Calvão, J. C. L. de B. 2013. Efeito da poda e de produtos enológicos na evolução da cor do vinho tinto. Dissertação
de Mestrado em Bioquímica - Universidade de Aveiro, Departamento de Química. 114f.
Campbell, M. K. 2003. Bioquímica. 3. ed. Porto Alegre: Artmed, 752 p.
Cerqueira, F.M; Gennari, M.H De M; Ohara, A. 2007. Antioxidantes dietéticos: controvérsias e perspectivas. Instituto de Química, Universidade de São Paulo, Química. Nova, Vol. 30, No. 2, 441- 449, São Paulo.
Chavarria, G.; Santos, h. P.; Zanus, M. C.; Zorzan, C.; Marodin, G. A. B. 2008. Caracterização físico-química do mosto e do vinho Moscato Giallo em videiras cultivadas sob cobertura de plástico. Pes. agropec. bras., Brasília, v.43, p.911-916, jul.
Chiva-Blanch, G. et al. 2013. Effects of red wine polyphenols and alcohol on glucose metabolism and the lipid profile: a randomized clinical trial. Clinical Nutrition, v. 32, n. 2, p. 200-206.
CIE - Comission Internacionale D’le Ecleraige 1986. Colorimetry. 2nd ed. Vienna: CIE Central Bureau.
CIE - Comission Internationale De I' Eclairage 1978. Recommendations on uniform color spaces-color difference equations, psychomettic color terms. Paris: CIE. Dávalos, A.; bartolomé, B. E gómez-cordovés, C. 2005.
Antioxidant properties of commercial grape juices and vinegears. Food Chemistry, Kidlington, v. 93, n. 2, p. 325-330.
De Moraes, V. and Locatelli, C. 2012. Vinho: uma revisão sobre a composição química e benefícios à saúde. Evidência – Ciência e Biotecnologia Interdisciplinar, Joaçaba- SC, v. 10, n. 1-2, p. 57-68.
De Oliveira, L.C.; De Souza, S.O.; Mamede, M.E.O. 2011. Avaliação das características físico-químicas e colorimétricas de vinhos finos de duas principais regiões vinícolas do Brasil. Rev Inst Adolfo Lutz. São Paulo;70(2): 158-67.
Detoni, A.M.; Clemente, E.; Braga, G.C. & Herzog, N.F.M. 2005. Uva ‘niágara rosada’ cultivada no sistema orgânico e armazenada em diferentes temperaturas. Ciência e Tecnologia de Alimentos, 25:546-552.
Flanzy, C. Enologia: Fundamentos Científicos y tecnológicos. Madrid: Mundi Prensa, 2000. 783 pág.
Frankel, E. N.; Meyer, A. S. 2000. The problems of using one-dimensional methods to evaluate multifunctional food and biology antioxidants. Journal of Science of Food and Agriculture, v. 80, p. 1925-1941.
Garcia, A. S. C. 1988. Controlo de Qualidade dos Vinhos – Química Enológica – Métodos analíticos. Instituto da Vinha e do Vinho, Lisboa, 420 pág.
Girard, B.; Mazza, G. 1998. Produtos funcionales derivados de lãs uvas y de los cítricos. In: MAZZA, G.; ACRIBIA, S. A. Alimentos funcionales: aspectos bioquímicos e de processado. Zaragoza: Acribia, Cap. 5 , p. 141-182. Giusti, M. M.; Wrolstad, R. E. 2001. Anthocyanins:
characterization and measurement with uv-visible spectroscopy. In: WROLSTAD, R.E. Current protocols in food analytical chemistry, cap. 1, p. 1-13.
Gurak, P. D. et al. 2010. Quality evaluation of grape juice concentrated by reverse osmosis. Journal of Food Engineering, v. 96, p. 421-426.
Handelman, G. J. 2001. The evolving role of carotenoids in human biochemistry. Nutrition, v. 17, p. 818-822.
Hashizume, T. 1983. Fundamentos da tecnologia do vinho, In: Aquarone, E.; LIMA, U, de A.; Borzani, V, Alimentos e bebidas produzidos por fermentação, São Paulo: Edgard Blücher, cap, 2, p, 14-43.
Hashizume, T. 2001. Tecnologia do vinho. In: Aquarone, E.; Borzani, W.; Schmidell, W.; Lima, U. A. (Coords.) Biotecnologia Industrial: Biotecnologia na Produção de Alimentos. São Paulo: Edgard Blucher. cap. 2, p. 21-68. Ianssen, C. et al. 2002. Análise do conteúdo de
transresveratrol, fenóis totais e antocianinas em vinhos tintos e sucos de uva produzidos em Santa Catarina e no Rio Grande do Sul. In: XVII CONGRESSO BRASILEIRO DE FRUTICULTURA. Belém, 2002. Anais. Belém: SBF Cd Rom.
Instituto Adolfo Lutz. 1985. Normas analíticas do Instituto Adolfo Lutz, v,1: Métodos Físicos e Químicos para Análise de Alimentos, 3ed, São Paulo: IMESP, p,361.
Jackson, R. S. 2000. Wine science: principles, practice, perception, 2 ed, San Diego: Academic Press, 648p. Jayaprakasha, G. K.; Patil, B. S. 2007. In vitro evaluation of
the antioxidant activities in fruit extracts from citron and blood orange. Food Chemistry, v. 101, n. 1, p. 410-418. Jelihovschi, E.; Faria, J. C.; Allaman, I. B. 2014.“Scottknott: A
package for performing the scott-knott clustering algorithm in r,”Trends in Applied and Computational Mathematics, vol. 15, no. 1, pp. 003–017.
Karling, M. Determinação da composição fenólica e atividade antioxidante de vinhos produzidos no sudoeste do Paraná. 2013. 42 f. Trabalho de Conclusão de Curso (Graduação) - Universidade Tecnológica Federal do Paraná, Pato Branco, 2013.
Klimczak, I. et al. 2007. Effect of storage on the content of polyphenols, vitamin C and the antioxidant activity of orange juices. Journal of Food Composition and Analysis, v. 20, n. 3-4, p. 313-322. Leme Jr., J.; Malavolta, E. Determinação fotométrica de ácido
Lara, R.; Cerutti, S.; Salonia, J.A.; Olsina, R.A.; Martinez, L.D. 2005. Trace element determination of Argentine wines using ETAAS e USN-ICP_OES. Food and Chemical Toxicology, v. 43, p. 293-297.
Larrauri, J.A.; Rupérez, P.; Saura-Calixto, F. 1997. Effect of drying temperature on the stabilitity of polyphenols and antioxidant activity of red grape pomace peels. Journal of Agricultural and Food Chemistry, v. 45, p. 1390-1393. Lee, J.; Kennedy, J.A.; Devlin, C.; Redhead, M.; Rennaker, C.
2008. Effect of early seed removal during fermentation on proanthocyanidin extraction in red wine: A commercial production example. Food Chemistry 107: 1270–1273. Maarse, H.; Slump, A. C.; Tas, A. C. Chaefer, J. 1987.
Classification os wines according to type and region based on their composition. Zeitschrift für Lebensmittel Untersuchung und-Forschung A, v. 184, p.198-203. Malacrida, C. R.; Motta, S. 2005. Compostos fenólicos totais e
antocianinas em suco de uva. Ciência e Tecnologia de Alimentos, v. 25, p. 659-664.
Malgarim, M. B.; Tibola, C. S., Ferri, V. C.; Zaicovski, C. B.; Vitor Manfroi, V. 2006. Características de qualidade do vinho ‘Bordô’ elaborado com diferentes processos de vinificação e períodos de maceração. Maringá, v. 28, n. 2, p. 199-204, July/Dec.
Mamede, M.E.O.; Pastore, G.M. 2004. Compostos fenólicos do vinho: estrutura e ação antioxidante. Bol CEPPA, 22(2):233-52.
Marketo, C. G.; Cooper, T.; Petty, M. F.; Scriven, F. M. 1994. The reliability of mdpref to show individual preference. Journal of Sensory Studies, Westport, v.9, n.3, p.337-359, Sept.
Mazza, G.; Fukumoto, L.; Delaquis, P.; Girard, B.; Ewert, B. 1999. Anthocyanins, phenolics, and color of Cabernet Franc, Merlot, and Pinot Noir wines from British Columbia. Journal of agricultural and food chemistry, 47(10):4009–17.
Mazzochi, C. L.; Ide, G. M. 1994. Características de alguns vinhos produzidos em Santa Catarina, Agropecuária Catarinense, Florianópolis, v,7, n,3, p,17-19.
Mcguire, R. G. 1992. Reporting of objective color measurements. HortScience, v. 27, p. 1254-1555.
Meilgaard, M.; Civille, G. V.; Carr, B. T. 1999. Sensory evaluation techniques. 3rd ed. Boca Raton: CRC, 390 p. Mendes, L. G. Microencapsulação do corante natural de
urucum: uma análise da eficiência da goma do cajueiro com material de parede, 2012. Dissertação (mestrado) – Universidade Federal do Ceará, Centro de Ciências Agrárias, Departamento de Tecnologia de Alimentos, Programa de Pós-Graduação em Ciência e Tecnologia de Alimentos. Fortaleza, 2012.
Miller, H. E. A. 1971. Simplified method for the evaluation of antioxidant. Journal of the American Oil Chemists’ Society, Heidelberg, v. 48, n. 2, p. 91-97.
Minim, V. P. R. 2006. Análise sensorial: estudos com consumidores. Viçosa, MG: UFV, 225 p.
Minussi, R.C.; Rossi, M.; Bologna, L.; Cordi, L.; Rotilio, D.; Pastore, G.M.; Duran, N. 2003. Phenolic compounds and total antioxidant potential of commercial wines. Food Chem.82:409-16.
Mota, R.V.; Souza, C.R.; Favero, A.C.; Silva, C.P.C.; Carmo, E.L.; Fonseca, A.R. & Regina, M.A. 2009. Produtividade e composição físicoquímica de bagas de cultivares de uva em distintos porta-enxertos. Pesquisa Agropecuária Brasileira, 44:576-582.
Natividade, M. M. P. Potencial de sucos integrais de uvas produzidas no Vale do São Francisco, Brasil: caracterização físico-química, atividade antioxidante e avaliação sensorial. 2014. 163 p. Tese (Doutorado em Ciência dos Alimentos) - Universidade Federal de Lavras, Lavras, 2014
Nelson, N. A 1944. Photometric adaptation of Somogy method for determination of glucose. Journal of Biological Chemists, Baltimore, v. 15, n. 1, p. 375-380.
Noordellos, S.; Nagel, C.W. 1972. Effect of sugar on acid perception in wine, American Journal of Enology and Viticulture, Davis, v, 23, p,139-143.
Cadernos de Prospecção - ISSN 1983-1358 (print) 2317-0026 (online). vol.5, n.4, p.221-228.
Orduña, R.M. 2010. Climate change associated effects on grape and wine quality and production. Food Research International, Kidlington, v. 43, n. 7, p. 1844-1855.
Organização Pan-Americana Da Saúde. 2003. Doenças crônicodegenerativas e obesidade: estratégia mundial sobre alimentação saudável, atividade física e saúde. Brasília (DF): OPAS; 60 p.
Ough, C. S.; Amerine, M. A. 1988. Methods for analysis of musts and wines, 2° ed, Davis: John Wiley & Sons, 377 p. Pato, O. 1998. O vinho: sua preparação e conservação. 10 ed.
Lisboa: Clássica, 432 p.
Pinheiro A. C. M.; Nunes, C. A.; Vietoris, V. 2013. SensoMaker: a tool for sensorial characterization of food products. Ciência e Agrotecnologia, Lavras, v. 37, n. 3, p. 199-201.
Pizzato, I. 2000. Caracterização Analítica e Sensorial de Vinhos elaborados no Vale do São Francisco, Bento Gonçalves.
Pommer, C.V. 2003. Uva: Tecnologia de produção, pós-colheita, mercado. Porto Alegre, Cinco Continentes. 778p. Pozzan, M. S. V; Braga, G. C.; Salibe, A. B. 2012. Teores de
antocianinas, fenóis totais, taninos e ácido ascórbico em uva ‘bordô’ sobre diferentes porta-enxertos. Rev. Ceres, Viçosa, v. 59, n.5, p. 701-708, set/out.
R Development Core Team. R: a language and environment for statistical computing. Vienna: R foundation for statistical computing, 2011. Available at http://www.R-project.org.
Recamales, A. F. et al. 2006. The effect of time and storage conditions on the Phenolic composition and colour of white wine. Food Research International, Kidlington, v. 39, n. 2, p. 220-229.
Reis, R. C.; Regazzi, A. J.; Carneiro, J. C. S.; Minim, V. P. R. 2006. Mapa de preferência. In: MINIM, V. P. R. Análise sensorial: estudos com consumidores. Viçosa, MG: UFV, 225 p.
Ribéreau-Gayon, P.; Glories, Y.; Maujean, A.; Dubourdieu, D.; Donèche, B. 2006. Handbook of enology. 2ª ed., v.2, França: John Wiley e Sons, ltd, 441 p.
Rizzon, A.L; Meneguzzo, J.; Manfroi, L. 2003. Planejamento de uma cantina rural para a elaboração do vinho tinto. 1.ed. Bento Gonlçalves: EMBRAPA-CNPUV, 67p.
Rizzon, L. A. 1996. Extrato Seco Total de Vinos Brasileiros: Comparação de Métodos Analíticos, Ciência Rural, v,26, n,2, Rio de Janeiro.
Rizzon, L. A.; Miele, A. 1996. Extrato seco total de vinhos brasileiros: comparação de métodos analíticos. Ciência Rural, Santa Maria, v. 26, n. 2, p. 297-300.
Rizzon, L. A.; Miele, A. 2006. Efeito da safra vitícola na composição da uva, do mosto e do vinho Isabel da Serra Gaúcha, Brasil. Ciência Rural, Santa Maria, v. 36, n. 3, p. 959-964.
Rizzon, L. A.; Miele, A.; Meneguzzo, J. 2000. Avaliação da uva cv. Isabel para a elaboração de vinho tinto. Ciência e Tecnologia de Alimentos, Campinas, v. 20, n. 1, p. 115-121.
Rizzon, L. A.; Salvador, M. B. G. 1987a. Composição Química dos Vinhos da Microregião Homogênea Vinicultora de Caxias do Sul (MRH 311) – Compostos
Voláteis. Embrapa Uva e Vinho: Bento Gonçalves (Comunicado Técnico, 5).
Rizzon, L. A.; Salvador, M. B. G. 1987b. Teores de Cátions dos Vinhos da Microregião Homogênea Vinicultora de Caxias do Sul (MRH 311). Embrapa Uva e Vinho: Bento Gonçalves (Comunicado Técnico, 4).
Rombaldi, C.V. et al. 2004. Produtividade e qualidade de uva, cv. Isabel, em dois sistemas de produção. Rev. Bras. Frutic., Jaboticabal, v. 26, n. 1, p. 89-91.
Rufino, M. S. M. et al. 2007a. Metodologia científica: determinação da atividade antioxidante total em frutas pela captura do radical livre DPPH. Fortaleza: EMBRAPA, 4p. (Comunicado técnico, 127).
Rufino, M. S. M. et al. 2007b. Metodologia científica: determinação da atividade antioxidante total em frutas no sistema β caroteno – ácido linoléico. Fortaleza: Embrapa, 4p. (Comunicado técnico, 126).
Santana, M.T.A.; Siqueira, H.H;, Lacerda, R.J. & Lima, L.C.O. 2008. Caracterização físico-química e enzimática de uva ‘patrícia’ cultivada na região de Primavera do Leste - MT. Ciência e Agrotecnologia, 32:186-190.
Scalbert, A.; Williamson, G. 2000. Dietary intake and bioavailability of polyphenols. Journal of Nutririon, v. 130, p. 2073-2085.
Scott, A. and Knott, M. 1974. Cluster-Analysis Method for Grouping Means in Analysis of Variance. Biometrics, 30, 507-512. http://dx.doi.org/10.2307/2529204.
Sies, H.; Sthal, W. 1995. Vitamins E and C, β-carotene and other carotenoids as antioxidants. The American Journal of Clinical Nutrition, v. 62, p. 13151321.
Silva, P.S.; Menezes, J.B.; Oliveira, O.F..; Silva, P.I.B. 2003a. Distribuição do teor de sólidos solúveis totais no melão. Horticultura Brasileira, Brasília, v. 21, n. 1, p. 31-33. Silva, R. N.; Monteiro, V. N.; Alcanfor, J. D X.; Assis, E. M.;
Asquieri, E. R. 2003b. Comparação de métodos para a determinação de açúcares redutores e totais em mel. Ciênc. Tecnol. Aliment, Campinas, 23(3):337-341.
Singleton, V. L.; Rossi, J. A. 1965. Colorimetry of total phenolics with phosphomolybdic-phosphotungstic acid reagents. American Journal of Enology and Viticulture, v. 16, p. 144–158.
Soares Filho, P. R.; Castro, I.; Stahlschmidt, A. Efeito do vinho tinto associado ao exercício físico no sistema cardiovascular de ratos espontaneamente hipertensos. Arquivos Brasileiros de Cardiologia, v. 96, n. 4, p. 277-283, 2011.
Son, H-S.; Hwang, G-S.; Ahn, H-J.; Park, W-M.; Lee, C-H.; Hong, Y-S. Characterization of wines from grape varieties through multivariate statistical analysis of 1H NMR spectroscopic data. Food Research International 42: 1483– 1491, 2009.
Stone, H.; Sidel, J.L.. Sensory Evaluation Practices, 2 ed. Academic Press, San Diego, 1993.
Stroeckher, R.; Henning, H. M. Analisis de vitaminas: metodos comprobados. Madrid: Paz Montalvo, 428p., 1967.
Sun, J. et al. Antioxidant and antiproliferative activities of common fruits. Journal of Agriculture and Food Chemistry, v. 50, p. 7449-7454, 2002.
Superior de Tecnologia em Viticultura e Enologia. Bento Gonçalves – RS. Ago/2007.
Tecchio, F. M.; Miele, A.; Rizzon, L. A. Composição físico-química do vinho Bordô de Flores da Cunha, RS, elaborados com uvas maturadas em condições de baixa precipitação. Ciência Rural, Santa Maria, v. 37, n. 5, p. 1480-1483, 2007.
Tedesco, M.J.; Gianello, C.; Bissani, C.A.; Bohnen, H. & Volkweiss, S.J. Análise de solo, plantas e outros materiais. 2.ed. Porto Alegre, Universidade Federal do Rio Grande do Sul, 1995. 147p. (Boletim Técnico, 5).
Terra NL, EL-Kik RM, Watte M, Vieira JMS, Marchi DSM, David CN, Souza CG, Teixeira AS. Alimentação saudável: é possivel ter uma alimentação equilibrada. In: Terra NL, El-Kik RM, Watte M, Vieira JMS, Marchi DSM, David CN, Souza CG, Teixeira AS, editores. A nutrição e as doenças geriátricas. Porto Alegre: EDIPUCRS; 2011. p. 11-20.
Uliana, M. R.; Filho, W. G. V.; Oliveira, J. M.; Teixeira, J. A. Vinhos de mesa varietais de uvas americanas: análises químicas e energética. Energ. Agric., Botucatu, vol. 30, n.1, p.98-103, janeiro-março, 2015.
União Brasileira DE Vitivinicultura. Produção de Uvas, Elaboração de Vinhos e Derivados 1998-2004. Disponível em: <http://www.uvibra.com.br>. Acesso em: 02 maio 2007.
Vargas, P. N; Hoelzel, S. C.; Rosa, C. S. Determinação do teor de polifenóis totais e atividade antioxidante em sucos de uva comerciais. Alimentos e Nutrição, v. 18, p. 11-15, 2008.
Vilas Boas, A. C. Caracterização físico-química, sensorial e atividade antioxidante de sucos de uva e blends produzidos no Sudoeste de Minas Gerais / Ana Carolina Vilas Boas. – Lavras : UFLA, 2014. Dissertação (mestrado) – Universidade Federal de Lavras, 2014. 114 p. : il.
Vogt, E. Fabricación de Vinos. Zaragoza: Acribia, 1972. Vogt, E.; Jakob, L.; Lemperle, E.; Weiss, E. El vino –
obtencíon, elaboracíon y análises, Tradução por Jaime Esain Escobar, Zaragoza: Acribia, 1984, 294 p, Tradução de Der Wein: Bereitung, Behandlung, Untersuchung. Wakeling, I. N.; Mac Fie, H. J. H. Designing consumer trials
balanced for first and higher orders of carry-over effect when only a subset ok k samples from t may be tested. Food Quality and Preference, Barking, v. 6, p. 299– 308, 1995.