SALIVARY ELECTROLYTES AND TOTAL PROTEINS IN DIABETIC PATIENTS WITH AND WITHOUT
CHRONIC PERIODONTITIS AND HEALTHY ADULTS: A
1
Dr. Savita, A. M.,
2,*Dr.Shinde Sachin Vaijnath Rao,
4Dr. Pai Sujatha Ballambettu,
1
Professor and Head, Department of Periodontics, Dayananda Sagar
Kumaraswamy Layout, Bangalore 560078
2,5,6
Post Graduate Student Department of Periodontics, Dayananda Sagar College of Dental Sciences,
Kumaraswamy Layout, Bangalore 560078
3Associate Professor, Department of Periodontics,
Kumaraswamy Layout, Bangalore 560078
4
Senior Lecturer, Department of Periodontics, Dayananda Sagar College of Dental Sciences,
Kumaraswamy Layout, Bangalore 560078
ARTICLE INFO ABSTRACT
Aims and objectives:
protein in diabetic patients with and without periodontitis and in healthy adults, to correlate clinical parameters with electrolytes in all the groups. Furthermore, the cor
groups was carried out.
Materials and Methods:
groups,
Diabetic patients with chronic periodontitis. Clinical parameters (plaque index, bleeding index, probing pocket depth and clinical attachment loss) were record
all the subjects to perform biochemical analysis of salivary total proteins and electrolytes. Continuous variable with a normal distribution were expressed as means with Standard deviation. The intergroup difference was tested using one way ANOVA test. The categorical variables were expressed as numbers with percentage. The strength and direction of a linear relationship between two variables were measured using Pearson's Correlation Coefficient.
package. A value of P
Results:
correlation of electrolytes bet
Conclusion:
can add to the data already recorded in Indian population.
Copyright©2016, Dr. Savita et al. This is an open access article distributed under the Creative Commons Att distribution, and reproduction in any medium, provided the original work is properly cited.
INTRODUCTION
Periodontal disease is a chronic inflammatory disease of the oral cavity comprising a group of inflammatory conditions affecting the supporting structures of the dentition
2012). Certain systemic conditions can also cause inflammatory changes in periodontal tissues.
*Corresponding author: Dr.Shinde Sachin Vaijnath Rao,
Post Graduate Student Department of Periodontics, Dayananda Sagar College of Dental Sciences, Kumaraswamy Layout, Bangalore 560078.
ISSN: 0975-833X
Article History:
Received 27th March, 2016 Received in revised form 17th April, 2016 Accepted 08th May, 2016 Published online 15th June,2016
Key words:
Salivary electrolytes, Diabetic patients, Chronic periodontitis.
Citation: Dr. Savita, A.M., Dr.Shinde Sachin Vaijnath Rao,
Dr. Krishnan Swathi, 2016. “Salivary electrolytes and total proteins in diabetic patients with and without chronic periodontitis and
comparative study”, International Journal of Current Research
RESEARCH ARTICLE
SALIVARY ELECTROLYTES AND TOTAL PROTEINS IN DIABETIC PATIENTS WITH AND WITHOUT
CHRONIC PERIODONTITIS AND HEALTHY ADULTS: A COMPARATIVE STUDY
Dr.Shinde Sachin Vaijnath Rao,
3Dr. Sathyanarayan
Dr. Pai Sujatha Ballambettu,
5Dr. Neelakanti Abhilash and
6Dr. Krishnan Swathi
Professor and Head, Department of Periodontics, Dayananda Sagar College of Dental Sciences,
Kumaraswamy Layout, Bangalore 560078
Department of Periodontics, Dayananda Sagar College of Dental Sciences,
Kumaraswamy Layout, Bangalore 560078
Department of Periodontics, Dayananda Sagar College of Dental Sciences,
Kumaraswamy Layout, Bangalore 560078
Department of Periodontics, Dayananda Sagar College of Dental Sciences,
Kumaraswamy Layout, Bangalore 560078
ABSTRACT
Aims and objectives: This study was conducted to evaluate and compare salivary electrolytes and total protein in diabetic patients with and without periodontitis and in healthy adults, to correlate clinical parameters with electrolytes in all the groups. Furthermore, the cor
groups was carried out.
Materials and Methods: 45 subjects of age group 25-60 years were selected and divided into 3 groups, Group 1: Healthy individuals, Group 2: Diabetic patients without chronic periodontitis, Group 3: Diabetic patients with chronic periodontitis. Clinical parameters (plaque index, bleeding index, probing pocket depth and clinical attachment loss) were recorded and non stimulated whole saliva was taken from all the subjects to perform biochemical analysis of salivary total proteins and electrolytes. Continuous variable with a normal distribution were expressed as means with Standard deviation. The intergroup ifference was tested using one way ANOVA test. The categorical variables were expressed as numbers with percentage. The strength and direction of a linear relationship between two variables were measured using Pearson's Correlation Coefficient. All statistical analysis was performed by using SPSS (10.5) package. A value of P <0.05 was considered as statistically significant.
Results: A statistically significant effect was demonstrated for plaque index and gingival index. The correlation of electrolytes between the groups was found but did not show statistical significance.
Conclusion: Though the estimated values of salivary electrolytes are not significant in the present study, it can add to the data already recorded in Indian population.
is an open access article distributed under the Creative Commons Attribution License, which distribution, and reproduction in any medium, provided the original work is properly cited.
Periodontal disease is a chronic inflammatory disease of the group of inflammatory conditions affecting the supporting structures of the dentition (Kolte et al., Certain systemic conditions can also cause inflammatory changes in periodontal tissues.
Department of Periodontics, Dayananda Sagar College of Dental Sciences, Kumaraswamy Layout, Bangalore 560078.
Among these systemic diseases, diabetes mellitus is an established risk factor for periodontitis and most studies have reported that prevalence and severity of periodontitis are significantly higher in diabetics than non
Fasanmade, 2012). Saliva is regarded as a promising medium for detection of markers of periodontal disease activity. The collection protocols are straight
be performed easily. Thus the role of saliva in oral health has been a subject of continued research, as it contains a large number of proteins, peptides and electrolytes, which may serve as a potential source of biomarkers.
International Journal of Current Research
Vol. 8, Issue, 06, pp.32602-32608, June, 2016
INTERNATIONAL
Dr.Shinde Sachin Vaijnath Rao, Dr. Sathyanarayan Sunil, Dr. Pai Sujatha Ballambettu,
Salivary electrolytes and total proteins in diabetic patients with and without chronic periodontitis and International Journal of Current Research, 8, (06), 32602-32608.
SALIVARY ELECTROLYTES AND TOTAL PROTEINS IN DIABETIC PATIENTS WITH AND WITHOUT
COMPARATIVE STUDY
Dr. Sathyanarayana Sunil,
Dr. Krishnan Swathi
College of Dental Sciences,
Department of Periodontics, Dayananda Sagar College of Dental Sciences,
Dayananda Sagar College of Dental Sciences,
Department of Periodontics, Dayananda Sagar College of Dental Sciences,
This study was conducted to evaluate and compare salivary electrolytes and total protein in diabetic patients with and without periodontitis and in healthy adults, to correlate clinical parameters with electrolytes in all the groups. Furthermore, the correlation between electrolytes of all
60 years were selected and divided into 3 Group 1: Healthy individuals, Group 2: Diabetic patients without chronic periodontitis, Group 3: Diabetic patients with chronic periodontitis. Clinical parameters (plaque index, bleeding index, probing ed and non stimulated whole saliva was taken from all the subjects to perform biochemical analysis of salivary total proteins and electrolytes. Continuous variable with a normal distribution were expressed as means with Standard deviation. The intergroup ifference was tested using one way ANOVA test. The categorical variables were expressed as numbers with percentage. The strength and direction of a linear relationship between two variables were measured tical analysis was performed by using SPSS (10.5) <0.05 was considered as statistically significant.
A statistically significant effect was demonstrated for plaque index and gingival index. The ween the groups was found but did not show statistical significance.
Though the estimated values of salivary electrolytes are not significant in the present study, it
ribution License, which permits unrestricted use,
Among these systemic diseases, diabetes mellitus is an established risk factor for periodontitis and most studies have ported that prevalence and severity of periodontitis are significantly higher in diabetics than non-diabetics (Lasisi and . Saliva is regarded as a promising medium for detection of markers of periodontal disease activity. The rotocols are straight-forward, non invasive and can be performed easily. Thus the role of saliva in oral health has been a subject of continued research, as it contains a large number of proteins, peptides and electrolytes, which may serve
ource of biomarkers.
INTERNATIONAL JOURNAL OF CURRENT RESEARCH
Pai Sujatha Ballambettu, Dr. Neelakanti Abhilash and
Various studies have aimed to analyze the salivary levels of calcium (Ca+2), magnesium (Mg+2), potassium (K+), sodium (Na+) in CP but have shown conflicting results. Furthermore, there is very scarce literature available regarding the relationship between diabetes and salivary biochemical parameters and the effect of these changes on oral health. In addition, despite the fact that periodontitis is highly prevalent among diabetics, most studies do not relate the salivary composition in diabetic patients to periodontitis (Lasisi and Fasanmade, 2012). Therefore, this short-term clinical study of quantitative estimation of salivary electrolytes and total protein concentrations in saliva of healthy and periodontitis patients with and without diabetes was carried out. This will help to find the reliability of these electrolytes as diagnostic marker in periodontitis and to analyze the relation of these ions to one another, which could help in prevention and treatment of periodontal disease and to indicate disease activity in periodontitis.
Aims and Objectives
To evaluate and compare the salivary electrolytes and total protein in diabetic patients with and without periodontitis and in healthy adults.
To correlate clinical parameters with electrolytes in all the groups.
Correlation between electrolytes of all groups.
MATERIALS AND METHODS
Eligible subjects of either sex aged 25-60 years visiting Department of Periodontics Dayananda Sagar College of Dental Sciences, Bangalore were considered for inclusion in the study. This study was divided into three different groups, each group consisting of 15 subjects: healthy individuals (Group-1), diabetic patients with CP (Group-2), diabetic patients without periodontitis (Group-3).
Inclusion criteria
Subjects in the age group of 25-60 years, who have a history of controlled Type-2 Diabetes mellitus (DM) (but not other systemic diseases, which could influence periodontal conditions), were selected for the study.
Exclusion criteria
Patients who have undergone periodontal therapy in the past three months, antibiotic therapy in the past six months were excluded from the study. Smokers and pregnant and/or lactating women were also excluded.
Method of data collection
All subjects were asked to sign a written informed consent form prior to commencement of the study.
Clinical Examination
Following clinical parameters were recorded, Plaque index (PI), (Silness et al., 1964) Gingival index (GI) (Loe, 1967),
probing pocket depth (PPD) and clinical attachment loss(CAL) were recorded and non stimulated whole saliva was taken from all the subjects and biochemical analysis of salivary total proteins and electrolytes was done.
Sample collection
All participants were instructed not to eat or drink (except water) at least one hour prior to collection of saliva. They were asked to sit in a relaxed position and rinse his/her mouth several times with sterilized water. 30 minutes later, five millilitres (ml) of whole unstimulated saliva was collected into a sterile container.
Electrolytes detection
The collected saliva samples were centrifuged at 3000 revolutions per minute (rpm) for 30 minutes to obtain a clear supernatant fluid. The clear supernatant was analyzed using auto-analyzer for electrolytes and total protein detection for all the groups.
Statistical analysis
Continuous variable with a normal distribution were expressed as means with Standard deviation. The intergroup difference was tested using one way ANOVA test. The categorical variables were expressed as numbers with percentage. The strength and direction of a linear relationship between two variables were measured using Pearson's Correlation Coefficient. All statistical analysis was performed by using SPSS (version: 10.5) package. A value of p <0.05 was considered as statistically significant.
RESULTS
The mean ±SD of plaque index in Healthy, Diabetic with CP group and Diabetic without CP group were 0.30± 0.196, 0.79± 0.263 and 0.43± 0.291 respectively. The comparison of mean PI between the groups shows statistically significant difference (p<0.05) between the groups. Further analysis revealed that there is significant difference between Healthy and Diabetic with CP groups (p=<0.001). There is no statistically significant difference between Healthy and Diabetic without CP groups (p=0.583). There is statistically significant difference between Diabetic with CP and diabetic without CP groups (p=0.001).
The mean ±SD of Gingival index in Healthy, Diabetic with CP group and Diabetic without CP group were 0.1713 ± 0.1214, 0.68 ± 0.2007 and 0.4060 ± 0.2548 respectively. The comparison of mean Gingival Index between the groups shows statistically significant difference (p<0.05) between the groups. Further analysis revealed that there is statistically significant difference between Healthy and Diabetic with CP, diabetic without CP group (p=<0.001 and p=0.008 respectively). There is also statistically significant
Correlation between PI versus Electrolytes
There is a weak negative correlation observed between PI
versus Sodium, potassium and magnesium (r=-0.019, r=-0.362,r=-0.014 respectively). There is weak positive
correlation was observed between PI and Total Protein, Albumin, Calcium, Phosphorus and Chloride (r=0.202,r=0.016,r=0.136,r=0.011 and r=0.07 respectively).
Correlation between GI versus Electrolytes
[image:3.595.85.499.70.111.2]This study showed positive Correlation between Gingival Index and Electrolytes but there is no statistically significant and weak correlation expects sodium and potassium. There is a weak negative correlation observed between PI versus Sodium and potassium (r=-0.162, r=-0.249 respectively).
Table 1. Comparison of Mean Plaque Index between the Study Groups
Group N Mean SD Median Min. Max. ‘F’ value ‘p’ value
Healthy 15 0.30 0.196 0.20 0.00 0.70 15.120 <0.001*
Diabetic with CP 15 0.79 0.263 0.80 0.30 1.20
Diabetic without CP 15 0.43 0.291 0.40 0.10 0.80 *statistically significant
Table 2. Comparison of Mean Gingival Index between the Study Groups
Group N Mean SD Median Min. Max. ‘F’ value ‘p’ value
Healthy 15 0.1713 0.1214 0.1300 0.00 0.50 24.321 <0.001* Diabetic with CP 15 0.6800 0.2007 0.7000 0.40 1.10
Diabetic without CP 15 0.4060 0.2548 0.4000 0.10 0.87 *statistically significant
Table 3. PPD
Group N Mean SD Median Min. Max.
Diabetic with CP 15 1.2027 .23119 1.1600 .83 1.80
Table 4. CAL
Group N Mean SD Median Min. Max.
Diabetic with CP 15 1.0700 .28496 1.0000 .80 1.80
Table 5. Correlation between PI and GI versus Electrolytes healthy group
Group Versus
Total Protein (gm/dl)
Albumin (gm/dl)
Calcium (mg/dl)
Phosphorus (mg/dl)
Sodium (mmol/L)
Potassium (mmol/L)
Chloride (mmol/L)
Magnesium (mg/dl)
Healthy
PI Corr. 0.202 0.016 0.136 0.011 -0.019 -0.362 0.07 -0.014
‘p’ valve 0.471 0.955 0.629 0.969 0.946 0.185 0.804 0.962
GI Corr. 0.423 0.113 0.499 0.46 -0.162 -0.249 0.164 0.211
[image:3.595.67.524.457.570.2]‘p’ valve 0.116 0.69 0.059 0.084 0.564 0.372 0.558 0.45
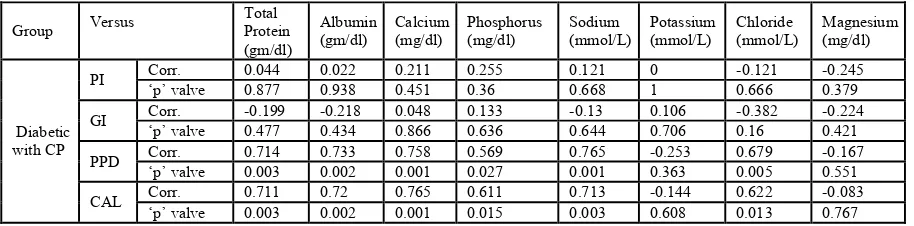
Table 6. Correlation between PI, GI, PPD and CAL versus Electrolytes in diabetic patients with CP
Group Versus
Total Protein (gm/dl)
Albumin (gm/dl)
Calcium (mg/dl)
Phosphorus (mg/dl)
Sodium (mmol/L)
Potassium (mmol/L)
Chloride (mmol/L)
Magnesium (mg/dl)
Diabetic with CP
PI Corr. 0.044 0.022 0.211 0.255 0.121 0 -0.121 -0.245
‘p’ valve 0.877 0.938 0.451 0.36 0.668 1 0.666 0.379
GI Corr. -0.199 -0.218 0.048 0.133 -0.13 0.106 -0.382 -0.224
‘p’ valve 0.477 0.434 0.866 0.636 0.644 0.706 0.16 0.421
PPD Corr. 0.714 0.733 0.758 0.569 0.765 -0.253 0.679 -0.167
‘p’ valve 0.003 0.002 0.001 0.027 0.001 0.363 0.005 0.551
CAL Corr. 0.711 0.72 0.765 0.611 0.713 -0.144 0.622 -0.083
[image:3.595.63.528.605.668.2]‘p’ valve 0.003 0.002 0.001 0.015 0.003 0.608 0.013 0.767
Table 7. Correlation between PI and GI versus Electrolytes in diabetic patients without CP
Group Versus
Total Protein (gm/dl)
Albumin (gm/dl)
Calcium (mg/dl)
Phosphorus (mg/dl)
Sodium (mmol/L)
Potassium (mmol/L)
Chloride (mmol/L)
Magnesium (mg/dl)
Diabetic without CP
PI Corr. 0.110 0.175 -0.075 0.404 0.123 -0.414 -0.477 0.113
‘p’ valve 0.697 0.533 0.792 0.136 0.663 0.125 0.072 0.689
GI Corr. 0,221 0.037 0.078 0.537 0.163 -0.161 -0.460 0.192
Graph-1:Comparison of mean plaque index among study groups
Graph-2: Comparison of mean gingival index among the study groups
There is weak positive correlation was observed between PI and Total Protein, Albumin, Calcium, Phosphorus, Chloride and Magnesium (r=0.423,r=0.113,r=0.499,r=0.460,r=0.164 and r=0.211 respectively).
Correlation between PI versus Electrolytes
Correlation between Plaque Index and Electrolytes showed positive, weak correlation except Chloride and Magnesium.
There is no correlation observed between PI Versus Potassium (r=0). There is negative, weak correlation, observed between PI versus Chloride and Magnesium (r=-0.121, r=-0.245 respectively). But the above correlations were statistically not significant. There is weak positive correlation observed between PI and Total Protein, Albumin, Calcium, Phosphorus and Sodium (r=0.044, r=0.022, r=0.211, r=0.255 and r=0.121 respectively).
Graph 4. Comparison of correleation coefficent between gingival index versus electolytes among the study groups
Correlation between GI versus Electrolytes
Correlation between Gingival Index versus calcium, phosphorus and Potassium showed positive weak correlation (r=0.048, r=0.133,r=0.106 respectively). There is negative weak correlation was observed between GI versus Total Protein, Albumin, Sodium, Chloride and Magnesium (r=0.044, r=0.022, r=0.211, r=0.255 and r=0.121 respectively). Again, all the above correlations were statistically not significant.
Correlation between PPD versus Electrolyte
Correlation between PPD versus Total Protein, Albumin, Sodium, Calcium, Sodium and Chloride showed positive statistically significant strong correlation (r=0.714, r=0.733, r=0.758, r=0.765, r=0.679 respectively. There is a positive statistically significant moderate correlation between PPD versus Phosphorus (r=0.569). There is negative statistically not significant weak correlation was observed between PPD versus Potassium and Magnesium (r=-0.253, r=-0.167 respectively).
Correlation between CAL versus Electrolyte
Correlation between CAL versus Total Protein, Albumin, Sodium, Calcium, Phosphorus, Sodium and Chloride showed positive statistically significant strong correlation (r=0.711, r=0.720, r=0.765, r=0.611, r=0.713, r=0.622 espectively. There is negative statistically not significant weak correlation was
observed between PPD versus Potassium and Magnesium (r=-0.144,r=-0.083 respectively).
Correlation between PI versus Electrolytes
This study showed positive Correlation between Plaque Index and Electrolytes but statistically non significant value and weak correlation except Calcium, Potassium and Chloride. There is negative statistically not significant weak correlation observed between PI versus Calcium, Potassium, and Chloride (r=-0.075, r=-0.414, r=-0.477 respectively). There is weak positive correlation observed between PI versus Total Protein, Albumin, Phosphorus, Sodium and Magnesium (r=0.110, r=0.175, r=0.404, r=0.123 and r=0.113 respectively).
Correlation between GI versus Electrolytes
This study showed positive Correlation between Gingival Index versus Total Protein, Albumin, Calcium, Sodium and Magnesium but there is no statistically significant value and weak correlation (r=0.221, r=0.0.037, r=0.078, r=0.163 and r=0.192 respectively). There is negative statistically not significant weak correlation observed between GI versus Potassium, and Chloride (r=-0.161, r=-0.460 respectively). There is positive statistically significant moderate correlation observed between GI versus Phosphorus (r=0.537).
DISCUSSION
Salivary composition and functions are altered in diabetes. The use of saliva rather than blood for diagnosis has recently been promoted. Obtaining saliva is advantageous for patient as the procedure is non-invasive, stress-free, and allows multiple samplings. The importance of optimal functioning of salivary
glands in oral health is well known. Diabetes mellitus is one such disease affecting the salivary gland functioning and thus altering the salivary constituents. In the present study, the comparison of mean plaque index and the gingival index between the groups shows statistically significant difference (p<0.005) between the groups. Further analysis revealed that there is significant difference between healthy and diabetic with CP groups (p=<0.001).
There is no statistically significant difference between healthy and diabetic without CP groups (p=0.583). There is statistically significant difference between diabetic with CP and diabetic without CP groups (p=0.001). This is obvious since the accumulation of plaque is the primary cause of periodontal disease (Khamees et al., 2012). With respect to potassium, in the present study there is no statistically significant increase in the potassium level, which is inconsistent with the results of Sharon et al. (1985) and Mata et al. (2004)who conducted a study on salivary electrolytes and found significantly increased potassium levels in diabetic groups compared to the non-diabetic groups. In this study there is no significant difference in the salivary concentrations of calcium, sodium, chloride levels in saliva of diabetic patients with periodontitis compared with controls, which is in accordance with the study conducted by Lasisi et al. 2012 and Ben-Ahrey et al. 1993.
It might be due to intact secretory capacity of the salivary glands in type 2 diabetes. In addition sodium and chloride ions are secreted in minute concentrations in the saliva (Sharon et al., 1985)and this might account for the absence of significant difference. In this study there is no significant increase in the salivary concentrations of magnesium which agrees with the study conducted by the Sameeah et al. (2012) while disagreeing with Abid Aun et al. (2012) who found significant difference in salivary levels of magnesium ions between CP and control group. In the present study there is no significant increase in the salivary concentrations of phosphorus levels.
Conclusion
Diabetes mellitus is known to alter the composition of saliva; few studies have shown alteration of salivary constituents in diabetes mellitus. Though the estimated values of salivary electrolytes are not significant in the present study, it can add to the data already recorded in Indian population. However, further studies using large samples are required to evaluate the findings in our study.
REFERENCES
Abid Aunm W.A.2012. Inorganic level in saliva of patients with CP and healthy subject. J Bagh College Dentistry, 24:93-97.
Aryeh, B.H., Serouya, R., Kanter, Y. 1993. Oral health and salivary composition in diabetic patients. J Diabetes Complication, 7:57-62.
Dodds, M.W. and Dodds, A.P. 1997. Effects of glycemic control on saliva flow rates and protein composition in non-insulin dependent diabetes mellitus. Oral Surg Oral
Med Oral Patho Oral Radio Endo, 83:465-470.
Edgarm W.M. 1992. Saliva its secretion, composition and functions. Br Dent J.,172:305-312.
Khamees, S.I., Mohammad, A.N., Majid, A.Y. 2012. Evaluation of inorganic ions and enzymes levels in saliva of patients with CP and healthy subjects. J Bagh College Dentistry,24:107-111.
Kolte, A.P., Kolte, R.A., Laddha, R.K. 2012. Effect of smoking on salivary composition and periodontal status. J Indian Soc periodontal, 16:350-353.
Laine, M.A., Sewon, L.A., Karjalainen, S.M., Helenius, H., Doroguinskaia, A. and Lehtonen-Veromaa, M. 2002. Salivary variables in relation to tobacco smoking and female sex steroid hormone- use in 30 to 59 years of women. Acta Odontol Scand,60:237-240.
Lasisi, T.J., Fasanmade, A.A. 2012. Comparative analysis of salivary glucose and electrolytes in diabetic individuals with periodontitis. Ann Ind Pg Med., 10:25-30.
Loe, H. 1967. The gingival index, plaque index and the retention index systems. J Periodontol, 38:610-616. Mata, A.D., Marques, D. and Rocha, S. 2004. Effects of
diabetes mellitus on salivary secretion and its composition in human. Mol cell Biochem, 2:137-142.
Panchbai, A.S., Degwekar, S.S. and Bhowte, R.R. 2010. Estimation of salivary glucose, salivary amylase, salivary total protein and salivary flow rate in diabetics in India. J Oral Science,52:359-368.
Sharon, A., Hannah, B.A., Biran, I., Yoram, K., Szargel, R., Gutman, D. et al. 1985. Salivary composition in diabetic patients. J Oral Med., 40:23–26.
Silness, J. and Loe, H.1964. Periodontal disease in pregnancy. II. Correlation between oral hygiene and periodontal condition. Acta Odontol,22:121-135.
Tenovuo, J., Lehtonen, O.P., Viikari, J., Lajava, H., Vilja, P. and Tuohimaa, P. 1986. Immunoglobulins and innate antimicrobial factors in whole saliva of patients with insulin-dependent diabetes mellitus. J Dent Res., 65:62-66.