SPREADSHEET FOR QUANTUM PHYSICS: QUANTIZATION OF PARTICLE ENERGY
1
Shabrina and
1
Postgraduate student in Physics Education, Yogyakarta State
2
Doctor, Associate Professor at Physiscs Education Study Program, Yogyakarta State University,
ARTICLE INFO ABSTRACT
Phonological awareness is the sensitivity to the
mathematical algorithm, model, visual, and application effectively. In the implementation, spreadsheet is easy to study. The advantage of spreadsheet is that spreadsheet can serve as a number processing program and a dynamic graphical display. In re
the researcher would like discuss the use of the spreadsheet on the quantization of particle energy in one-dimensional box within the learning process of quantum physic. Spreadsheet might be implemented in the
students in their concept visualization.
Copyright©2018,Shabrina and Heru Kuswanto.This
unrestricteduse,distribution,andreproductioninanymedium,
INTRODUCTION
Physics learning can be conducted by benefitting the computer assistance so that the presentation of Physics learning process will be easier, more interesting, and more accurate and such assistance can be attained from the spreadsheet program (Benacka, 2007). Regarding this problem, through this article the researchers will discuss the benefits of using spreadsheet in the quantization of particle energy in one
within the learning process of Quantum Physics. Spreadsheet can provide a more dynamic impression on the graphic of quantization for the energy particle equation along with the changeable simulations in accordance to the given values. Spreadsheet itself is expected to be one of the graphical media that might be benefitted for designing and developing more interesting and meaningful learning materials for stud (Benacka, 2008). Excel is one of the spreadsheet programs that have been widely used. This type of spreadsheet refers to any aid that enables procedure development (for example, attaining the animation effects) by executing simple programming commands (Baker and Sugden, 2003). Several procedures in Excel can be executed in order to perform the functions of graphical and geometrical construction (Baker, Hvorecky, Sugden, 2005).
*Corresponding author: Heru Kuswanto,
Doctor, Associate Pofessor at Physiscs Education Study Program, Yogyakarta State University, Yogyakarta, Indonesia
ISSN: 0975-833X
ArticleHistory:
Received 26th December, 2017 Received in revised form 07th January, 2018
Accepted 19th February, 2018 Published online 28th March, 2018
Citation: Shabrina and Heru Kuswanto. 2018. “Spreadsheet for quantum physics: quantization
JournalofCurrentResearch, 10, (03), 66393-66399.
Keywords:
Spreadsheet, Quantum, Quantization of Particle Energy, One-dimensional box.
RESEARCH ARTICLE
SPREADSHEET FOR QUANTUM PHYSICS: QUANTIZATION OF PARTICLE ENERGY
IN ONE-DIMENSIONAL BOX
Shabrina and
2,*Heru Kuswanto
Postgraduate student in Physics Education, Yogyakarta State University, Yogyakarta, Indonesia
at Physiscs Education Study Program, Yogyakarta State University,
Yogyakarta, Indonesia
ABSTRACT
Phonological awareness is the sensitivity to the Spreadsheet might be implemented mathematical algorithm, model, visual, and application effectively. In the implementation, spreadsheet is easy to study. The advantage of spreadsheet is that spreadsheet can serve as a number processing program and a dynamic graphical display. In relation to these features, through this article the researcher would like discuss the use of the spreadsheet on the quantization of particle energy in dimensional box within the learning process of quantum physic. Spreadsheet might be implemented in the learning activities of quantum physics for eliciting understanding and assisting the students in their concept visualization.
ThisisanopenaccessarticledistributedundertheCreativeCommons
medium,providedtheoriginalworkisproperlycited.
Physics learning can be conducted by benefitting the computer that the presentation of Physics learning process will be easier, more interesting, and more accurate and such assistance can be attained from the spreadsheet program (Benacka, 2007). Regarding this problem, through this article ss the benefits of using spreadsheet in the quantization of particle energy in one-dimensional box within the learning process of Quantum Physics. Spreadsheet can provide a more dynamic impression on the graphic of ation along with the changeable simulations in accordance to the given values. Spreadsheet itself is expected to be one of the graphical media that might be benefitted for designing and developing more interesting and meaningful learning materials for students Excel is one of the spreadsheet programs that have been widely used. This type of spreadsheet refers to any aid that enables procedure development (for example, attaining the animation effects) by executing simple programming Sugden, 2003). Several procedures in Excel can be executed in order to perform the functions of graphical and geometrical construction (Baker, Hvorecky, and
Physiscs Education Study Program, Yogyakarta State University, Yogyakarta, Indonesia.
The advantage of this spreadsheet is being able to serve as a number-processing word and a more dynamic graphical display (Gebeily, 2007). This type of spreadsheet can used in the implementation of mathematical algorithm, model, visualization, and application effectively (Arganbright, 2006). In the practice, spreadsheet is easy to learn. This program highly supports the use of learning media in terms of displaying mathematical equations which involves multiple numbers and which also serves as a graphic so that the learning process will be more meaningful (Olivera, 2012). The use of spreadsheet as a learning media is able to assist students in understanding learning materials and to draw the students’ interest in the same time (Robinson, 2011). This spreadsheet is also expected to be one of the learning media that might be benefitted for designing and developing interesting, innovative, and stimulating learning mate
students’ curiosity. In turn, the use of such spreadsheet is expected to be able to elicit the students’ learning motivation and therefore the learning process will be more meaningful for the students (Rochowicz, 2015).
educator is able to design an animation of graphical display that can be applied in the classroom demonstration (Arganbright, 2006). Classroom demonstration is able to elicit the students’ understanding and to present the visual components for the students altogether. Modelling efforts through the classroom demonstration is a very important matter in the teaching-learning process.
InternationalJournalofCurrentResearch
Vol. 10, Issue, 03, pp.66393-66399, March, 2018
Spreadsheet for quantum physics: quantization of particle energy in one
SPREADSHEET FOR QUANTUM PHYSICS: QUANTIZATION OF PARTICLE ENERGY
University, Yogyakarta, Indonesia
at Physiscs Education Study Program, Yogyakarta State University,
Spreadsheet might be implemented in the mathematical algorithm, model, visual, and application effectively. In the implementation, spreadsheet is easy to study. The advantage of spreadsheet is that spreadsheet can serve as a
number-lation to these features, through this article the researcher would like discuss the use of the spreadsheet on the quantization of particle energy in dimensional box within the learning process of quantum physic. Spreadsheet might be learning activities of quantum physics for eliciting understanding and assisting the
CommonsAttributionLicense,whichpermits
The advantage of this spreadsheet is being able to serve as a processing word and a more dynamic graphical display (Gebeily, 2007). This type of spreadsheet can also be used in the implementation of mathematical algorithm, model, visualization, and application effectively (Arganbright, 2006). In the practice, spreadsheet is easy to learn. This program highly supports the use of learning media in terms of g mathematical equations which involves multiple numbers and which also serves as a graphic so that the learning process will be more meaningful (Olivera, 2012). The use of spreadsheet as a learning media is able to assist students in g materials and to draw the students’ interest in the same time (Robinson, 2011). This spreadsheet is also expected to be one of the learning media that might be benefitted for designing and developing interesting, innovative, and stimulating learning materials and also challenging the students’ curiosity. In turn, the use of such spreadsheet is expected to be able to elicit the students’ learning motivation and therefore the learning process will be more meaningful for the students (Rochowicz, 2015). In using spreadsheet, an educator is able to design an animation of graphical display that can be applied in the classroom demonstration (Arganbright, 2006). Classroom demonstration is able to elicit the students’ understanding and to present the visual nts for the students altogether. Modelling efforts through the classroom demonstration is a very important
learning process.
INTERNATIONAL JOURNAL OF CURRENT RESEARCH
These efforts will provide meaningful experiences for the students and show how a concept can be useful in attaining better understanding (Olivera, 2010). The modelling-related problems often appear in the use of textbooks because textbooks provide concept in a static manner and, consequently, textbooks are not sufficiently helpful for the students in attaining the appropriate understanding (Confrey and Maloney, 2007). An educator might benefit several forms of visual representation in conveying mathematical ideas and in improving conceptualization and teaching activities (Sugden, 2007). The visual representation itself consists of textbook illustrations and textbook sketches that a teacher might draw on the blackboard. However, the visual representation in textbooks tend to be static. With the availability of interactive media and animated visualization through technology, the learning process might be improved significantly (Baker, 2007).
The results of a study by Miller and Sugden (2009) show that through the use of spreadsheet the students are able to: (a) attain new ideas and strong concept mathematically; (b) attain visual representation through nearly unlimited mathematical equation; and (c) perform study/investigation significantly so that the students’ mathematical experience can be expanded. Through the use of spreadsheet, it is expected that the students are able to maintain their learning interest in order to pursue the exploration on simple formulas that are combined with the table layout; this combination will open new possibilities for the students to attain the insights on mathematical concepts (Baker, Hvorecky and Sugden, 2005). Spreadsheet can be an alternative teaching-learning tool which implementation should be explored more. The fundamental paradigm of spreadsheet, namely a sequence of rows and columns, should be expanded on the mathematical function, statistics, custom-code writing in languages, and multipurpose graphic facility (Baker and Sugden, 2003).
Students are able to attend the learning activities by means of spreadsheet through the following stages as follows (Olivera, 2010): (a) observing and analysing situations from the physical perspective; (b) formulating problems; (c) performing mathematical modelling such dependent and independent variable definition, parameter, domains of modelling function and domain of visualization; (d) drawing problem conceptions on the spreadsheet (this is a very important stage that helps the students to master mathematical concepts that have been introduced in the previous stage); and (e) performing spreadsheet programming according to the structures that have been defined previously namely the function programming that is in accordance with the solution for the graphical pictures and problems.
MATERIALS AND METHODS
Razeghi (2009: 101) explained that a particle that had been trapped in one-dimensional box was analogous with a wave thatstood on a strained rope between the walls of the box under the condition that the function of the wave on the walls is equal to zero.
Ѱ = 0
The length of de-Broglie wave in general might be formulated in Equation (1) as follows:
= , = 1,2, 3, … (1)
The kinetic particle energy might be formulated in Equation (2) as follows:
= =( ) = (2)
Because,
= ℎ ⇔ =ℎ
If Equation (1) were substituted into Equation (2), then the
amount of K particle energy would become:
= (3)
In this model, the V potential particle energy = 0 so that the
energy that the particle could contain would be:
= = = (4)
⇔ = ℎ
8
For n quantum number = 1, the particle energy will be as
follows:
= ℎ
8
Thereby, the particle energy on the n quantum might be stated
in … as follows:
= (5)
Based on equation (5), the researchers might conclude that:
Particle energy was quantified.
Quantum number characterized the energy level.
The minimum particle energy was not equal to zero.
The simplest quantum mechanics problem was the particle that had been trapped in one-dimensional box which wall thickness
was unlimited. The limited particle movement along the x axis
between x = 0 and x = L was caused by the unlimited wall
thickness. A particle did not lose its energy when the particle was in collision with the wall; as a result, total energy of the particle was constant. From the formal perspective of quantum
mechanics, the V potential energy of the particle became
unlimited in both sides of the box while inside the box the V
potential energy of the particle was equal to zero. The reason was that the particle had been unable to possess unlimited energy; as a result, it was impossible for the particle to be outside the box and therefore the function of the wave was equal to zero for x< 0 and x> L.
The Schrodinger equation in the box was in accordance to Equation (6):
Ѱ +
ћ Ѱ = 0 (6)
Ѱ( ) = sin( ) + cos( ) (7)
With,
=√2
ћ
This solution should be maintained under the limitation
requirements namely x = 0 and x = L. The reason was that cos
0 = 1; consequently, the second term was not equal to zero for
x = 0; therefore, B should be equal to zero (B = 0).
Furthermore, because sin 0 = 0 the term that contained sinus
always resulted in x = 0; however, the term would be equal to
0 in x = L only if:
√
ћ = , untuk = 1,2,3, … (8)
The reason was that the zero value for sinus was found
in , 2 , 3 , … .
From Equation (8) it was apparent that the energy that the particle might contain had certain value and this value was the eigen value. The eigen value formed the value inside the box
that had energy as follows:
= ћ , dengan = 1,2,3, … (9)
The wave function of the particle that had energy in the box
was as follows:
Ѱ = sin
ћ (10)
By substituting Equation (9) to Equation (10), the researchers found:
Ѱ = sin (11)
[image:3.595.388.476.50.359.2] [image:3.595.321.549.401.734.2]The normalization of the wave function was in accordance to Equation (12):
∫ |Ѱ | = ∫ sin = (12)
As a result, the researcher found:
2= 1 atau =
2
So, the normalized wave function for the particle in one-dimensional box was in accordance to Equation (13):
Ѱ = sin ; = 1,2,3, … (13)
In this study, it concerned to discuss the equation of particle energy quantization in the one-dimensional box, Equation
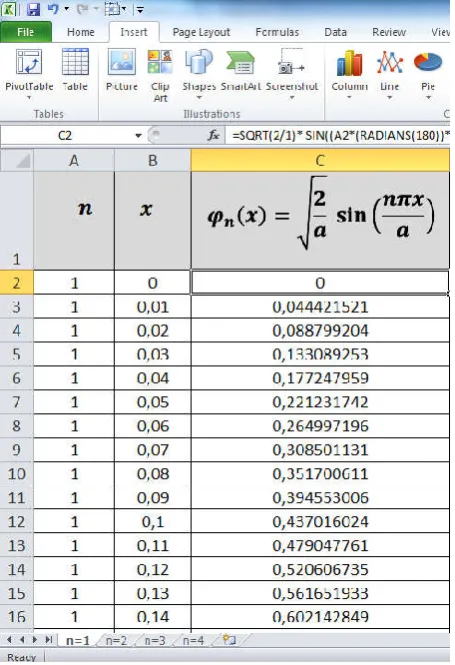
(13). For example, n = 1 and x = 0 until x= 1. In conducting
this study, on cell (A1) the researchers would write the value
of n and on the cell (B1) the researchers would write the value
of x as having been displayed in Figure 1. Figure 2, on the
other hand, displayed the guidelines for designing the graphic of particle energy quantization in the one-dimensional box by writing the Excel formula on the cell (C2) according to Equation (13). The Excel formula was written under the following equation:
Figure 1. Input for the Value n = 1 and x = 0untulx = 1
Figure 2. Input for the Equation of Particle Energy Quantization in One-Dimensional Box
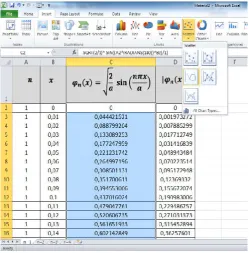
Then, Figure 3 displayed the square equation of the particle energy quantization in the one-dimensional box by writing the Excel formula on cell (D2). This Excel formula was written on Equation (C2)^2. In order to formulate the graphic of particle energy quantization in one-dimensional box, C column should
be blocked. Then, the researchers selected Insert (on the
[image:4.595.42.288.145.429.2]Menu), Scatter, and Smooth according to Figure 4.
[image:4.595.322.548.179.412.2]Figure 3. Input for the Square Equation of Particle Energy Quantization in One-Dimensional Box
Figure 4. Designing the Graphic for the Equation of Particle Energy Quantization in One-Dimensional Box
The researchers performed the same manner for drawing the square graphic for the equation of particle energy quantization in one-dimensional box.
The researchers blocked D column and selected Insert, Scatter,
and Smooth as having been displayed in Figure 5. The second
review was directed toward n = 2 and x = 0 until x = 1. In order
to perform the second review, on cell (A1) the researchers
wrote the n value and on cell (B1) the researchers wrote the x
value in accordance to Figure 6. Through the same procedures, the researchers designed the graphic of particle energy
quantization in one-dimensional box on the value n = 3, 4 and
[image:4.595.388.477.466.770.2]so on according to the above guidelines.
Figure 5. Designing the Graphic for the Square Equation of Particle Energy Quantization in One-Dimensional Box
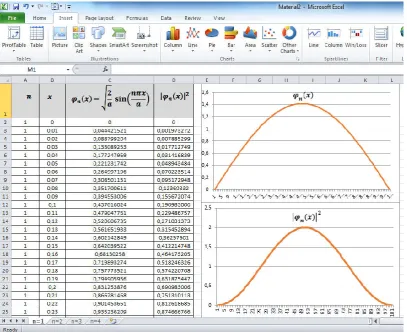
[image:4.595.39.289.472.726.2]Figure 7. Comparison on the Graphics that Had been Resulted from Ѱ ( ) and |Ѱ ( )| on n = 1 and x = 0 until x = 1
Figure 9. Comparison on the Graphics that Had been Resulted from Ѱ ( ) and |Ѱ ( )| on n = 3 and x = 0 until x = 1
RESULTS
The particle in one-dimensional box resulted in certain graphics in accordance to their characteristics as having been displayed in Figure 7, 8, 9, and 10. Figure 7 displayed the comparison of the graphics that had been resulted from … and
… on the value n = 1 and x = 0 until x = 1. The graphical
comparison should be provided in order that the students would be able to differentiate between the graphic for the equation of particle energy quantization and the graphic for square equation of particle energy quantization in one-dimensional box. Based on the table and the graphic of wave function, the researchers found that the probability for identifying the particle had not been equal for each interval. However, the peak of the function was found in several areas
depending on the value of n.
Conclusion
Spreadsheet can be implemented in order to simulate the learning process of Quantum Physics (particle energy quantization in one-dimensional box). The spreadsheet is expected to be able to elicit the students’ understanding and curiosity.
REFERENCES
Arganbright, D. 2005. Enhancing mathematical graphical
displays in excel through animation. Electronic Journal of
Spreadsheets in Education (eJSiE):2(1), Article 8,
120-147, Available online at: http://epublications. bond.edu. au/ejsie/vol2/iss1/8
Baker, J. and Sugden, S. 2003. Spreadsheets in education - The
first 25 years. Electronic Journal of Spreadsheets in
Education (eJSiE). Available online at
http://epublications.bond.edu.au/ejsie/vol1/iss1/2
Baker, J. E. 2007. Excel and the goldbach comet. Electronic
Journal of Spreadsheets in Education (eJSiE):2(2), Article
2. Available online at: http://epublication s.bond.e du.au/ejsie/vol2/iss2/2
Baker, J.E., Hvorecký, J., and Sugden, S.J. 2005. Recursion
and spreadsheets. Electronic Journal of Spreadsheets in
Education (eJSiE):2(1), Article 3. Available online at:
http://epublications.bond.edu.au/ejsie/vol2/iss1/3
Benacka, J. 2007. Spreadsheet numerical modelling in
secondary school physics and biology. Electronic Journal
of Spreadsheets in Education (eJSiE): Available online at
http://epublications.bond.edu.au/ejsie/vol2/iss3/3
Benacka, J. 2008. 3D Graphics with spreadsheets. Electronic
Journal of Spreadsheets in Education (eJSiE):3(1), Article
7. Available at: http://epublications .bond.edu.au/ ejsie/ vol3/iss1/7
Confrey, J. and Maloney, A. 2007. A Theory of mathematical modelling in technological settings, modelling and applications in mathematics education, The 14th ICMI Study, Springer
El-Gebeily, M. and Yushau, B. 2007. Curve graphing in MS
excel and applications. Electronic Journal of Spreadsheets
in Education (eJSiE):2(2), Article 6. Available online at:
http://epublications.bond.edu.au/ejsie/vol2/iss2/6
Miller, D. A. and Sugden, S. J. 2009. Insight into the fractional
calculus via a spreadsheet. Electronic Journal of
Spreadsheets in Education (eJSiE):3(2), Article 4,
Available online at: http://epublications.bon d.edu.au/ ejsie/vol3/iss2/4
Oliveira, M. C. and Nápoles, S. 2010. Using a Spreadsheet to Study the Oscillatory Movement of a Mass-Spring System.
Electronic Journal of Spreadsheets in Education
(eJSiE):3(3), Article 3, Available online at:
http://epublications .bond.edu.au/ejsie/vol3/iss3/2
Oliveira, M. Nápoles, S, and Oliveira, S. 2012. Fourier analysis: graphical animation and analysis of experimental
data with excel. Electronic Journal of Spreadsheets in
Education (eJSiE):5(2), Article 2. Available online at:
http://epublications.bond.edu.au/ejsie/vol5/iss2/2
Razeghi, M. 2009. Fundamentals of solid state engineering,
3th Edition. USA: Springer
Robinson, G. and Jovanoski, Z. 2011. The use of microsoft excel to illustrate wave motion and fraunhofer diffraction
in first year physics courses. Electronic Journal of
Spreadsheets in Education (eJSiE):4(3), Article 5.
Available online at: http://epublications.b ond.edu.a u/ejsie/vol4/iss3 /5
Rochowicz Jr., J. A. 2015. Harmonic numbers: insights,
approximations and applications. Electronic Journal of
Spreadsheets in Education (eJSiE):8(2), Article 4,
Available online at: http://epublications.bond. edu.au/ejsie/ vol8/iss2/4
Sugden, S. 2007. Spreadsheets: An overlooked technology for
mathematics education. Gazette of the Australian
Mathematical Society. Available online at
http://www.austms.org.au/Publ/Gazette/2007/May07/068Cl assroomNotes.pdf