Effect of Supplementation of Chelated Zinc on
Milk Production in Ewes
Ayman Ahmed Hassan1*, Ghada Mostafa El Ashry2, Soliman Mohamed Soliman2
1Animal Production Research Institute, Ministry of Agriculture, Dokki, Giza, Egypt; 2Regional Centre for Food Feed, Agriculture Research Centre, Ministry of Agriculture, Dokki, Giza, Egypt.
Email: *Aymanan19@hotmail.com
Received January 4th, 2011; revised July 13th, 2011; accepted July 20th, 2011.
ABSTRAC
This study was carried out at the Noubaria Station, Animal Production Research Institute. Twelve Barki ewes at 3 - 4 years of age 45 ± 1.5 kg body weight were used in the present investigations. Animals were stratified for their initial body weight and age. Each group was composed of 4 pregnant animals at three months. All animals were housed in semi open pens in which water was ad-libitum. The first diet contains the basal diet plus 25 mg of Zn/kg DM as
(ZnSO4·7H2O). The second and the third diets contain the basal diet plus 15 and 25 mg of Zn/kg DM as (Zn methionine,
(ZnMet)) respectively. The inorganic Zn (ZnSO4·7H2O) caused a significant decline (P < 0.05) in digestibility
coeffi-cients, nutritive value, nitrogen utilization, Cell wall constituents, total VFA’s, rumen volume, microbial nitrogen syn-thesis and milk composition and yield compared to the both organic Zn (ZnMet). While, organic Zn (ZnMet) caused a significant decline (P < 0.05) in glucose and urea compared to the inorganic Zn (ZnSO4·7H2O). But inorganic or
or-ganic zinc did not cause any effect on the serum total protein (TP), albumin (A) concentration, globulin, creatinine, aspartates aminotransferase (AST) and alanine aminotransferase (ALT). The inorganic Zn (ZnSO4·7H2O) caused a
sig-nificant decline (P < 0.05) in the antioxidants activity (GSH, GSH-Px, SOD and MDA) compared to the both organic Zn (ZnMet).
Keywords: Inorganic Zn, Organic Zn, Digestibility Coefficients, Nutritive Value, Nitrogen Utilization, Milk Yield, Antioxidants Activity
1. Introduction
Zinc has been associated with protein in several biologi-cal systems, particularly enzymes. Several zinc metal-loenzymes have been characterized [1]. Orally adminis-tered zinc appears to be absorbed at different rates by various parts of the digestive tract in dairy cattle [2]. More evidence is needed before concluding that some organs of the gastro-intestinal tract absorb and retain zinc to a greater extent than other organs. These studies in vivo and in vitro were designed to determine the uptake of zinc by the rumen tissue of lambs.
Chelation refers to a bonding formed between a metal ion (mineral) and ligand (protein or amino acid). A min-eral complex is a mixture the minmin-eral and organic com-pound. The biological role of chelated trace minerals is important. To be beneficial in dairy cows, the product should be stable in the rumen and digestive tract.
Zinc bioavailability from a variety of organic sources has been evaluated in numerous in vivo experiments [3].
However, a limited amount of research has compared zinc methionine (ZnMet), which is produced by chelation of ionized Zn from a soluble Zn salt with AA or partially hydrolyzed protein [4] with inorganic Zn sources. Previ-ously, ZnMet has improved performance and carcass characteristics in feedlot steers [5] and hoof quality measurements in fattening bulls [6] and has increased Zn concentrations in plasma, liver, and kidney of calves supplemented with high Zn concentrations (500 mg/kg of DM) [7], relative to inorganic Zn sources (ZnSO4 or
ZnO). Although the mechanisms responsible for these observed differences remain unclear, it has been hy-pothesized that Zn bound to organic compounds is more available for absorption than Zn from inorganic sources [8].
gen-eral, variable bioavailability values have been reported with the trace mineral chelates and complexes, indicating no advantage to the use of organic forms of this element [11].
The antioxidant properties of zinc were first demon-strated in vitro, there is also clear evidence that zinc
functions as an antioxidant in the body. One area of growing interest is the role of zinc as an antioxidant in the central nervous system (CNS), particularly the brain. Compared to other soft tissues, the human brain contains significant amounts of zinc. Among the essential trace elements, zinc is second only to iron in total concentra-tion in the brain. [12]
The main objective of our studies was to evaluate sup-plementation of different forms (inorganic vs organic) Zinc on digestibility, ruminal fermentation, milk produc-tion, biochemical parameters and antioxidant response in ewes.
2. Materials and Methods
2.1. Animal and Experimental Design
This study was carried out at the Noubaria Station, Ani-mal Production Research Institute. Twelve Barki ewes at 3 - 4 years of age 45 ± 1.5 kg body weight were used in the present investigations. Animals were stratified for their initial body weight and age. Each group was com-posed of 4 pregnant animals at three months. All animals were housed in semi open pens in which water was ad- libitum.
2.2. Experimental Diets
(Table 1) shows the experimental diets fed to ewes. In
this experiment, concentrate feed mixture was used, its consisted of 45% yellow corn, 31.5% wheat bran, 5% undecorticated cotton seed meal, 10% soybean meal, 5% molasses, 2% limestone, 1% salt and 0.5 premix (con-taining 25 mg Zn) as basal diet. The first diet contains the basal diet plus 25 mg of Zn/kg DM as (ZnSO4·7H2O).
The second and the third diets contain the basal diet plus 15 and 25 mg of Zn /kg DM as (Zn methionine, (ZnMet)) respectively, which was approximately around the Zn recommended levels of [13]. The diet was offered in two equal portions daily (8.00 and 16.00).
[image:2.595.308.538.112.233.2]Kids were kept with their dams all the time except on the day of milk yield determination. The kids were sepa-rated from their dams at 7 p.m. of the day perior to the recording day. Dams were milked at 7 a.m. and 5 p.m. Milk samples were collected once biweekly at 0, 2, 4, 8 and 10 week for recording milk yield production. A sam-ple of milk (100 ml) was taken from two consecutive milking. Milk samples were chemically analyzed for total solid (TS), protein, fat and ash according to [14]
Table 1. Chemical analysis of the concentrate feed mixture (CFM) and Rice straw (RS) fed to ewes (on DM basis).
Item CFM RS
DM 88.10 89.68 OM 95.46 87.66 CP 13.75 3.75 CF 6.93 38.65 EE 2.83 0.89 NFE 71.95 44.37
Ash 4.54 12.34 NDF 23.27 73.21 ADF 11.68 47.54 ADL 7.44 21.77
Hemicellulose 11.59 25.67
Cellulose 4.24 25.77
Basal diet analyzed 25 mg of Zn /kg of DM; Vitamin premix contained per kg: 6,600,000 IU of vitamin A, 4,400,000 I. U. of vitamin D, and 2,200 I U of vitamin E; Trace minerals provided in mg/kg of diet: 25 mg of Fe as FeSO4, 20 mg of Mn as MnSO4, 10 mg of Cu as CuSO4, 0.5 mg of I as Ca(IO3)·H2O, 0.1 mg of Co as CoCO3, and 0.1 mg of Se as NaSeO3.
while, lactose was calculated by differences.
2.3. Blood Collection and Analysis
Blood samples were collected at the end of experiment. Blood samples were obtained from the external jugular vein of the animals in the morning before access to feed and water. Plasma or serum were obtained by centrifuga-tion of blood and were stored at –20˚C until analysis. Serum total protein (TP) was measured by the Biuret method according to [15]. Albumin (A) concentration was determined according to the method of [16] while globulin was calculated. Kidney function was evaluated by measuring blood urea using the colorimetric methods [17] using commercial kits. Creatinine was measured using the colorimetric method according to [18]. Liver function was assessed by measuring the activities of as-partates aminotransferase (AST) and alanine aminotrans- ferase (ALT) in the serum as [19].
2.4. Feces Collection and Analysis
de-tergent fiber (NDF), acid dede-tergent fiber (ADF) and acid detergent lignin (ADL) using Tecator Fibrotic system. Hemicelluloses and cellulose were determined by differ-ence [20].
2.5. Rumen Liquid Collection and Analysis
Rumen liquid samples taken at 0, 3 and 6 h post feeding from three fistulae adult female Barki sheep weighing approximately 45.50 ± 0.50 kg BW for each treatment, were analyzed immediately for pH using Orian 680 digi-tal pH meter. Samples were strained through four layers of chesses cloth. For each sampling time, rumen fluid samples were preserved for ammonia nitrogen (NH3-N)
determination by adding concentrated H2SO4 (3 drop per
5 ml). The concentration of NH3-N was determined by
using magnesium oxide (MgO) as [14]. Total volatile fatty acid (VFA’s) concentration was estimated by using steam distillation methods [21]. Total bacteria count was carried out according to (Difco, 1984). Rumen volume was determined by the calorimetric method using Cr- EDTA before and after, 3 and 6 h of feeding [22].
2.6. Measurements of SOD, GSH and MDA Activities
Total SOD activity was determined [23]. Glutathione peroxidase (GSH-Px) activity was measured [24]. The malondialdehyde (MDA) levels were determined by the method based on the reaction of MDA with thiobarbi-turic acid according to [25].
2.7. Statistical Analysis
Means were calculated for all variables by cow within period.Data were analyzed using the mixed procedure of SAS [26].Period and cow were considered random ef-fects; diet and cannulationeffects were considered fixed. Estimation method was restrictedmaximum likelihood and the degrees of freedom method was [26]. Differences were tested using the PDIFF optionin SAS [26] using a protected (P < 0.10) LSD test.Differences were declared
significant at a P < 0.05; andtrends were discussed at a P
< 0.15, unless stated otherwise.
3. Results and Discussion
3.1. Digestibility Coefficients, Nutritive Values and Nitrogen Utilization
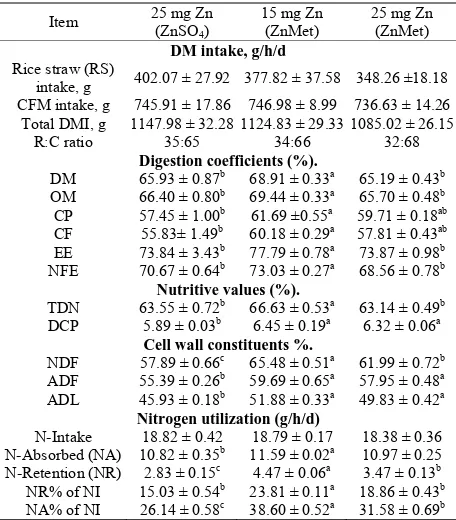
Dry matter intake, apparent digestibility coefficients, feeding values and nitrogen utilization of inorganic or organic Zn rations fed to sheep were illustrated in (Table 2) Feed intake was not significantly affected by Zn
[image:3.595.309.537.121.381.2]source or level during the experiment. [27] in the first of three experiments, feed intake tended to drop less in zinc methionine fed calves challenged with Infectious Bovine
Table 2. Dry matter intake, digestion coefficients, cell wall constituents, nutritive values and nitrogen utilization of experimental rations (mean ± SE).
Item 25 mg Zn (ZnSO4) 15 mg Zn (ZnMet) 25 mg Zn (ZnMet)
DM intake, g/h/d Rice straw (RS)
intake, g 402.07 ± 27.92 377.82 ± 37.58 348.26 ±18.18 CFM intake, g 745.91 ± 17.86 746.98 ± 8.99 736.63 ± 14.26 Total DMI, g 1147.98 ± 32.28 1124.83 ± 29.33 1085.02 ± 26.15
R:C ratio 35:65 34:66 32:68
Digestion coefficients (%).
DM 65.93 ± 0.87b 68.91 ± 0.33a 65.19 ± 0.43b
OM 66.40 ± 0.80b 69.44 ± 0.33a 65.70 ± 0.48b
CP 57.45 ± 1.00b 61.69 ±0.55a 59.71 ± 0.18ab CF 55.83± 1.49b 60.18 ± 0.29a 57.81 ± 0.43ab EE 73.84 ± 3.43b 77.79 ± 0.78a 73.87 ± 0.98b NFE 70.67 ± 0.64b 73.03 ± 0.27a 68.56 ± 0.78b
Nutritive values (%).
TDN 63.55 ± 0.72b 66.63 ± 0.53a 63.14 ± 0.49b
DCP 5.89 ± 0.03b 6.45 ± 0.19a 6.32 ± 0.06a
Cell wall constituents %.
NDF 57.89 ± 0.66c 65.48 ± 0.51a 61.99 ± 0.72b ADF 55.39 ± 0.26b 59.69 ± 0.65a 57.95 ± 0.48a ADL 45.93 ± 0.18b 51.88 ± 0.33a 49.83 ± 0.42a
Nitrogen utilization (g/h/d)
N-Intake 18.82 ± 0.42 18.79 ± 0.17 18.38 ± 0.36
N-Absorbed (NA) 10.82 ± 0.35b 11.59 ± 0.02a 10.97 ± 0.25 N-Retention (NR) 2.83 ± 0.15c 4.47 ± 0.06a 3.47 ± 0.13b NR% of NI 15.03 ± 0.54b 23.81 ± 0.11a 18.86 ± 0.43b NA% of NI 26.14 ± 0.58c 38.60 ± 0.52a 31.58 ± 0.69b a,b,cMeans within rows with different superscript are significantly differ (
P < 0.05).
Rhinotracheitis (IBR) compared to ZnO fed calves. In the second experiment, control calves fed 30 ppm zinc had lower (P < 0.05) feed intake compared to zinc
methion-ine fed calves receiving 90 ppm zinc, while in experi-ment three, recovery from depressed feed intake due to IBR fever was slower for ZnO fed calves compared to calves fed zinc methionine. The differences among groups were significant. The sheep fed 15 mg Zn as (ZnMet) ration showed higher (P < 0.05) apparent
di-gestibility DM, OM, CP, CF, EE and NFE than those fed other rations. Some researcher corroborated each other in that each found that absorption was essentially identical for inorganic and chelated zinc, being about 40%, but that the chelated form of zinc was retained better (P <
0.05) than the inorganic form of zinc [28]. The methion-ine of this proteinate was only of small consequence in the rumen [29]. Chelated minerals usually cost more, per unit of metal element, than the same metal in inorganic form. Absorption of zinc is also reduced by an excess or deficiency of proteins in feed [30].
Sheep fed ZnMet ration as 15 mg Zn showed higher (P
when supplemented at high concentrations. Increased uptake of Zn from ZnMet could be explained by ZnMet interacting less than ZnSO4, with antagonists that form
insoluble complexes. Alternatively, Zn from ZnMet may have been associated with ligands that facilitated Zn up-take in the duodenum. Metal ions may be absorbed as part of a metal: peptide complex, there by facilitating absorption of Zn via intestinal transport mechanisms dis-tinct from inorganic Zn [31]. The importance of enzyme function as it relates to animal performance was illus-trated by zinc depletion-repletion trials reported by [32]. Zinc was shown to have a critical role in proteolytic en-zyme systems associated with muscle protein turnover. Zinc functions in the immune system through energy production, protein synthesis, stabilization of membranes against bacterial end toxins, antioxidant enzyme produc-tion, and maintenance of lymphocyte replication and antibody production [33]. Adding complexes trace min-erals to the lower level of inorganic supplementation improved responses over the higher levels of inorganic trace minerals. Adding additional complexes trace min-erals significantly increased both antibody titer levels and macrophage killing ability over the highest level of inor-ganic trace mineral supplementation [34].
Data of nitrogen balance in 25 mg of Zn/kg DM as (ZnSO4·7H2O) was the lowest (P < 0.05) value (2.83 g)
while in 15 mg Zn as (ZnMet) was the highest (4.47 g, respectively), the mean that treatments improved nitro-gen balance. There were reflected in better (P < 0.05) N-
utilization of the ration fed to sheep.It may be possible for metal ions to be transported into the intestinal mucosa as part of metal peptide complexes via mechanisms dis-tinct from ionic Zn [31]. Furthermore, researchers have demonstrated the ability of ruminal and omasal tissue to effectively absorb and translocate methionine and the dipeptides carnosine and methionylglycine [35]. Solubil-ity is critical for trace mineral absorption. To maximize uptake, chelates and other complexes should be stable in the rumen and digestive tract of animals. Chelates are stable, electrically neutral complexes, which protect trace minerals from chemical reactions during digestion that would render the mineral unavailable to the animal. When inorganic mineral compounds, typically in oxide or sulfide form, are released and ionized in the stomach’s low pH, the electrically charged forms of the minerals are able to react with other products of digestion. Com-plexes with naturally occurring organic ligands must form if absorption is to occur. However, the formation of insoluble, unavailable substances may also result, espe-cially in the small intestine, when pancreatic bicarbonate restores a higher, more neutral pH. Added minerals pre- complexes with organic ligands thus are used to increase bioavailability and uptake. The chelated mineral reaches
the plasma intact and separates at the site of action.
3.2. Rumen Fluid Parameters
Resulted of (Table 3) indicated that rumen liquor pH
values did not significantly differ among treatments. Or-ganic Zn sources tested in the present study showed dif-ferent degrees of acidity. When saturated solutions were prepared in deionized H2O, the pH of the solutions
de-creased. The consistency of pH readings can be used as one criterion to test product uniformity from batch to batch [36]. The amount of organic Zn that could be dis-solved in deionized H2O varied form source to source in
the present experiments, indicating different degrees of solubility. The NH3-N concentrations were significantly
(P < 0.05) higher in THF and THS rations than other
rations.
Sheep in the ZnMet treatments had higher (P < 0.05)
total VFA concentrations than those in the ZnSO4.
Al-ternatively, Zn from ZnSO4 may have been taken up by
ruminal microorganisms to a greater extent, and this could explain the lower Ruminal soluble Zn concentra-tions in steers fed ZnSO4. Steers supplemented with Zn
proteinate [5] or a Zn polysaccharide [37] also had higher ruminal soluble Zn concentrations than those receiving inorganic Zn oxide. The higher total VFA concentrations observed in steers supplemented with ZnMet or ZnGly compared to animals fed the ZnSO4 treatments could
relate to a slower rate of feed Consumption or reduced rate of ruminal digestion. Extremely high concentrations (1142 mg Zn per kg) of ZnSO4 have been shown to affect
ruminal protozoa numbers and degradation of feed pro-tein [38]. High dietary concentrations (250 - 1142 mg Zn per kg) of organic Zn have also increased molar propor-tion of propionate in previous studies [38,39]. The effect of more physiological additions of Zn on ruminal fer-mentation has received little attention.
Data of rumen volumes, rates of outflow and microbial protein synthesis are presented in (Table 3). The differ-
[image:4.595.308.536.606.701.2]ences among groups were significant. The ZnMet rations
Table 3. Rumen liquor parameters, total bacteria counts and microbial nitrogen synthesis of experimental rations (mean ± SE).
Item 25 mg Zn (ZnSO4) 15 mg Zn (ZnMet) 25 mg Zn (ZnMet)
PH 6.67 ± 0.12 6.60 ± 0.09 6.58 ± 0.16
NH3-N (mg/100 ml) 11.63 ± 0.42a 9.56 ± 0.26b 9.45 ± 0.17b Total VFA’s
(meq./100 ml) 8.57 ± 0.32b 9.22 ± 0.41a 9.17 ± 0.29a Rumen volumes (L) 2.94 ± 0.24b 3.73 ± 0.17a 3.66 ± 0.21a Rates of outflow (%hr) 6.41 ± 0.52a 5.01 ± 0.18b 5.47 ± 0.28b
Microbial nitrogen
synthesis (g/h/d) 23.66 ± 0.48b 31.39 ± 0.33a 29.65 ± 0.17a a,bMeans within rows with different superscript are significantly differ (
were higher (P < 0.05) values of rumen volumes and
microbial protein synthesis than inorganic Zn, while the both of organic Zn (ZnMet) were the lower (P < 0.05)
values of rates of outflow than inorganic Zn. Ruminal microbial protein synthesis depends onsupply of ade-quate amounts and type of carbohydrate (CHO) as an energy sourcefor the synthesis of peptide bonds [40]. Synthetic amino acids or amino acids precursor (Methyl Hydroxy Analogue: MHA) are also used as ligands in chelating trace minerals. The definitive advantage of MHA is that its is non-degraded in rumen as there is no Nitrogen atom in its chemical structure and hence rumen microbes do not recognize it as a source for microbial protein synthesis escapes the rumen degradation. More-over, the molecular size of MHA chelated is below 400 Dalton which facilitated its efficient absorption through intestine.
3.3. Milk Yields and Milk Composition
Data concerning milk yield and its composition are pre-sented in (Table 4). The milk yield and fat corrected
milk (FCM) were significantly increased (P < 0.05) for
both the ZnMet rations compared with inorganic Zn ra-tion. The average daily milk yield were increased by 12.32% and 9.78% in 15 mg Zn (ZnMet) ration and 25 mg Zn (ZnMet) ration than 25 mg Zn (ZnSO4) ration,
[image:5.595.311.536.478.582.2]respectively. However, improving of nutrients composi-tion, its digestibility and the feeding values of both the ZnMet rations were reflect on the more % FCM pro-duced by ewes fed that ration which had about 24.20% and 21.11% more 4% FCM than the inorganic Zn ration. In addition to about 26.06% and 31.33% more protein and fat produced, respectively. This agrees with the re-sults of [41-42]. Zinc supplement had positive influence on ewe milk production [41]. Similar results have been reported previously when dairy cows were supplemented with chelated minerals [42]. But contrast to the results [2,
Table 4. Milk yields and milk composition of lactating ewes fed on experimental rations (mean ± SE).
Item 25 mg Zn (ZnSO4) 15 mg Zn (ZnMet) 25 mg Zn (ZnMet) Milk yields, g/d 431.56 ± 21.44b 484.73 ± 15.72a 473.75 ± 11.06a
4% FCM* 515.52 ± 11.65b 640.29 ± 20.18a 624.35 ± 17.62a Fat, g/d 22.66 ± 0.26b 29.76 ± 0.17a 28.99 ± 0.29a Protein, g/d 20.11 ± 0.33b 25.35 ± 0.13a 25.16 ± 0.12a
Milk composition (%).
Total solids 15.24 ± 0.42 15.11 ± 0.23 15.26 ± 0.33 Solids not fat 9.99 ± 0.29a 8.97 ± 0.31b 9.14 ± 0.18ab
Fat 5.25 ± 0.13b 6.14 ± 0.09a 6.12 ± 0.11a
Protein 4.66 ± 0.23b 5.23 ± 0.11a 5.31 ± 0.07a Lactose 4.29 ± 0.27a 2.77 ± 0.13b 2.86 ± 0.18b
Ash 1.04 ± 0.02 0.97 ± 0.01 0.97 ± 0.02
a,bMeans within rows with different superscript are significantly differ ( P < 0.05); *4% FCM was calculated as: 0.4 × milk yield (kg) + 15 × fat yield (kg) Overmann and Fanmann, 1926.
43,44], reported no increase in milk yield from feeding organic trace mineral complexes.
3.4. Blood Biochemical and Serum Constituents
The average values of some blood constituents in the blood of ewes consuming the different experimental ra-tions are presented in (Table 5). No significant
differ-ences were observed among groups concerning the entire blood constituent. Moreover, they were within the nor-mal average as described by [45]. [46] reported that Zn plays a clear role in the synthesis, storage and secretion of insulin in human as well as conformational integrity of insulin in the hexameric form. Glucagon led to a pro-nounced decrease in cytosolic Zn2+. Glucagon and Zn
stimulated glycogenolysis by increasing the phosphory-lation of glycogen phosphorylase but acted oppositely on glycolysis. Zn overcame the inactivation of pyruvate kinase by glucagon without changing the hormone-in- duced protein phosphorylation [47,48]. Zinc inhibits the accumulation of glucose in rat intestinal segments in vi-tro [48]. The uptake of glucose by brush border mem-brane vesicles from pig small intestinal [49].
3.5. Antioxidant Enzyme Activities
Data of antioxidants activity in blood of lactating ewes during experimental period were showed in (Table 6).
The activity of GSH, GSH-Px, SOD and MDA increased gradually with the ZnMet. Results of isoenzyme patterns suggested that at least four isoenzyme bands are detected
Table 5. Blood serum parameters of lactating cows fed ex-perimental ration (mean ± SE).
Item 25 mg Zn (ZnSO4) 15 mg Zn (ZnMet) 25 mg Zn (ZnMet) Glucose mg/dl 82.79 ± 6.34 80.77 ± 3.41 81.53 ± 4.66 Cholesterol mg/dl 93.75 ± 2.74 92.55 ± 0.65 92.79 ± 0.85
TP g/dl 8.12 ± 0.43 8.25 ± 0.22 8.05 ± 0.31
Albumin g/dl 3.67 ± 0.11a 3.83 ± 0.18a 3.33 ± 0.09b Globulin g/dl 4.45 ± 0.16 4.42 ± 0.11 4.72 ± 0.15 Urea mg/dl 40.65 ± 0.37a 37.65 ± 0.55b 36.76 ±0.24b Creatinine, mg/dl 0.94 ± 0.04 0.93 ± 0.07 0.94 ± 0.03
AST U/L 36.77 ± 0.38 37.76 ± 0.22 36.94 ± 0.21
ALT U/L 20.66 ± 0.18 19.86 ± 0.14 19.54 ± 0.19
[image:5.595.58.285.567.691.2]a,bMeans within rows with different superscript are significantly differ ( P < 0.05).
Table 6. Antioxidants content in blood of lactating ewes during experimental period (mean ± SE).
Items 25 mg Zn (ZnSO4) 15 mg Zn (ZnMet) 25 mg Zn (ZnMet) GSH (mg/dl) 24.33 ± 0.57b 27.89 ± 0.52a 27.28 ± 0.95a GSH-Px (µ/g Hb) 69.328 ± 1.57b 75.55 ± 1.44a 74.77 ± 0.86a SOD (µ/ml) 25.74 ± 0.46b 28.95 ± 0.55a 27.43 ± 0.34a MDA (µmol/ml) 2.13 ± 0.06b 2.66 ± 0.08a 2.42 ± 0.05a a,bMeans within rows with different superscript are significantly differ (
[image:5.595.305.538.640.699.2]and a novel isoenzyme is found in the cotyledons (III), hypocotyls (III) and radicles (II) at the 15 mg Zn as ZnMet. These isoenzymes show different staining inten-sity with the ZnMet and the staining densities of SOD isoenzyme were consistent with the changes of the ac-tivities assayed in solutions. SOD play an important role in detoxification processes by catalyzing the conversion of free 2 to O2 and H2O2 and is associated with stress
situations including zinc stress [50]. The mechanism of reactions catalyzed by SOD consists in the reduction and oxidation of metal ions which are present in the active centre of this enzyme (Zn, Cu). As a result of these reac-tions, hydrogen peroxide (H2O2) is produced. The
bio-synthesis of SOD is under close control. Unfortunately, so far this process has been described only for bacterial cells [51]. But it is known that the inductor of the synthe-sis is a product of molecular oxygen (O2) reduction and
that this process is regulated by iron ions. It has been noted that the level of iron ions in the serum increases in conditions of exposure to lead. Even a small increase in the concentration of iron ions leads to a sudden produc-tion of reactive oxygen species (ROS), for example in the Fenton-like reaction [52]. The mechanism of catalysis influenced by SOD suggests that this enzyme is an in-complete antioxidant which protects from the action of one free oxygen radical O2. Biologically the action of
SOD through H2O2 is connected with the action of CAT.
The function of CAT is removal of H2O2 formed as a
result of the action of the oxygen dehydrogenates. Available literature data have shown that H2O2 inhibits
the activity of SOD, while O2 inhibits the action of CAT
(Kulikowska-Karpińska and Moniuszko-Jakoniuk, 2001). In plants, environmental adversity often leads to the in-creased generation of reduced oxygen species and con-sequently, SOD has been proposed to be important in plant stress tolerance [12]. In the present study, SOD activity in the cotyledons are significant higher than those of the hypocotyls and radicles at the same zinc level, suggesting that the cotyledons are most sensitive, when exposed to zinc toxicity. Isoform enzymes of Page analysis showed that the levels of SOD transcripts are induced in response to zinc stress; however, they differ in different tissues and zinc concentrations. These results might suggest that a hierarchy of regulatory events act at the transcription of SOD genes. Pioneer studies had shown a general stimulation of constitutive SODs and the induction of specific SOD isoenzymes in different plant species (Prasad et al., 1999). Enhanced SOD activity
could potentially increase oxidative stress due to in-creased production of H2O2. Based on the above results,
the increased SOD activities and their isoenzymes may play an important role in the defensive mechanisms of plant seedling against zinc toxicity. POD, along with
SOD and CAT, are redox metalloenzymes involved in cell defense against oxidative stress. Plant PODs, which are encoded by small or large multigenic families, are involved in several important physiological and devel-opmental processes [53]. POD can also be considered useful markers for environmental stresses since their ac-tivity is affected by heavy metal, salt and other environ-ment conditions.
O
REFERENCES
[1] B. L. Vallce, “Biochemistry, Physiology and Pathology of Zinc,” Physiological Reviews, Vol. 39, No. 3, 1959, pp.
443-490.
[2] J. K. Millerand and R. G. Cragle, “Gastrointestinal Sites of Absorption and Endogenous Secretion of Zinc in Dairy Cattle,” Journal of Dairy Science, Vol. 48, No. 3, 1965,
pp. 370- 373.
doi:10.3168/jds.S0022-0302(65)88231-5
[3] J. W. Spears, “Organic Trace Minerals in Ruminant Nu-trition,” Animal Feed Science and Technology, Vol. 58,
No. 1-2, 1996, pp. 151-163. doi:10.1016/0377-8401(95)00881-0
[4] Association of American Feed Control Officials, “Official Publication,” Oxford, 2000.
[5] J. W. Spears and E. B. Kegley, “Effect of Zinc Source (Zinc Oxide vs Zinc Proteinate) and Level on Perform-ance, Carcass Characteristics, and Immune Response of Growing and Finishing Steers,” Journal of Animal Sci-ence, Vol. 80, No. 10, 2002, pp. 2747-2752.
[6] J. Kessler, I. Morel, P. A. Dufey, A. Gutzwiller, A. Stern and H. Geyer, “Effect of Organic Zinc Sources on Per-formance, Zinc Status and Carcass Meat and Claw Qual-ity in Fattening Bulls,” Livestock Production Science, Vol.
81, No. 2, 2003, pp. 161-171. doi:10.1016/S0301-6226(02)00262-2
[7] C. L. Wrightand and J. W. Spears, “Effect of Zinc Source and Dietary Level on Zinc Metabolism in Holstein Calves,” Journal of Dairy Science, Vol. 87, No. 4, 2004, pp. 1085-1091.
doi:10.3168/jds.S0022-0302(04)73254-3
[8] C. L. Wright, J. W. Spears and K. E. Webb, “Uptake of Zinc from Zinc Sulfate and Zinc Proteinate by Ovine Ruminal and Omasal Epithelia,” Journal of Animal Sci-ence, Vol. 86, No. 6, 2008, pp. 1357-1363.
doi:10.2527/jas.2006-650
[9] J. W. Spears, “Zinc Methionine for Ruminants: Relative Bioavailability of Zinc in Lambs and Effects of Growth and Performance of Growing Heifers,” Journal of Animal Science, Vol. 67, No. 3, 1989, pp. 835-843.
[10] K. J. Wedekind, A. E. Hortin and D. H. Baker, “Method-ology for Assessing Zinc Bioavailability: Efficacy Esti-mates for Zinc-Methionine, Zinc Sulfate, and Zinc Oxide.
Journal of Animal Science, Vol. 70, No. 1, 1992, pp. 178-
187.
Minerals, and Vitamins,” Academic Press, San Diego, CA, 1995.
[12] R. Mittler, S. Vanderauwera, M. Gollary and F. van Breusegem, “Reactive Oxygen Gene Network of Plants,”
Trends in Plant Science, Vol. 9, No. 10, 2004, pp. 490-498.
doi:10.1016/j.tplants.2004.08.009
[13] NRC, “Nutrient Requirements of Sheep,” Sixth Revised Edition, National Academy Press, Washington, DC, 1985, pp. 45-53.
[14] AOAC, “Official Methods of Analysis,” 15th Edition, Association of Analytical Chemists, Washington, DC, 1990.
[15] J. B. Henry and S. D. Todd, “Clinical Diagnosis and Measurement by Laboratory Methods,” 16th Edition, W. B. Saunders, Phliadephia, 1974, p. 260.
[16] B. T. Doumas, W. A. Waston and H. G. Biggs, “Albumin Standards and the Measurements of Serum Albumin with Bromocresol Green,” Clinica Chimica Acta, Vol. 31, No.
1, 1977, pp. 87-96.
doi:10.1016/0009-8981(71)90365-2
[17] W. R. Faulkner and J. W. King, “Fundamentals of Clini-cal Chemistry,” 2nd Edition, Saunders, Philadelphia, 1976, pp. 994-998.
[18] S. Reitman and S. A. Frankel, “Colorimetric Method of Determination of Serum Glutamic Oxaloacetic and Glu-tamic Pyrovic Transaminase,” American Journal of Clini- cal Pathology, Vol. 28, 1957, pp. 56-63.
[19] A. C. I. Warner, “Production of Volatile Fatty Acids in the Rumen Methods of Measurement,” Nutrition Ab-stracts & Reviews, Vol. 34, 1964, pp. 339-352.
[20] P. J. van Soest, J. B. Robertson and B. A. Lewis, “Methods for Dietary Fiber, Neutral Detergent Fiber, and Nonstarch Polysaccharides in Relation to Animal Nutri-tion,” Journal of Dairy Science, Vol. 74, No. 10, 1991, pp.
3583-3597. doi:10.3168/jds.S0022-0302(91)78551-2 [21] M. Difco, “Dehydrated Culture Media Reagents for
Mi-crobiology,” 10th Edition, Difco Laboratories Incorpo-rated Detroit, Michigan, 1984, p. 689.
[22] K. H. El-Shazly, A. Ahmed, M. A. Naga and B. E. A. Borhami, “A Colorimetric Techniqe Using Chromium Ethylene Diamine Tetraacetate for Measuring Rumen Volume,” The Journal of Agricultural Science, Vol. 87,
No. 2, 1976, pp. 369-373. doi:10.1017/S0021859600027672
[23] Y. Sun, L. W. Oberley and L. Ying, “A Simple Method for Clinical Assay of Superoxide Dismutase,” Clinical Chemistry, Vol. 34, No. 3, 1988, pp. 497-500.
[24] D. E. Paglia and W. N. Valentine, “Studies on the Quan-titative and Qualitative Characterization of Erythrocyte Glutathione Peroxidase,” Journal of Laboratory and Cli- nical Medicine, Vol. 70, 1967, pp. 158-170.
[25] H. Esterbauer and K. H. Cheeseman, “Determination of Aldehydic Lipid Peroxidation Products: Malonaldehyde and 4-Hydroxynonenal,” Methods Enzymol, Vol. 186, 1990, pp. 407-421. doi:10.1016/0076-6879(90)86134-H
[26] SAS Institute Inc., “SAS User’s Guide,” SAS Institute Inc., Cary, NC, 1999.
[27] N. K. Chirase, D. P. Hutchenson and G. B. Thompson, “Feed Intake, Rectal Temperature, and Serum Mineral Concentration of Feedlot Cattle Fed Zinc Oxide or Zinc Methionine and Challenged with IBR Virus,” Journal of Animal Science, Vol. 69, 1991, pp. 4137-4145.
[28] G. P. Lardy, M. S. Kerley and J. A. Paterson, “Retention of Chelated Metal Proteinates by Lambs,” Journal of Animal Science, Vol. 70, 1992, p. 314.
[29] A. J. Heinricks and H. R. Conrad, “Rumen Solubility and Breakdown Products of Metal Proteinate Compounds,”
Journal of Dairy Science, Vol. 66, 1983, p. 147.
[30] L. Vrzgula, A. A. Alijev, W. Barej, P. Bartko, J. Bouda, R. Dvořák and P. Garbašanski, “Disorders of Substance Metabolism of Farm Animals and Prevention Thereof (in Slovak),” 2nd Edition, Bratislava, Príroda, 1990, p. 503 [31] H. D. Ashmead, D. J. Graff and H. H. Ashmead, “A
Sec-ondary Intestinal Pathway for Absorption of Dipeptide- Like Amino Acid Chelates,” Spring field, IL, 1985, pp. 113-123
[32] T. E. Engle, C. F. Nockels, C. V. Kimberling, D. L. We-aber and A. B. Johnson, “Zinc Repletion with Organic or Inorganic Forms of Zinc and Protein Turnover in Mar-ginally Zinc-Deficient Calves,” Journal of Animal Sci-ence, Vol. 75, 1998, pp. 3074-3081.
[33] C. F. Nockels, “Micornutrients and the Immune Re-sponse,” Montana Nutrition Conference Proceedings,
Bozeman, Montana, 1994, 3.1.
[34] M. T. Kidd, P. R. Ferket and M. A. Qureshi, “Zinc Me-tabolism with Special Reference to Its Role in Immunity,”
World’s Poultry Science Journal, Vol. 52, 1996, pp.
309-324.
doi:10.1079/WPS19960022
[35] J. C. Matthews and K. E. Webb Jr, “Absorption of L-Carnosine, L-Methionine, and L-Methionylglycine by Isolated Sheep Ruminal and Omasal Epithelium,” Journal of Animal Science, Vol. 73, 1995, pp. 3464-3475.
[36] F. T. Gressley, “Zinc, Copper, Manganese, and Selenium in Dairy Cattle Rations,” Proceedings of the 7th Annual Mid-Atlantic Nutrition Conference, University of Mary-land, College Park, 2009.
[37] K. D. Wennedy, W. M. Craig and L. L. Southern, “Ru-minal Distribution of Zinc in Steers Fed a Polysaccha-ride-Zinc Complex or Zinc Oxide,” Journal of Animal Science, Vol. 71, No. 5, 1993, pp. 1281-1287.
[38] M. A. Froetschel, A. C. Martin, H. E. Amos and J. J. Ev-ans, “Effects of Zinc Sulfate Concentration and Feeding Frequency on Ruminal Protozoal Numbers, Fermentation Patterns and Amino Acid Passage in Steers,” Journal of Animal Science, Vol. 68, No. 9, 1990, pp. 2874-2884.
[39] H. M. Arelovich, F. N. Owens, G. W. Horn and J. A. Vizcarra, “Effects of Supplemental Zinc and Manganese on Ruminal Fermentation, Forage Intake, and Digestibil-ity by Cattle Fed Prairie Hay and Urea,” Journal of Ani-mal Science, Vol. 78, No. 11, 2000, pp. 2972-2979.
Me-tabolism in the Rumen,” Journal of Dairy Science, Vol.
88, 2005, pp. E9-E21.
doi:10.3168/jds.S0022-0302(05)73133-7
[41] P. G. Hatfield, G. D. Snowder, W. A. J. Head, H. A. Glimp, R. H. Stobart and T. Besser, “Production by Ewes Rearing Single or Twin Lambs: Effects of Dietary Crude Protein Percentage and Supplemental Zinc Methionine,”
Journal of Animal Science, Vol. 73, No. 5, 1995, pp.
1227-1238.
[42] A. Formigoni, P. Parisini and F. Corradi, “The Use of Amino Acid Chelates in High Production Milk Cows,” In: H. D. Ashmead, Ed., The Roles of Amino Acid Chelates in Animal Nutrition, Noyes, Park Ridge, NJ, 1993, pp.
170-186.
[43] P. G. Hatfield, C. K. Swenson, R. W. Kott, R. P. An-sotegui, N. J. Roth and B. L. Robinson, “Zinc and Copper Status in Ewes Supplemented with Sulfate- and Amino acid-Complexed Forms of Zinc and Copper,” Journal of Animal Science, Vol. 79, No. 1, 2001, pp. 261-266. [44] M. H. Campbell, J. K. M. iller and F. N. Schrick, “Effect
of Additional Cobalt, Copper, Manganese and Zinc on Reproduction and Milk Yield of Lacting Dairy Cows Re-ceiving Bovine Somatotropin,” Journal of Dairy Science,
Vol. 82, No. 5, 1999, pp. 1019-1025. doi:10.3168/jds.S0022-0302(99)75322-1
[45] M. S. Stanek, W. FlorekRydzik and I. Rusiecka, “Effect of Energy Feeds in Diets for Sheep on Nutrient Digesti-bility and Rumen Digestion Process,” Acta Academiae Agriculture ac Technicae Olstenesis, Zootechnica, Vol. 37, 1992, pp. 3-11.
[46] A. B. Chausmer, “Zinc, Insulin and Diabetes,” Journal of
the American College of Nutrition, Vol. 17, No. 2, pp.
109-115.
[47] L. A. Brand and J. Kleineke, “Intracellular Zinc Move-ment and Its Effect on the Carbohydrate Metabolism of Isolated Rat Hepatocytes,” Journal of Biological Chemis-try, Vol. 271, No. 4, 1996, pp. 1941-1949.
doi:10.1074/jbc.271.4.1941
[48] V. Lyall, R. Nath and A. Mahmood, “Inhibition of D- Glucose Uptake by Zinc in Rat Intestine,” Biochemical Medicine, Vol. 22, No. 2, 1979, pp. 192-197.
doi:10.1016/0006-2944(79)90005-X
[49] D. W. Watkins, C. Chenu and P. Ripoche, “Zinc Inhibi-tion of Glucose Uptake in Brush-Border Membrane Vesi-ches from Pig Small Intestine,” Archiv European Journal of Physiology, Vol. 415, No. 2, 1989, pp. 165-171.
doi:10.1007/BF00370588
[50] R. J. Henry, D. C. Cannon and J. W. Winkelman, “Clini-cal Chemistry: Princeples and Techniques,” 11th Edition, Happer and Row Publishers, 1974, p. 1629.
[51] A. E. Liczmanska and T. Toksycznosc, “Mechanizmy Obronne,” Postepy Biochemii, Vol. 4, 1988, p. 293.
[52] E. Kulikowska-Karpińska and J. Moniuszko-Jakoniuk, “Lead and Zinc Influence on Antioxidant Enzyme Activ-ity and Malondialdehyde Concentrations,” Polish Journal of Environmental Studies, Vol. 10, No. 3, 2001, pp. 161-
165.
[53] P. G. Hatfield, G. D. Snowder and H. A. Glimp, “The Effects of Chelated Zinc Methionine on Feedlot Lamb Performance, Cost of Gain, and Carcass Characteristics,”