University of Warwick institutional repository: http://go.warwick.ac.uk/wrap
A Thesis Submitted for the Degree of PhD at the University of Warwick
http://go.warwick.ac.uk/wrap/57146
This thesis is made available online and is protected by original copyright.
Please scroll down to view the document itself.
AUTHOR:Belma Rami´c-Brki´c DEGREE: Ph.D.
TITLE:The Influence of Olfaction on the Perception of High-Fidelity Com-puter Graphics
DATE OF DEPOSIT: . . . .
I agree that this thesis shall be available in accordance with the regulations governing the University of Warwick theses.
I agree that the summary of this thesis may be submitted for publication.
Iagreethat the thesis may be photocopied (single copies for study purposes only).
Theses with no restriction on photocopying will also be made available to the British Library for microfilming. The British Library may supply copies to individuals or libraries. subject to a statement from them that the copy is supplied for non-publishing purposes. All copies supplied by the British Library will carry the following statement:
“Attention is drawn to the fact that the copyright of this thesis rests with its author. This copy of the thesis has been supplied on the condition that anyone who consults it is understood to recognise that its copyright rests with its author and that no quotation from the thesis and no information derived from it may be published without the author’s written consent.”
AUTHOR’S SIGNATURE: . . . . USER’S DECLARATION
1. I undertake not to quote or make use of any information from this thesis without making acknowledgement to the author.
2. I further undertake to allow no-one else to use this thesis while it is in my care.
DATE SIGNATURE ADDRESS
The Influence of Olfaction on the
Perception of High-Fidelity Computer
Graphics
by
Belma Rami´
c-Brki´
c
Thesis
Submitted to the University of Warwick for the degree of
Doctor of Philosophy
Contents
Acknowledgments ix
Declaration xi
List of Publications xii
Abstract xiv
Chapter 1 Introduction 1
1.1 Motivation . . . 1
1.2 The Research Problem and its Importance . . . 2
1.3 Aims and Objectives of the Research . . . 3
1.4 Thesis Outline . . . 4
Chapter 2 Human Vision 6 2.1 The Human Visual System . . . 6
2.1.1 The Retina . . . 8
2.2 Visual Perception . . . 10
2.2.1 Spatial Resolution . . . 11
2.2.2 Temporal Sensitivity . . . 12
2.2.3 Retinal Inhomegenity . . . 12
2.3 Attention and Perception . . . 12
2.3.1 Attention: Automatic and Voluntary Control . . . 13
2.3.2 Attentional Limitations . . . 15
Chapter 3 Olfaction - Sense of Smell 17 3.1 The Human Olfactory System . . . 18
3.2 Odour Perception and Physiological Response . . . 22
3.4 Olfactory Displays and Electronic Noses . . . 27
3.5 Multi-modal Virtual Environments . . . 30
3.5.1 Research on olfaction across different fields . . . 31
Chapter 4 Preliminary Investigation of Olfactory Influence on Per-ception 37 4.1 Introduction . . . 37
4.2 Experimental Methodology . . . 38
4.2.1 Hypothesis . . . 38
4.2.2 Participants . . . 39
4.2.3 Design . . . 40
4.2.4 Equipment and Materials . . . 41
4.2.5 Procedure . . . 45
4.3 Results . . . 45
4.4 Summary . . . 47
Chapter 5 Cross-Modal Effects of Smell on the Real-Time Render-ing of Grass 48 5.1 Introduction . . . 48
5.2 Hypothesis . . . 50
5.3 Participants . . . 50
5.4 Design . . . 51
5.5 Equipment and Materials . . . 52
5.6 Procedure . . . 54
5.7 Results . . . 55
5.8 Summary . . . 58
Chapter 6 Adaption and Task Performance in the Presence of Smell: Its Effects on Perception of Visual Quality 59 6.1 Introduction . . . 59
6.2 Experiment - Smell Adaptation . . . 60
6.2.1 Design . . . 60
6.2.2 Materials . . . 62
6.2.3 Participants . . . 63
6.2.4 Procedure . . . 64
6.3 Experiment - Task Performance in the Presence of Smell . . . 73
6.3.1 Design . . . 73
6.3.2 Materials . . . 74
6.3.3 Participants . . . 74
6.3.4 Procedure . . . 76
6.3.5 Results . . . 76
6.4 Discussion . . . 80
6.5 Summary . . . 85
Chapter 7 Towards High-fidelity Multi-sensory Virtual Environ-ments 87 7.1 Introduction . . . 87
7.2 The Experiments . . . 87
7.2.1 Design . . . 88
7.2.2 Materials . . . 88
7.2.3 Procedure . . . 91
7.2.4 The Pilot Study . . . 91
7.2.4.1 The Smell . . . 92
7.2.4.2 The Ambient Temperature . . . 95
7.2.5 Experiment 1 . . . 97
7.2.5.1 Results . . . 100
7.2.6 Experiment 2 . . . 104
7.2.6.1 Results . . . 105
7.2.7 Experiment 3 . . . 107
7.2.7.1 Results . . . 109
7.3 Summary . . . 111
Chapter 8 Discussion of Results and Findings 113 Chapter 9 Conclusions and Future Work 120 9.1 Thesis Contribution . . . 121
9.2 Future Work . . . 123
Appendix A Consent form used in all experiments 146
Appendix C Experiment on smell adaptation 148
Appendix D Experiment on task performance in the presence of
List of Figures
2.1 Top view of the brain showing the three main processing parts of the
human visual system [148]. . . 7
2.2 Sectional view of the eye [94]. . . 8
2.3 The view of the retina [94]. . . 9
2.4 Spectral sensitivity of cones [165]. . . 10
2.5 Different concentration of photoreceptor cells in the retina [165]. . . 11
2.6 Single frames from the animation used in the experiment by [167]. . 15
3.1 The olfactory region [99]. . . 19
3.2 The olfactory epithelium [99]. . . 20
3.3 Henning’s smell prism [142]. . . 23
3.4 The comparison between human and electronic noses [40]. . . 28
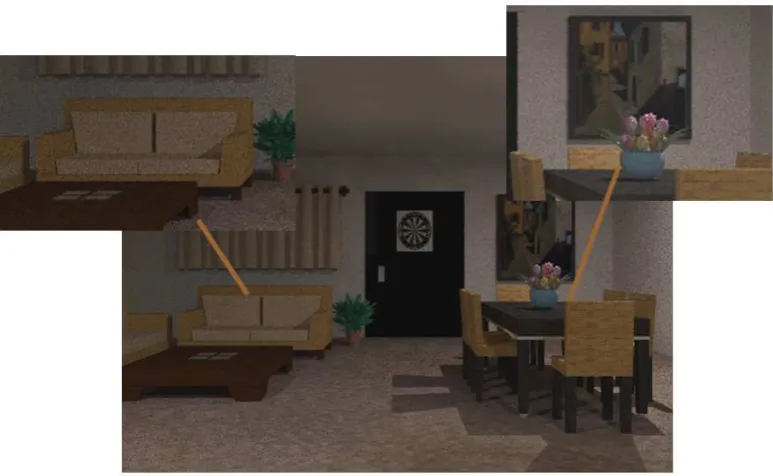
4.1 Our Selective Rendering approach. The smell emitting object, in this case the flowers (close up right), are rendered at a higher quality, 16 rays per pixel, while the remainder of the scene is rendered at a lower quality, 9 rays per pixel, for example the couch (close up left). . . 39
4.2 The conditions tested. . . 41
4.3 High quality image used in the experiment. . . 42
4.4 Selectively rendered image. . . 43
4.5 Image rendered at low quality. . . 44
4.6 Close up of scene details rendered at high quality, 16 rays per pixel, and low quality, 9 rays per pixel respectively. . . 44
5.1 Real-time rendered grass blades . . . 49
5.2 The conditions tested. . . 51
5.3 Single frame from animation sequence rendered in high quality. . . . 53
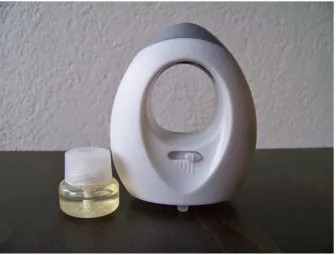
5.5 An image of a perfume atomizer. . . 54
5.6 Results for “No smell” condition. . . 56
5.7 Results for “Smell” condition. . . 57
5.8 Comparison of the results for the two conditions. . . 58
6.1 Different conditions tested in the experiment. . . 61
6.2 Single frames (940, 1770, 2200) from the HQ animation used in the experiment. . . 61
6.3 VQ animation frames rendered at different number of rays-per-pixel. 63 6.4 Demographic data. . . 64
6.5 Complete results for all three conditions. The horizontal axis repre-sents the rpp/time variable and the vertical axis the percentage of people who noticed the difference at a certain number of rpp/time interval. The lower image represents the intersection points. . . 66
6.6 The comparison of results across different conditions and rpp/time intervals. . . 67
6.7 Shapiro-Wilk test summary acquired via XLSTAT add-in for Mi-crosoft Excel. . . 70
6.8 Q-Q Plot acquired via XLSTAT add-in for Microsoft Excel. . . 70
6.9 P-P Plot acquired via XLSTAT add-in for Microsoft Excel. . . 73
6.10 Image (middle) and instructions (top and bottom) used in the exper-iment. . . 75
6.11 Demographic data. . . 76
6.12 The complete set of results carried out as explained in section 6.3. . 77
6.13 The results of the experiment for the tested conditions (“no smell” and “smell”) for the question: “Did you notice any smell when you entered the experimental environment?” . . . 78
6.14 The results of the experiment for the tested conditions (“no smell” and “smell”) for the question: “Did you notice any smell when you left the experimental environment?” . . . 78
6.15 The average percentage of the number of balls participants counted during different time periods. . . 81
7.1 Single frame(125) rendered at HQ - 16rpp (top), LQ - 1rpp (middle)
and VQ - 5rpp (bottom). . . 90
7.2 Demographic data. . . 92
7.3 Images used in the experiment: Checkerboard (top left), Corridor (top right), Kalabsha (bottom left), Library (bottom right). . . 93
7.4 The example of five-slide sequence used in the experiment. . . 94
7.5 The results of pilot study. . . 95
7.6 The conditions tested in Experiment 1. . . 98
7.7 Single frames (2, 110, 240) from the HQ animation used in the ex-periment. . . 99
7.8 Close-up view of the differences between HQ, VQ and LQ images. . 100
7.9 An example of the printed frames with users’ responses of where they noticed the quality difference marked with red crosses. . . 101
7.10 Results of Experiment 1 for HQ vs LQ. . . 102
7.11 Results of Experiment 1 for HQ vs HQ. . . 102
7.12 Results of Experiment 1 for HQ vs VQ. . . 103
7.13 Summary of the results of Experiment 1. . . 103
7.14 Conditions tested in Experiment 2. . . 104
7.15 Frame 110 from VQ animation rendered in range from 16-5-16rpp. . 106
7.16 Different frames from the VQ animation rendered using different num-ber of rays-per-pixel. . . 106
7.17 Pairwise comparisons using t-test. . . 107
7.18 Results of Experiment 2 with the five conditions tested. . . 108
7.19 Conditions tested in Experiment 3. . . 109
7.20 Top: Single frame (110) from SQ (5-1rpp) animation rendered using saliency maps. Bottom: Saliency map of the rendered frame from the animation. . . 110
List of Tables
4.1 Rendering times for different image qualities used in the study . . . 45
4.2 Results for HQ vs LQ . . . 46
4.3 Results for HQ vs HQ . . . 46
4.4 Results for HQ vs SQ . . . 46
5.1 Results for HQ vs LQ . . . 57
6.1 Rendering times (per frame) . . . 62
6.2 Ranking of data when assuming no difference between conditions . . 67
6.3 Ranking of data when assuming difference between conditions . . . . 70
6.4 The percentage of participants who noticed the difference at a quality of a certain number of rays-per-pixel across different conditions. . . . 82
7.1 Rendering times (per frame) . . . 89
7.2 The rendering times for all scenes presented in seconds . . . 93
7.3 “No smell” condition. Chi-Square Analysis (df=1; critical value 3.841 at 0.05 level of significance). Significant results are written in bold. . 96
7.4 “Strong perfume” condition. Chi-Square Analysis (df=1; critical value 3.841 at 0.05 level of significance). Significant results are writ-ten in bold. . . 96
7.5 “Mild perfume” condition. Chi-Square Analysis (df=1; critical value 3.841 at 0.05 level of significance). Significant results are written in bold. . . 97
7.6 Detailed description of labels used in Figure 7.17 . . . 107
7.7 Results of Experiment 2 . . . 108
7.8 Tabular representation of Experiment 3 results . . . 111
Acknowledgments
First of all, I would like to thank my mentor Professor Alan Chalmers for his con-stant encouragement and optimism while doing the thesis, for providing me with this great opportunity in the first place. Thank you for sharing your knowledge and ideas, and allowing me to learn so much. It has been a wonderful experience. I would also like to thank my undergraduate and graduate thesis mentor Professor Selma Rizvi´c, who introduced me to the beautiful field of computer graphics, which led to numerous publications, conferences, travel adventures and most importantly, a lifelong friendship.
Next, I would like to thank all the members of the Visualisation group for making the work such a wonderful and pleasant experience. It has been great working with you. Many thanks to Vedad Hulusi´c, the first Bosnian in Leamington Spa, my friend and colleague who took such good care of me. Special thanks to Anna and Kurt for your friendship, humour, generous help, hospitality, and for taking me with them to see various beautiful parts of England. I would also like to thank my dear friend Aida Sadˇzak, for being such a duˇsica and Elmedin Selmanovi´c, for his hospitality once I moved from Leamington Spa, and offering his help for all minor and major things.
Many thanks to hundreds of people who volunteered in all the studies presented in this thesis and without whom this research would not have been possible.
My parents always supported me throughout my education and my life. I will for-ever be grateful for the love and support you gave me and for the sacrifice you took so that I could be where I am now. Love you both!
In loving memory of my uncle
Declaration
I, Belma Rami´c-Brki´c, hereby declare that the work presented in this thesis is origi-nal and no portion of the work referred to here has been submitted for the award of any other degree or diploma of the university or other institute of higher learning, unless otherwise stated by referencing.
Signature: Date: 17 December 2012
List of Publications
The following have been published as a result of the work contained within this thesis.
Journal papers
• A. Chalmers, K. Debattista and B. Rami´c-Brki´c. Towards high-fidelity multi-sensory virtual environments. The Visual Computer, Volume 25, Number 12, pp 1101-1108, 2010.
Conference papers
• B. Rami´c-Brki´c, A. Chalmers, A. Sadzak, K. Debattista and S. Sultani´c. Ex-ploring multiple modalities for selective rendering of virtual environments. In SCCG ’13: Proceedings of the Spring Conference on Computer Graphics. ACM SIGGRAPH, 2013.
• B. Rami´c-Brki´c and A. Chalmers. Virtual smell: Authentic smell diffusion in virtual environments. In Proceedings of the 7th International Conference on Computer Graphics, Virtual Reality, Visualisation and Interaction in Africa, Franschhoek, South Africa, June 21-23, 2010.
Abstract
The computer graphics industry is constantly demanding more realistic images and animations. However, producing such high quality scenes can take a long time, even days, if rendering on a single PC. One of the approaches that can be used to speed up rendering times is Visual Perception, which exploits the limitations of the Hu-man Visual System, since the viewers of the results will be huHu-mans. Although there is an increasing body of research into how haptics and sound may affect a viewer’s perception in a virtual environment, the influence of smell has been largely ignored. The aim of this thesis is to address this gap and make smell an integral part of multi-modal virtual environments.
In this work, we have performed four major experiments, with a total of 840 par-ticipants. In the experiments we used still images and animations, related and unrelated smells and finally, a multi-modal environment was considered with smell, sound and temperature. Beside this, we also investigated how long it takes for an average person to adapt to smell and what affect there may be when performing a task in the presence of a smell.
Chapter 1
Introduction
1.1
Motivation
Despite the huge progress in the performance of graphics-related hardware in recent years, rendering of high-fidelity images and animations can take a long time. In an attempt to achieve such high-fidelity images in a reasonable time, special techniques may be applied, which employ perceptually based criteria to speed up the compu-tation of the rendering by focusing only on those image features that are readily perceivable under certain viewing conditions [32, 131]. Research has shown how im-ages can be rendered selectively, with the parts a user is attending to rendered in high quality, and the rest in a much lower quality (and thus at a reduced compu-tational cost), without a noticeable perceptual difference to the user. The visual perception thus represents a growing area of importance for research in computer graphics and is increasingly being exploited to improve the quality of displayed im-ages and to reduce the time needed to render them.
fact that our sense of smell, that is olfactory information, provides humans with a key source of environmental information, smell has largely been left out in virtual environments.
In this thesis, we consider the inclusion of this key human sense and show how its presence can provide an increased sense of “realism” in the virtual environment, and be exploited to selectively render visuals.
1.2
The Research Problem and its Importance
The research presented in this thesis investigates the problem of users demanding a high-quality multi-modal virtual environment in order to have a full “real-world experience” and achieve a feeling of being “there”. The computational complexity of accurately simulating real-world environments is such that it is not possible to do this completely on existing computers. Methods, therefore, need to be developed which can reduce the computational requirements, without affecting the quality of the environment that the user perceives. One of the ways to do this is to exploit the limitations of the Human Visual System. It is well known that human eyes do not scan an environment “raster-fashion”. Rather our eyes move in a series of jumps, orsaccades, fixating on parts of the scene within the centre of our gaze, the fovea. Only objects located in the fovea can be perceived in full detail. Outside this region, visual acuity decreases. Therefore, if we know where the fovea is attending to in a scene at any point in time, only this area needs to be rendered at the highest quality. Furthermore, the presence of other sensory stimuli in an environment, or the task a user is undertaking, may also significantly influence how a user views a scene [27]. The goal of this thesis is to create 3D images and animations of the highest quality, while minimizing rendering time by exploiting the olfactory influence on the percep-tion of an object or scene. In particular, we consider whether the presence of smell in a virtual environment may be exploited to significantly reduce the overall quality of the visuals that are delivered without a viewer being aware of a quality difference compared to a high-precision view.
highly salient and therefore automatically attracts the attention of the viewer. If so, then knowing where this SEO is can be exploited to reduce computational time even further more, by rendering where the SEO is in the highest quality (determined above) and the remainder of the scene in an even lower quality without the viewer being aware of this further reduction in the quality of the overall scene rendering. In the real world, humans adapt to smells, that is, they fail to notice a smell after a certain exposure time to it. Smell adaption thus needs to be taken into account to ensure the selective rendering techniques that we propose are still effective once the user has been exposed to a smell for a certain time period. The impact of in-troducing other modalities to the environment in addition to smell, such as sound and temperature is also investigated.
1.3
Aims and Objectives of the Research
The main goal of this thesis is to understand better the influence of smell on users’ perception of virtual environments. In addition, the thesis investigates the influence of single and multi-sensory stimuli on perceived visual quality and considers if these findings could be used for creating new perceptually-adaptive techniques that could deliver high-quality 3D graphics at a much reduced computational cost, when these multi-sensory stimuli are present, without any perceivable difference to the user. The following are the objectives of this thesis:
• Investigate the olfactory influence on a user’s perception of a computer gen-erated image. Can smell be used to attract the user’s attention to a smell emitting object in the scene and therefore allow us selectively to render the smell emitting object (eg. a bowl of flowers) in high-quality, and the rest of the scene at a much lower quality without the user being aware of this quality difference.
• Study the smell adaptation time period. Examine whether adaptation to smell affects the participants’ perception and their performance within an environ-ment when smell is present.
• Examine the influence of smell and other modalities such as sound and tem-perature on the viewer’s perceived quality of a computer generated animation. Identify which combination of these modalities has a strongest impact on the participants.
1.4
Thesis Outline
The remainder of the thesis is organized as follows:
Chapters 2 and 3 provide an overview of previous research on Human Vision, Ol-faction and Multi-Modal environment. These fields represent the background of the work explained in the rest of the thesis.
other senses such as vision, hearing and touch have been incorporated in virtual envi-ronments, there are only a few examples that mention the possible inclusion of smell. The next chapters, Chapters 4 - 7, describe the experiments that were conducted: the design, procedure, participants and different conditions tested. The analysis and discussion of the results are also presented.
Chapter 8 represents a discussion on the results and findings bringing various ele-ments together and providing implications of the work done.
Finally, in Chapter 9, conclusions are given and suggestions made for future work. More specifically, we outline and explain the thesis contribution to the computer-graphics research.
Chapter 2
Human Vision
The manner in which we see the world around us and the quality of that image/view is attributed to the neurology of the human visual system (HVS). Therefore, in this chapter we will focus on those areas of the human visual system that are relevant to our research. We will also point out to some of the known limitations of the human visual system including attentional and perceptual weaknesses which might be used in computer graphics for enhancing olfactory and visual rendering.
2.1
The Human Visual System
The human visual system is composed of three major parts as shown in Figure 2.1. They are responsible for viewing, analyzing, processing and identifying the world that surrounds us. Those parts are:
Figure 2.1: Top view of the brain showing the three main processing parts of the human visual system [148].
The cornea is the front part of the eye. Light enters the lens through the cornea and pupil (Figure 2.2). The amount of light is one of the factors that determine the size of the pupil, which is controlled by two sets of muscles, one for decreasing and one for increasing the opening. The size of the pupil also affects the depth of field and as such is similar to aperture size in photography. The crystalline lens is a transparent structure of the eye that helps refract the light, focusing it on the retina. By changing its shape, the lens helps the eye to focus on an object of interest at various distances and thereby form a sharp real image in a retina. This process is called accommodation [16].
Figure 2.2: Sectional view of the eye [94].
of information received from the retina of the eye occurs. There are two nuclei, one for each eye, from which LGN receives information. Right and left LGN exchange information about opposite visual fields.
3. The visual cortex, which is located in the lower rear of the brain and is re-sponsible for processing all the information that the brain receives [111, 148]. This information is transmitted directly from the eyeballs through the LGN to the visual cortex. This process is known as optic radiation. This area of the brain can be further divided into 5 areas (V1, V2, V3, V4 and MT), of which V1, sometimes called primary visual cortex, is the largest and considered to be the most important.
2.1.1 The Retina
and are located closer to the front of the eye. Photoreceptors are divided into rods and cones and lie near the pigment epithelium and choroid, see Figure 2.3 [111,148].
Figure 2.3: The view of the retina [94].
Figure 2.4: Spectral sensitivity of cones [165].
rods and only 5 million cones in the human retina [157]. The different concentration of rods and cones is shown in Figure 2.5. The number of optic nerves that carries an image through the retina to the brain is around 1.2 million [157].
2.2
Visual Perception
Figure 2.5: Different concentration of photoreceptor cells in the retina [165]. Visual perception is an increasingly important area of research in computer graph-ics. Its integration has altered both fields. As [Bartz et al.] wrote, “it offered new research questions, but also new ways of solving existing issues” [11]. Ittelson stated “perception is an interactive process of information exchange between participant and environment” [82] (also in [136]). It gives sense to what is observed.
Therefore, the ability to perceive an object in full detail and high quality can be divided into three groups, depending on the external stimuli, such as an object be-ing in motion. These groups are spatial resolution, temporal sensitivity and retinal inhomegenity.
2.2.1 Spatial Resolution
retina, the limit for the size of the stimulus is given by 0.5 min of arc” [94].
2.2.2 Temporal Sensitivity
Temporal sensitivity represents an amount of detail that can be captured in a mov-ing image with respect to time [148]. For example, by lookmov-ing at an object in motion, we are not able to achieve the same visual acuity as with an object standing still. However, our eyes are constantly recording and sampling the real environment. The gathered information is then summed up so the object in our field of view would appear as being stable or moving fluently.
2.2.3 Retinal Inhomegenity
The concentration of photoreceptor cells is not the same across the entire region of the retina. As we mentioned earlier, the highest concentration of cones is in the fovea, and this concentration falls drastically as we move away from the fovea. The opposite case is with rod cells. Furthermore, the periphery region is far more sensitive to motion compared to the inner area, which is more sensitive to de-tails [111, 148].
The maximum sensitivity of the human vision is achieved in the central part of vision, the fovea region. The capture of any detail or motion outside this region, requires head and eye movement [111, 148].
2.3
Attention and Perception
computer games), it is even smaller. Another example would be watching a live football match. If the focus of attention is not on the ball, there is a great chance that we will miss a goal scored.
In fact, in 1907 B`alint stated that “It is a well-known phenomenon that we do not notice anything happening in our surroundings while being absorbed in the inspec-tion of something; focusing our atteninspec-tion on a certain object may happen to such an extent that we cannot perceive other objects placed in the peripheral parts of our visual field, although the light rays they emit arrive completely at the visual sphere of the cerebral cortex.” [80] and also in [167].
William James in his book Psychology defined perception as “the consciousness of particular material things present to sense” [86]. In fact, several psychologi-cal surveys have proved that stimuli reaching the various senses are, in general, not processed independently [14, 15, 22, 29]. A similar result was also achieved by Tellinghuisen and Novak [179]. This is called inattentional blindness, meaning “that there is no conscious perception without attention”. In their study, Mack and Rock reported that the perception of shape requires attention, while perception of colour, location, motion does not [110]. They are perceived without attention.
Furthermore, perception can also be shaped by learning, memory and expectation [13, 65]. We are constantly surrounded by an overwhelming amount of information which affects all our senses. Despite this, we are constantly able to interpret what we see. Attention is what helps us in this process, by enhancing the relevant infor-mation and ignoring or under-presenting the rest.
2.3.1 Attention: Automatic and Voluntary Control
con-centrate in order to understand, for example, from where a particular smell is coming in the sea of various smells while in the market. This is an example of a top-down control. The opposite to this is a passive or exogenous attention, where we have a bottom-up control. An example of this would be the sound of a car accident, which will make us immediately attend in that direction [159]. Another example would be the results of a study done by Yarbus [209] where participants failed to notice anything outside the task-given region. Therefore, exogenous attention is dependent on colour, intensity, orientation and direction of movement, which form topographical, cortical maps called feature maps [92]. Saliency map is formed by combining these maps. It is used to predict where user will focus his/her attention in an image. A computer generation of the model for static images was developed by Itti et al. while Yee et al. created an extended version of the framework using Aleph map and including the temporal component.
When speaking about attention capturing, generally two terms are used: explicit attentional capture and implicit [166]. The former occurs when a certain object outside our visual focus attracts our visual attention, while the latter occurs when an irrelevant object affects our primary task. An example of explicit attention capturing is inattentional blindness. In experiments reported by Mack and Rock, participants were asked to report if they saw anything else besides the cross at which the focus of attention was placed. Between 60% and 80% of participants failed to report seeing other objects, beside the cross itself. Interestingly, participants tend to notice their name and a smiley face even though they are focussed on a different task [110, 167]. Besides our names, people seem to respond more quickly even to words such as “rape”, compared to more common and neutral words [38]. In another experiment done by Simons and Chabris, participants failed to notice a gorilla or a woman with an umbrella passing through the scene, while they were focussing on a white or black basketball team and how many shots they made [167]. The videos in the experiment were not computer generated (Figure 2.6).
automati-Figure 2.6: Single frames from the animation used in the experiment by [167]. cally. Usually, we focus our visual attention on the most interesting object in the scene, which may be familiar, or just the most salient one (eg. a red jacket among black and white tuxedos).
2.3.2 Attentional Limitations
As mentioned earlier, we are not able to fully perceive all information attacking our senses. Only those that are relevant and of interest at that particular moment will be interpreted and processed. Beside physical limitations, there are also limitations with regard to memory and attention overload. We can only store up to 5 different “chunks” of information in visual short-term memory [81, 106]. Luck and colleagues showed that we do not store in visual memory a single feature of a object, but rather complete information such as colour, shape and position of a particular object [106]. Furthermore, we also need to shift our attention in order to perceive the scene fully, as it has been shown that the maximum span of attention is even lower, 1 degree of visual angle [55, 56]. Eriksen et al., through a series of experimental studies, also showed that the visual attention focus could be changed [56]. However, with in-creased attention field, we decrease the number of processing resources within that particular field.
the primary task (driving) [175, 176]. Participants missed twice as many simulated traffic signals when talking on the phone, and took longer to react on those signals that they did see. Strayer et al. conclude that “conversing on either a handheld or a handsfree cell phone leads to significant decrements in simulated-driving perfor-mance.” However, this was not the case with other tasks such as listening to a radio station or a book recorded on a tape.
Chapter 3
Olfaction - Sense of Smell
The sense of smell is a primal chemical sense for humans. We are constantly test-ing the quality of the air we breathe and it also informs us of other environmental information, such as the presence of food, freshly brewed coffee, a fire breaking out in the next room, leaking gas or another individual, as research has recently shown [84, 88, 121, 129]. Recent research has also shown that every individual has a unique smell and therefore can be recognized by that smell [84]. Kerstin et al. showed that women can recognize the smell of fear in the armpit secretions of people who watched a frightening movie [89]. They believe it is not due to changes in the cortisol levels but rather that “hypothetical fear pheromone” has some other origin which still needs to be identified.
The odour emitted by a patient may be one of the early and therefore very impor-tant clues of various diseases such as cancer, schizophrenia [103, 121]. In extensive research by [42] on 750 patients with a primarily olfactory problem, 68% reported that their disfunction significantly altered their life, 46% said that the disorder af-fected either their appetite or body weight and 56% complained that it influenced their daily living and/or psychological well-being. Miwa and colleagues also showed that the olfactory problem can decrease the quality of life [117].
ol-factory response” and odour, “sensation resulting from stimulation of the olol-factory organs” [48, 141].
3.1
The Human Olfactory System
Smell being a very direct sense implies that in order for us to smell something, the molecules of the particular object will have to reach our nose. Everything we smell is giving off molecules: fresh bread in a bakery, hot pizza, flowers, and so on. But, in order for a substance to be recognized as an odour by the receptor cells, it has to have certain molecular properties [99, 141]:
• the substance must be volatile enough to float through air into our nose. For example, steel has no smell because it is a non-volatile solid,
• the substance must be capable of dissolving in water and thus able to pass through the mucus layer and to the olfactory cells,
• the substance must be capable of dissolving in fat since olfactory cilia are mostly composed of lipid material.
Odorants represent volatile chemical compounds with low molecular weight (30-300 [Dalton]) that are carried by inhaled air to the regio olfactoria (olfactory epithe-lium), the region located at the top of the two nasal cavities, just above and behind the nose, in the middle of the face (Figure 3.1) [67, 99].
Figure 3.1: The olfactory region [99].
Each olfactory receptor neuron has 8-20 cilia that are hair-like extensions, 30-200 microns in length. The olfactory cilia are responsible for transmitting the odour to the olfactory nerve, which then sends it to the brain [99]. In addition to the cilia, there is also a fifth cranial nerve called the trigeminal which has free nerve endings spread throughout the nasal passage. These nerves react to very strong and irritating smells such as detergents, pepper and so on [152, 212].
As mentioned earlier, the olfactory epithelium is situated just above the mucus layer and covers a surface of about 3cm2. It is composed of: the olfactory receptors, the supporting cells, and the basal epithelia cells [128]. The olfactory receptors are located above the mucus layer (see Figure 3.2) and are composed of two discrete segments, each accessed from a single nostril i.e. left or right [97, 171].
Figure 3.2: The olfactory epithelium [99].
One of the leading issues in current olfactory research is still how the brain dif-ferentiates one smell from the other [197]. In 1991, Richard Axel and Linda Buck published a key paper on how the brain interprets smell and in 2004, won a Nobel Prize in Medicine for the paper and their independent research. They reported that olfactory receptors belong to a large family of molecules called G-proteins and that every receptor cell has only one type of receptor which can detect a certain number of molecules and respond to them [24]. It is now known that there are about 350 odorant receptor genes and about 560 odorant receptor pseudogenes in humans. This number of genes and pseudogenes, specific only to the olfactory system, em-braces nearly 2% of around 50,000 genes of the human genome. All other senses occupy much smaller regions [24, 99, 171].
Each odorant is recognized by a different gene and, it is believed that there are around a hundred million receptor cells in the human body. If we are missing a sin-gle gene, that could lead to a lack of olfaction to that particular smell. For example, some people have no sense of smell for “camphor” [48]. Furthermore, a tiny change in the molecular structure of an odorant may lead to a perception of a completely different odour [24].
The vast number of theories used to describe the mechanism of smelling odours can be classified in two groups: physical theory and chemical theory [141]. The physical theory indicates that each molecule of an odour and its particular shape simulates a different olfactory cell and therefore, a unique odour is perceived. However, scientists reported that some molecules with nearly the same shape smell nothing alike [213]. Among researchers, the chemical theory is more accepted. According to this theory, “the odorant molecules merge chemically to protein receptors in the membranes of the olfactory cilia. The type of receptor in each olfactory cell determines the type of stimulant that will enhance the cell. Attaching to the receptor indirectly creates a receptor potential in the olfactory cell that generates impulses in the olfactory nerve fibers” [141].
3.2
Odour Perception and Physiological Response
Olfactory perception is composed of three basic tasks: intensity estimation, qual-itative description, and hedonic tone [68]. One of the most significant features of olfaction is the high sensitivity and thus low detection threshold. Certain odours in air can be detected, but not identified (“I smell something”) at very low concentra-tions such as 4×10⁻¹⁵g/L and are identified at 2×10⁻¹³g/L [128]. These numbers represent an estimate due to high diversity of population but in general may differ by a maximum of 50-fold [52, 162].
On the other hand, qualitative description of an odour still remains a difficult task, mostly because humans have the ability to discriminate up to 10,000 dif-ferent odorants (compared to vision where we have only four difdif-ferent kinds of receptors) [88, 162]. Various schemes have been proposed in the past in an at-tempt to classify odours into smaller groups. The first such atat-tempt was made by Amoore, who proposed 7 primary odours because of their high frequency of occurrence amongst 600 organic compounds: camphor, musk, floral, peppermint, ether, pungent and putrid [6, 84]. Rimmel proposed a more general classification system which included 18 categories, while a more abstract system was proposed by Zwaardemaker that included only 9 main categories, each of which was further divided into two or more categories (see [119]). Henning’s odour prism represents an attempt to identify primary odours (equivalent to red, green and blue colours) [72]. Each corner of the prism represents a primary quality: fragrant, putrid, ethereal, spicy, burnt and resinous (see Figure 3.3).
theo-Figure 3.3: Henning’s smell prism [142].
ries, current approaches employ odour profiling techniques, in which a large number of verbal descriptors are used to describe individual odours adequately, if at all possible [68, 162]. Needless to say, the use of verbal descriptors assumes partici-pants have the same olfactory experience and that they will use the same words in the same way to describe a particular odour [199]. Furthermore, odours that are nameable are almost by definition highly familiar [170]. Individual differences in reception are very much influenced by individual differences in cognition, culture and experience [201]. This would seem to suggest that there are no primary odour qualities (for a similar conclusion see [35, 171]).
[image:40.595.190.444.106.334.2]cul-tures may be significant, since culcul-tures differ in their use of various flavours, specific odours and in their use of odorants in different contexts (eg., cleaning detergents, perfumes, and so on) [120, 171].
and audition, major developmental changes such as object discrimination, hearing threshold, colour and depth perception are nearly complete by the age of one [171]. Even though olfactory sensitivity (which depends on the duration of stimulation and concentration [26]) gradually but steadily declines with age [42,101,186], it has been shown that pleasant fragrances have positive effects across all age groups. However, even though there is strong evidence that a pleasant smell can improve our mood and our sense of well-being, researchers also found that just by telling participants that a pleasant or unpleasant odour was being used in the study, which they might not be able to smell, altered their reports of mood and well-being [60]. In an inter-esting research done by Stockhorst and colleagues, insulin was injected into healthy male volunteers once a day for four days and their blood glucose was measured (it fell). At the same time, they were exposed to a smell. On the fifth day they were just given the smell, and their blood glucose again fell [173].
Even though we may learn to discriminate different odours with age and experience (eg., wine tasters), we are still not able to separate an odorant from a mixture of more components [67]. We may never be able to do so due to the nature of our olfactory information processing [78, 171]. However, one of the important charac-teristics of olfaction is the ability of an odour to evoke an old memory as if it was a current moment. This phenomenon might be described as an implicit memory effect on perception [169].
3.3
Olfaction and Memory
Cupchik also reported that odour-triggered memories tend to be highly emotional, vivid and specific [73, 74]. In other research, Herz and Eich presented a number of arguments to support their claim that olfactory memory is different from verbal memory [75]. The relationship between memory and smell is:
• Memory: odour memory falls off less rapidly than other sensory memory and is unique compared to memory in other sensory modalities [98, 115].
• The “Proust effect”: an odour associated with an experience and a smell can recall the memory; smell is better at this memory cue effect than other senses [37].
The largest smell survey, the National Geographic survey, gave readers a set of six odours on scratch-and-sniff cards. From a sample of 26,200 respondents, 55% of respondents in their 20s reported at least one vivid memory cued by one of the six odours and only 30% in their 80s did the same [63]. Furthermore, research has shown that short-term visual recognition produces 100% correct answers, as op-posed to 70% when odour is used. However, studies show that olfactory information is longer lasting in our memory than other types of stimuli which degrade over the years [37]. For example, even one year after, no significant decrease in odour recog-nition performance was noted in the study presented by [54].
In a recent experiment, participants were presented with three stimuli: visual (an image of an object), lexical (the name of an object) and olfactory (the odour of an object). They were asked to write down whatever they could think of in regard to the presented stimuli. The responses to the visual and lexical were longer but less emotional than those given for olfactory stimuli. Those responses referred to mem-ories [60]. Since we encounter most odours for the first time in our youth, smells often evoke childhood memories.
stimulated. Adding some aromas to the air lengthens customers’ shopping time by 16 %, makes them 15 % more willing to buy, and increases sales by 6 % [161]. The role of olfaction in learning and memory has been found useful in training people in various areas. Examples include the recognition of chemical reactions by olfaction rather than sight and for increasing recall, recognition, attention, performance, and productivity [87]. One of these factors, performance, was tested in the presence of smell in the study presented in Chapter 6.
Ambient odours of lavender and lemon introduced during the encoding process im-proved free recall, word recognition, and performance on spatial learning tasks in subsequent trials for four weeks after the initial introduction [122]. Smell of lemon represents one of the most common smell used in the household and as such was used also in studies presented in Chapter 6.
3.4
Olfactory Displays and Electronic Noses
Smell represents an under-used and almost unexplored medium [12, 88]. There are various reasons for this, such as no adequate technical solution for emitting scents, the problem of creating accurate scents when knowing that a human nose can rec-ognize up to 10,000 different molecules, delivering on demand, and so on [36, 88]. Even though the final output of this thesis will not be the development of olfactory display nor electronic noses, the main advances so far will be explained here in brief for completeness.
nose ranges from seconds to a few minutes, which represents a significant draw-back [40]. However, they are frequently used in the food, beverage, and perfume industries for product development and quality control, medical diagnosis and en-vironmental monitoring [40, 143]. More recently, University of California San Diego Jacobs School of Engineering announced the development of an optimized compo-nent that can select and release scents from 10,000 odours, and is intended to be part of a Digital scent solution for TVs and phones in the future [91]. Furthermore, as reported by NASA researcher, Dr.Ryan, in essence electronic noses can be used to identify substances whose patterns are already known. However, a step forward would be the development of a successful computer model that could help an elec-tronic nose identify unknown compounds as well [127].
connected to the portability issue.
The two general types of olfactory displays are: ubiquitous and wearable. The first known display was developed by Cater and a group of researchers at the Deep Immer-sion Virtual Environment Laboratory (DIVE) at the Southwest Research Institute in San Antonio, Texas. It was called DIVEpak, controlled by a microcomputer and was able to deliver eight odours [211].
ART Media Information Science Laboratories created an easily controllable olfac-tory display that uses an “air cannon” to deliver scent near the user’s nose [203–205]. The system detects the position of a user’s nose with the help of computer-based face tracking technology. In this particular case, users can enjoy the scent without having to wear anything on their faces. However, their movement is reduced as they cannot walk outside (i.e. outdoors). Yamada et al. created a wearable type of olfactory display: “direct-injection wearable olfactory display” [202]. The system injects odour molecules directly to or near the user’s nose.
component odours [123]. The size was unchanged (size of a laptop computer) even though the number of odours was four times larger than was the case for the pre-vious version. 256 combinations were possible with the 8 odour components, while approximately 2×10⁹combinations are possible in the case of 31 odour components. In 2003, Tijou et al. developed a DIODE project that enables olfactory feed-back [181]. The user, wearing a head-mounted display (HMD), navigates through the Vendome Square in Paris and as he/she moves, a smell corresponding to a par-ticular object, eg. the smell of a Christmas tree, the smell of a rose and/or the smell of an orange tree, is generated by the olfactory diffuser.
Today, there are various companies that are involved in the production of olfac-tory displays that emit scent, under a variety of computer control, i.e., DigiScents, Osmooze, AromaJet, TriSenx, ScentAir, Scent Collar, and so on [17, 40, 168, 184]. However, no standardized way of describing the odour has been created, and thus one smell will be represented differently depending on the manufacturer [40, 191]. Still, none of the current display devices can fully generate and transmit odour information to humans. The reasons mentioned previously limit the application of olfactory displays in virtual reality. The three problems of smell: accuracy, intensity and duration are the key areas that must be addressed for automatic smell devices to become an acceptable and widely used technology. Furthermore, as shown earlier, individuals perceive smell differently and indeed, each smell may be identified in a unique way [141]. High-fidelity smell diffusion in a virtual environment thus needs to take into account not only the airflow within the environment, but also the type of smell and the viewer him/herself [145]. However, all these new devices show that research in this field is continuing towards the development of an olfactory device that will be able to integrate well into virtual environments [36].
3.5
Multi-modal Virtual Environments
our vision, sense of direction and balance.
All these senses can be studied individually. However, incorporating them together in a multi-modal virtual environment represents one of the goals of research in com-puter graphics and perception, as it has been shown to increase the user’s sense of presence in virtual reality [212].
Although relationship between vision and some other senses such as audition, touch has been studied in the past [51, 111–113, 137, 154, 174, 198], very little work has been done in regard to relationship between vision and olfaction. There are various reasons for this, including a huge variety of different smells, absence of unified cate-gorization, difficulty of on demand production [88]. Literature reports [66, 102, 130] that there are virtual environments (VEs) that include haptic feedback to provide a higher level of interaction, but only a few applications provide olfactory feedback (for example: [181]). Bafield and Danas stated that: “Olfactory information has been mainly ignored as an input to the virtual environment participant, in spite of the fact that olfactory receptors provide such a rich source of information to the human” [10]. To this day, the integration of the sense of smell has been almost exclusively a research issue.
3.5.1 Research on olfaction across different fields
Research in psychology has mainly focussed on investigating whether our sense of olfaction can aid in remembering the presented information, training, basic educa-tion, and if it enhances the virtual experience.
Instead of increasing the amount of smell, we increased the amount of time spent in the test environment.
Thirty years later, Barfield and Danas analyzed the physiological and psychological aspects of olfaction in virtual environments and discussed various mechanisms of presenting odours in such an environment. Parameters such as field of smell, the great variety of smells, and spatial resolution are considered to be of great impor-tance in such a process [10].
The 3D virtual system named “Friend Park” was developed to verify whether an incorporated sense of smell would result in the feeling of being there [183]. Par-ticipants’ questions responses such as “I feel like I was in the forest” and “I could smell the smoke of the incense”, indicate the importance of including smell into vir-tual environments. Nakamoto et al. created an interactive olfactory display for the cooking game [125]. They were able to control duration and strength of a certain, predefined number of smells in the cooking game. Smells are essential for reproduc-ing reality and 90% of participants reported that smell did enhance the content’s reality. Participants reported enjoying the use of all three senses (touch, smell and sound) and some of them reported being hungry after they had tried the game. The smell of freshly cut-grass caused similar responses in the experiment presented in Chapter 5.
Mochizuki et al. developed a game called “Fragra” which incorporates olfaction and vision [118]. They created a virtual tree with various fruits, and the goal is for the user to pick the fruit and decide whether the smell released through the tube attached to his/her hand, is of the fruit picked. The number of correct answers varied with the combination of vision and smell and the general conclusion is that the visual appearance might be stronger than scent and vice versa. A few years earlier, Sarfarazi et al. showed direct evidence that odour presence affects the brain activity of visual stimulus [160].
basic education and training by providing essential information about what is on fire and where. Most recently, in the project called “...towards Real Virtuality”, scientists from the Universities of York and Warwick have developed a multi-modal “Virtual Cocoon”, a device that is able to simulate all 5 senses [163]. The official presentation of “Virtual Cocoon” was at “Pioneers09”, an EPSRC showcase event, London, March 2009.
The work done by [153] makes further progress by adding an olfactory display to virtual therapy of post-traumatic stress disorder (PTSD). PTSD is reported to be caused by “traumatic events that are outside the range of usual human experi-ence, including (but not limited to) military combat, violent personal assault, being kidnapped or taken hostage and terrorist attack” [153]. They created a virtual en-vironment to treat PTSD patients among Iraq War military personnel and added olfactory and tactile experiences to the environment. Simultaneous delivery of scent with visual and audio stimuli created a more realistic multi-sensory experience for the user and enhanced the sense of presence [61,153]. They also used a head-mounted display with headphones and a hand controller for movement.
The Ministry of Defence in the UK has invested£20,000 into similar research [178]. Namely, a group of researchers from the University of Birmingham is developing game-based training for, for example, soldiers being deployed to the Middle East. Smell is added in order to test its effect on training.
learn-ing alphabet letters [151].
The need for combining research in two distinct fields such as psychology and com-puter graphics comes from the current inability to produce a high-fidelity rendering in real-time due to computational complexity and requirements of physically-based rendering process, which is used when the reproduction of real-world is needed. As shown in Chapter 2, the human visual system even though a very complex struc-ture has its own limitations. This means that there is a threshold beyond which we cannot perceive any quality improvements.
Dinh et al. created a multi-modal virtual environment composed of reception, hall-way, copy room, office room and balcony [46]. They used a head-mounted display with headphones, while the smell (the scent of coffee) was delivered through “the oxygen mask connected to a canister of coffee grounds and a small pump”. The sense of presence was increased with each new modality added. Although, interestingly, increasing the quality of the virtual scene, did not increase the sense of presence nor the memory of the room. However, incorporating aromas into virtual environments has been shown to be an effective memory enhancer as 95% of subjects exposed to the aroma of coffee, recalled the location of the coffee pot versus 59% of subjects from the control group.
We use these limitations to maintain the perceived quality of displayed images while reducing the time needed to render them. Mastoropoulou et al. [111–113] and Ellis et al. [51] similarly exploited these limitations in combination with audio and move-ment and were able to achieve significant time and cost reduction. In Chapters 4 - 7 of this thesis, we used same analogy with smell.
As shown by [212], in order to have a full experience of a virtual environment, all our senses should be stimulated. It is usually not enough to have just high-fidelity graphics. In order to increase the sense of presence. Many different techniques have been developed, one of them being perceptually based visual rendering, which uses the advantages of both top-down and bottom-up visual attention.
performed via task maps [30]. The saliency map is based on colour, intensity and orientation and is generated for each frame of the animation. Saliency maps are also used by Chalmers et al. [32] and Longhurst et al. [105]. Saliency maps modified for smell are used in Chapter 7 of this thesis.
Task maps are different from saliency maps as they use an endogenous visual atten-tion model [30]. A task map is created from the task related objects present in the virtual scene. It is used in the rendering process in such a way that only task related elements in a scene are rendered in high quality and the remainder in low quality, without a noticeable perceptual degradation in visual quality. This has been shown to be effective in Chapter 4 as users failed to notice anything outside their task area. This rendering concept is known as “selective rendering” [41]. Selective rendering is a key part of this thesis and will be discussed in detail later.
sense of smell has prevented major improvement in this area. However, even though our understanding of olfaction is far from complete, due to constant improvements in various fields, today the sense of smell is far less mysterious than it used to be [21]. Research on olfaction and its incorporation within computer graphics represent a new direction within research community, and therefore, not so much work has been carried out. However, all these findings represent a good starting point for the re-search presented in this thesis as they indicate the importance of smell inclusion within virtual environment. Although generating such high-fidelity virtual environ-ments requires great computational costs and rendering times, goal of this thesis and research presented here is to show how these costs and times could be reduced and to what extent, with the help of olfaction.
Chapter 4
Preliminary Investigation of
Olfactory Influence on
Perception
4.1
Introduction
scene, for example a brightly coloured object [32, 110, 131].
This chapter presents an experimental methodology and the results of a preliminary study where we show how we can potentially accelerate the rendering of images by directing the viewer’s attention towards the source of a smell and selectively render-ing at high quality only the smell-emittrender-ing objects. Other parts of an image can be rendered at a lower quality without the viewer being aware of this quality difference. By doing this, we can significantly reduce rendering time without any loss in the user’s perception of delivered quality. Work in this chapter has been published in [144].
4.2
Experimental Methodology
In this section the experimental methodology employed in this study is presented in detail. The hypothesis, design and equipment used, together with the participants and the procedure, will be described and discussed.
4.2.1 Hypothesis
and specified surrounding pixels are rendered at the default quality, while all the other pixels are rendered at the low quality. If no object is specified, the entire frame will be rendered using the default quality.
Figure 4.1: Our Selective Rendering approach. The smell emitting object, in this case the flowers (close up right), are rendered at a higher quality, 16 rays per pixel, while the remainder of the scene is rendered at a lower quality, 9 rays per pixel, for example the couch (close up left).
4.2.2 Participants
this was best left out.
The majority of the participants had attended a computer-graphics course and were thus familiar with basic concepts such as rendering quality, jagged edges as result of low quality, etc. Testing computer graphics knowledge of our participants was not the goal of this thesis or this experiment. However, knowing that they were familiar with computer graphics terms may be used to stress the importance of the results gained in this study. The subjects were randomly divided across the two conditions. The members of each of these two groups were informed that they could withdraw at any time during the experiment, however, none of them did so.
4.2.3 Design
For our experiment we used an independent-samples design. The dependent vari-able was the perceived relative object quality and independent varivari-ables were a) the actual quality at which the image was rendered (either high quality, low quality or selective quality) and b) the olfactory background (“smell” or “no smell”).
Figure 4.2: The conditions tested.
4.2.4 Equipment and Materials
The test environment comprised a PC placed on a desk in an empty room, so there were no external distractions. The subjects watched the images on full-screen on the 17” monitor of the PC (resolution: 1280×1024 pixels). No compression was applied to the images used in the experiment study in order to avoid various visual defects that might be the result of such action. The resolution chosen for all experiments in this chapter was 720×540 pixels, which was the same resolution used in simi-lar previous research, for example [41, 111]. Pixels outside the rendered animation were shown as black. The black colour allows us to have a better contrast between image/animation and the background. Participants were seated at normal viewing distance from the monitor (≈60cm).
The scent stimulus was presented using a perfume spray. For the “smell” condition, the room was manually sprayed with perfume before subjects were let in. The smell was thus omnipresent for this experiment.
• High Quality (HQ): Entire image rendered at high quality, 16 rays per pixel (rpp), Figure 4.3. 16rpp was chosen as this quality was show to be an appro-priate choice by Mastoropoulou [112].
• Selective Quality (SQ): The pixels of the SEO, i.e. the flowers, and a small surrounding area equating to the fovea angle, were rendered at high quality, 16 rpp, while the remaining pixels were rendered at the low quality of 9 rpp, Figure 4.4.
• Low Quality (LQ): Entire image rendered at low quality, 9 rays per pixel, Figure 4.5.
Figure 4.3: High quality image used in the experiment.
Figure 4.6 shows the obvious quality difference between scene details rendered at high and low quality, respectively.
Figure 4.4: Selectively rendered image.
Figure 4.5: Image rendered at low quality.
Figure 4.6: Close up of scene details rendered at high quality, 16 rays per pixel, and low quality, 9 rays per pixel respectively.
Table 4.1: Rendering times for different image qualities used in the study Image quality Rendering time
HQ 50min SQ 15min LQ(1rpp) ≈3min
LQ(9rpp) ≈28min
4.2.5 Procedure
Every experimental session lasted for approximately 1-2 minutes. During this period of time, participants were first explained what was expected from them. They were told that they will be shown two still images on a computer screen and that afterwards they will be asked questions. Each participant was tested individually and could participate in one single session. The images were shown at full screen resolution so the participant had to switch between them to be able to examine them both. As explained earlier, images were not stretched but rather shown with black background.
The question participants were asked at the end of the experiment was: “Which of the shown two images was better? To decide please consider the rendering quality”.
4.3
Results
Tables 4.2, 4.3 and 4.4 show the results of the preliminary experiment. In table 4.2, 20 subjects saw the HQ image (16 rpp) and the LQ one (9 rpp). As can be seen all participants could tell the difference with and without the smell. Table 4.3 shows results of 20 participants who were shown two HQ images and a result of 50% as expected for each image was achieved. The order of shown images was random per each session.
Table 4.2: Results for HQ vs LQ
Conditions Rendering quality HQ LQ No smell 10(100%) 0(0%) Smell 10(100%) 0(0%)
Table 4.3: Results for HQ vs HQ
Conditions Rendering quality HQ HQ No smell 5(50%) 5(50%) Smell 5(50%) 5(50%)
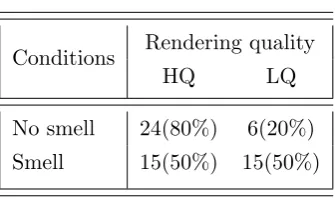
Table 4.4: Results for HQ vs SQ
Conditions Rendering quality HQ SQ No smell 24(80%) 6(20%) Smell 17(57%) 13(43%)
30), correctly identified the rendered quality. On the other hand, only 57% (17 out of 30) correctly identified the HQ image in the presence of smell. This is close to the “chance” condition of 50%.
Even though participants were not specifically divided in terms of knowledge of computer graphics, from personal evidence we can say that those who were unfa-miliar in general (about 30% of the total) had a harder time detecting differences in image quality. We consider this to be natural as they had to focus on the entire image while others (familiar with computer graphics terms), knew exactly what to look for and even possibly, where to look (i.e., object edges, shadows, and so on). Future work should explore this issue further to better understand the difference in computational savings that may be possible depending on the computer graphics knowledge of the viewer.
We used Chi-square test (χ2) for the statistical analysis of the results since the response of subject was binary. The Chi-Square test is a non-parametric test and is commonly used to produce the statistical confidence of a hypothesis. The Chi-Square test (for 2 Independent Samples) for the unpaired comparison between the two groups gave a significant result of p ≤ 0.001 for degrees of freedom=1, χ2 = 12.258, revealing a strong interaction between olfactory background of the selectively rendered image and perceived rendering quality. Therefore, our initial hypothesis that it would be more difficult for subjects to notice rendering quality variations in the presence of smell than while watching an image in no-smell conditions, was confirmed.
4.4
Summary
Chapter 5
Cross-Modal Effects of Smell on
the Real-Time Rendering of
Grass
5.1
Introduction
Inspired by the initial findings, we decided to investigate the cross-modal effect on the perception of the real-time animation of a field of grass in the presence of the smell of cut grass. Modeling and rendering natural scenes accurately is a major challenge for computer graphics. However, there are numerous applications which would benefit from such accurate representations of the real world such as sports’ games, virtual archaeology, medical trainings and many more (see Chapter 3). Al-though computer-generated imagery of natural scenes has made significant progress in the last few years, for example Figure 5.1 which shows real-time rendered grass blades, the computational requirements are still high, precluding their exploitation in real-time settings on standard desktop machines.
Figure 5.1: Real-time rendered grass blades
Overcoming the complexity of grass in order to render it in real-time has been a challenging problem for many years. Previous approaches either render grass in real-time but with coarse approximations [9, 133, 134, 149, 164], or render grass in high quality but offline [44].
Although typically not as developed as our other senses, the presence of a pleasant or unpleasant smell can alter the way we view a scene. Such a cross-modal effect can be substantial, with parts of a scene literally going unnoticed as the smell dominates our senses. As explained in the Chapter 3, researchers believe that unpleasant odour triggers negative emotions and displeasure, as opposed to pleasant odour which can bring about positive emotions [4, 5, 155]. Rendering the high level of detail of a close-up view of a field of grass is computationally very demanding. In the real world the smell of grass would be present, and especially strong if the grass had just been cut, for example in preparation for a sports event.
For the purpose of this study, we used a relatively novel approach to rendering of large surfaces of grass from Boulanger [20], using dynamic lighting, dynamic shad-ows and anti-aliasing. This method has three levels of detail, chosen depending on the distance from the camera: geometry rendering, volume rendering with per-pixel lighting, rendering of 2D texture map with per-pixel lighting. Our approach, how-ever, allows very detailed rendering with shadows of grass in close proximity to the viewer, and rendering of distant grass with per-pixel lighting and with a convincing parallax effect [20].
Using a level-of-detail approach provides a good compromise between lighting qual-ity and rendering speed. Furthermore, this grass-rendering algorithm allows us to virtually render an infinite number of grass blades [19]. This work has been pub-lished in [146].
5.2
Hypothesis
We hypothesized that by exploiting the cross-modal interaction between smell and visuals we would be able to render a lower-quality version of a field of grass at a reduced computational cost, without the viewer being aware of the quality difference compared to a high-quality version. We thus considered two conditions: “No smell” and “Smell”.
5.3
Participants
66 participants, ages ranging from 18 to 57, mixed sexes (19 females and 47 male) from the undergraduate and postgraduate student population of Sarajevo School of Science and Technology (SSST) and University of Warwick volunteered to partici-pate in this study.
![Figure 2.2: Sectional view of the eye [94].](https://thumb-us.123doks.com/thumbv2/123dok_us/9652535.467257/25.595.196.455.112.351/figure-sectional-view-of-the-eye.webp)
![Figure 2.5: Different concentration of photoreceptor cells in the retina [165].](https://thumb-us.123doks.com/thumbv2/123dok_us/9652535.467257/28.595.187.431.109.339/figure-dierent-concentration-photoreceptor-cells-retina.webp)
![Figure 3.2: The olfactory epithelium [99].](https://thumb-us.123doks.com/thumbv2/123dok_us/9652535.467257/37.595.129.512.105.376/figure-the-olfactory-epithelium.webp)
![Figure 3.3: Henning’s smell prism [142].](https://thumb-us.123doks.com/thumbv2/123dok_us/9652535.467257/40.595.190.444.106.334/figure-henning-s-smell-prism.webp)