warwick.ac.uk/lib-publications
Original citation:
Kristoufek, Ladislav, Moat, Helen Susannah and Preis, Tobias. (2016) Estimating suicide
occurrence statistics using Google Trends. EPJ Data Science, 5 (1). 32.
Permanent WRAP URL:
http://wrap.warwick.ac.uk/87381
Copyright and reuse:
The Warwick Research Archive Portal (WRAP) makes this work of researchers of the
University of Warwick available open access under the following conditions.
This article is made available under the Creative Commons Attribution 4.0 International
license (CC BY 4.0) and may be reused according to the conditions of the license. For more
details see:
http://creativecommons.org/licenses/by/4.0/
A note on versions:
The version presented in WRAP is the published version, or, version of record, and may be
cited as it appears here.
R E G U L A R A R T I C L E
Open Access
Estimating suicide occurrence statistics
using Google Trends
Ladislav Kristoufek
1,2*, Helen Susannah Moat
1and Tobias Preis
1*Correspondence:
[email protected] 1Data Science Lab, Behavioural
Science, Warwick Business School, University of Warwick, Coventry, CV4 7AL, UK
2Institute of Economic Studies,
Faculty of Social Sciences, Charles University, Opletalova 26, Prague, 110 00, Czech Republic
Abstract
Data on the number of people who have committed suicide tends to be reported with a substantial time lag of around two years. We examine whether online activity measured byGooglesearches can help us improve estimates of the number of suicide occurrences in England before official figures are released. Specifically, we analyse how data on the number ofGooglesearches for the terms ‘depression’ and ‘suicide’ relate to the number of suicides between 2004 and 2013. We find that estimates drawing onGoogledata are significantly better than estimates using previous suicide data alone. We show that a greater number of searches for the term ‘depression’ is related to fewer suicides, whereas a greater number of searches for the term ‘suicide’ is related to more suicides. Data on suicide related search behaviour can be used to improve current estimates of the number of suicide occurrences.
Keywords: nowcasting; search data; Google Trends; official statistics
1 Introduction
The identification of causes of suicide attempts and suicide occurrences is a topic which has attracted the interest of a number of scientists in psychology and psychiatry [–] as well as in other social sciences such as demography, sociology and economics [–]. One of the challenges of analysing and modelling suicides from a macroscopic perspective is a long time lag in their reporting in official statistics. Identifying additional sources and data which would help estimate the number of suicide occurences before official data are available is thus of high importance and interest. In recent years, studies of the online ac-tivity of Internet users have proven fruitful in various fields ranging from medicine [, ], ecology [, ] and epidemiology [–] to linguistics [], politics [], sociology [] and economics, finance and behavioural science [–]. For example, previous studies have provided evidence that online data may help us reduce delay and cost in measuring human behaviour [, , , , ], allow us to measure aspects of society and our en-vironment that were previously difficult to measure [, , , ], and in some cases, even predict future actions [, , , , , ].
Here, we investigate whether data on searches relating to depression and suicide can help us address the problem of delayed data on suicides, and generate estimates of the number of suicide occurrences before official figures are released. A number of previous studies have attempted to investigate whether online search data might provide an avenue for creating quicker estimates of the number of suicide occurrences [–]. However, these
analyses were subject to a number of important restrictions. For example, McCarthy [] examined the possible link between suicide occurrences and online activity in the USA. A strong negative correlation of -. was reported between the yearly number of suicide occurrences and the yearly search activity for the term ‘suicide’. This finding was, how-ever, based on a very limited data sample only (specifically, annual data between and ). Pageet al.[] studied monthly online search activity of suicide-related search terms in Australia between and . They found no evidence for a significant link to suicide rates. However, their analysis was very restricted due to the availability of suicide data in Australia. Pageet al.therefore limited themselves to analysing seasonal patterns in search activity and its relationship to changes in unemployment, which is frequently re-ported to be connected to suicides rates. No connection to suicide rates or suicide statistics was thus examined. Sueki [] analysed a monthly suicide time series for Japan between and by calculating cross-correlation coefficients. Using the terms ‘suicide’, ‘de-pression’ and ‘suicide method’ translated into Japanese, Sueki found that increasing num-bers of suicide occurrences coincide with increased online search activity for the ‘depres-sion’ term only. At the same time, increasing search activity for the ‘depres‘depres-sion’ term also appeared to be linked to a decrease in the actual suicide rates three months both ear-lier and later. The author thus suggests that the Internet could help prevent suicides by providing meaningful information to individuals who are depressed. The relevance of the results is, however, again weakened by a limited dataset (a monthly time series from to ). Yanget al.[] investigated monthly suicide time series for Taipei in Taiwan, covering the time period from to . The authors analysed suicide-related search terms and reported that searches for a number of terms could be connected to the number of suicide occurrences for specific age groups, as well as specific types of suicide. However, we note that the authors did not control for possible non-stationarity of either suicide or online search data. Hagiharaet al.[] studied suicide rates in Japan between and for individuals with an age between and . Utilizing the Box-Jenkins transfer function, the authors found several positive links between online search activity and suicidal behaviour. However, considering the number of observations (), the num-ber of analysed terms (), the numnum-ber of lags included in the transfer functions () and seasonal adjustments, it is difficult to exclude the possibility that the low number of statis-tically significant connections at specific lags may result from statistical error. In addition, Gun III and Lester [] carried out a cross-sectional correlation analysis of state-level data from the USA in . A positive correlation was found for all three search terms which they use - ‘commit suicide’, ‘how to suicide’ and ‘suicide prevention’. However, in this final study, the authors restrict themselves to a cross-sectional analysis and do not investigate the possibility of using search data to improve estimates across time.
dataset analysed here also makes it possible to investigate the potential for using online searches to estimate suicide incidence numbers in practice, before the official data arrives. We refer to this as a ‘nowcasting’ analysis, in which we are ‘predicting the present’ [].
2 Methods 2.1 Data
We study monthly suicide occurrence statistics in England between and pro-vided by Office for National Statistics (ONS, www.ons.gov.uk).aThese data are made avail-able with a pronounced lag of approximately months. Suicide numbers are given for both males and females and different age brackets. Due to the coarseness of the data, we conduct our analysis on the overall occurrences, but do not investigate differences be-tween gender and age groups.
Previous studies have suggested that searches for the terms ‘suicide’ and ‘depression’ may relate to real world suicide rates. We obtain data on the number ofGooglesearches made for these terms from the websiteGoogle Trends(trends.google.com). Data are re-trieved fromGoogleat monthly granularity and relate to searches made in England only. The number of queries for a given term is rescaled to a value between and . This holds for all search data retrieved fromGoogle Trends, potentially weakening the value of
Googledata in modelling, as the actual number of searches is not provided. However, com-pared to other alternatives such asTwitterorWikipediadata,Googlesearch data provide much longer time series with easy geographical localisation. Both these characteristics are crucial for our analysis.
2.2 Models
As a benchmark model for suicide occurrences, we use a simple autoregressive model with seasonal dummy variables
SUIt=α+αSUIt–+
m=
μmMm,t+εt, ()
whereSUItrepresents the number of suicide occurrences in montht= , . . . ,T. We use
a lag of months to account for the fact that suicide data is released with two years delay. VariablesMm,tare dummy variables equal to one if the observation at timetis the specific
monthm, and zero otherwise.
A competing model utilizingGooglesearch queries is specified as follows
SUIt=β+βSUIt–+
q=
j=
δjDEPRESSIONt–j
+
q=
j=
ζjSUICIDEt–j+
m=
μmMm+νt ()
for t= , . . . ,T and a lag order q is set equal to months. This allows us to con-trol for annual seasonalities, and also enables us to investigate the relationship between
Googlesearch volume and the number of suicides at a range of different monthly lags.
Multicollinearity issues and a high number of regressors might make this estimation procedure unstable. A higher number of variables increases the variance of the estimators so that the results are less reliable. To address this problem, we use the Almon distributed lag model [] which reduces the number of estimated parameters. The model is based on a flexible approximation of a dynamic relationship between dependent and independent variables using the polynomial lag structure. Setting the number of lags according to Eq. () equal toq= and choosing a quadratic polynomialb(p= ) as an approximation of
possible dynamic relationship between the number of suicides and relatedGooglesearch queries, we can rewrite Eq. () as
SUIt=η+ηSUIt–+
q
j=
DEPRESSIONt–j p=
w= ιwjw
+
q
j=
SUICIDEt–j p=
w= κwjw
+
m=
μmMm+ut. ()
This reduces the number of estimated parameters from ∗(q+ ) + , i.e. in our case, in Eq. () to ∗(p+ ) + , i.e. in our specific case, in Eq. (). Note that out of these account for an intercept, lagged suicide occurrences, and seasonal dummy variables. We obtain estimates of the original model in Eq. () via a transformation of the estimates from Eq. () as
ˆ δj=
w= ˆ ιwjw,
ˆ ζj=
w= ˆ κwjw.
()
This specification is robust to multicollinearity between dependent variables. By intro-ducing a dependency structure into the setting, it allows for further interpretation of the relationship between the examined variables.
2.3 Model testing and performance
time. We test for significance of separate regressors using at-test, and joint significance using anF-test. In both cases, to avoid problems which could be caused by autocorrelation and heteroskedasticity, we use robust standard errors.
The quality of the estimated models is inspected using the coefficient of determination
Rand the adjusted coefficient of determinationR¯, which controls for a number of
inde-pendent variables. To give a further metric of the quality of the estimations made by the model, we also compare mean absolute percentage error (MAPE) for competing models. A higher MAPE indicates that a model is making lower quality estimates. MAPE is defined as
MAPE=
N
t∈T
SUItSUIt–SUIt , ()
whereSUIt is the fitted value of suicide occurrences,Tis an interval over which the model is estimated and treated, andNis a number of observations inT.
2.4 Nowcasting performance
The relationship we are investigating here is of most interest due to potential practical exploitation, whereGooglesearch data could be used to estimate the number of suicide occurrences in the past month, before the official counts arrive. Such estimates are often referred to as ‘nowcasts’ [], as the goal is not to forecast future values of a time series, but to estimate the value of the time series for the current period, drawing on past values of the time series and other relevant indicators. Estimates of these kinds are often constructed using standard forecasting methods.
We note that while finding a model that can describe the time series well is of value, good explanatory power does not necessarily imply that the model can be used to make estimates in practice. This is particularly true for models of non-stationary and seasonal time series, which can deliver very good fits but only poor forecasting performance. For this reason, we carry out a separate analysis to determine the nowcasting performance that can be achieved by includingGooglesearch data.
3 Results
3.1 Basic analysis
Figure 1 Official data on suicide occurrences and Googlesearches for ‘depression’ and ‘suicide’.We analyse monthly data from official records of suicide occurrences in England (lefty-axis). We investigate whether monthly data onGooglesearches for ‘depression’ and ‘suicide’ in England (righty-axis) can help estimate counts of suicide occurrences before the official data are available. Note that search data retrieved fromGoogleare normalised to create an index which takes integer values between 0 and 100. Higher values indicate that a higher proportion of the total searches in England in a given month were for the term of interest.
Table 1 Descriptive statistics of data on suicide occurrences
Mean SD Min Max Skewness Ex. kurtosis Jarque-Bera p-value
[image:7.595.113.479.257.285.2]Suicides 370.20 20.65 302 468 0.3797 0.3328 3.4377 >0.1
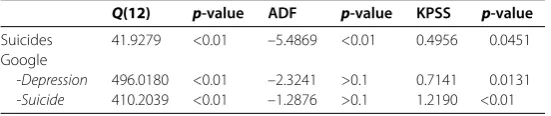
Table 2 Autocorrelation and unit-root tests
Q(12) p-value ADF p-value KPSS p-value Suicides 41.9279 <0.01 –5.4869 <0.01 0.4956 0.0451 Google
-Depression 496.0180 <0.01 –2.3241 >0.1 0.7141 0.0131
-Suicide 410.2039 <0.01 –1.2876 >0.1 1.2190 <0.01
TheQ-test checks for autocorrelation in the first 12 lags of the series. We find evidence of autocorrelation for theGoogledata as well as for the suicide series. The ADF test has a null hypothesis of the presence of unit roots, which is not rejected for the twoGoogletime series but is rejected for the suicide time series. The KPSS test has the null hypothesis of stationarity, which is rejected for bothGoogletime series and for the suicides time series.
Table 3 Coefficients for correlations between data onGooglesearches for ‘depression’ and ‘suicide’ and official data on suicide occurrences
Depression (Google) p-value Suicide (Google) p-value
Suicides 0.2124 0.0198 0.1626 0.0760
Depression (Google) 0.6580 <0.01
We find that the correlation between occurrences of suicides andGooglesearches for ‘depression’ is statistically significant but low. There is no evidence of a correlation between occurrences of suicide andGooglesearches for ‘suicide’.Google
searches for the two terms are strongly correlated.
To investigate whether data fromGooglecan help us to estimate the number of suicide occurrences in England before official figures are released, we follow the findings of the previous studies and analyse data onGooglesearches for terms ‘depression’ and ‘suicide’. Figure depicts the search query time series. We find that both follow a very similar pat-tern in time (with a Pearson’s correlation of ., p< .). Both series are strongly autocorrelated (Q-test: see Table ), and are identified as non-stationary and unit root processes (KPSS and ADF tests: see Table ). From a methodological point of view, the presence of unit roots does not rule out a standard regression procedure, as long as both explanatory variables - in our case theGooglesearches - are unit root processes, which holds in our case [].
[image:7.595.159.435.319.377.2]theseGoogleterms. In addition to the correlation previously noted between theGoogle
searches, we find evidence of only a weak correlation between searches for ‘depression’ and suicide occurrences, and no correlation between searches for ‘suicide’ and the sui-cide data. This suggests two things. First, the information content of data on searches for the terms ‘depression’ and ‘suicide’ might be very similar. Second, there is either little value in the online data for estimating suicide rates, or the simple correlation analysis is insufficient. We therefore construct a model which goes beyond this simple correlation framework.
3.2 Models
As a base model, we create a model which controls for reported seasonal patterns in sui-cide occurrences and takes into account the most recent suisui-cide statistics at our disposal. We approximate the two year lag in the release of suicide statistics for England by assuming that at each point in time, the most recent data we have is for months ago. Specifically, we use a simple autoregressive model with the seasonal dummy variables specified in Eq. (). As we are working with data at monthly frequency, monthly seasonal dummies are utilised. For the autoregressive term, we use a time lag of months, to reflect the delay in data release. The ‘Googlemodel’ controls for the same factors as the base model but also incorporates data onGooglesearches for the terms ‘depression’ and ‘suicide’ (Eq. ()). Data on both terms are included at various lags, from to months, to account for both in-stantaneous as well as lagged effects. This allows us to investigate whether data onGoogle
searches at different lags may help us estimate suicide rates. Such a detailed analysis has not been performed for the suicide data in the literature yet.
Table summarises the important statistics of the estimated models. We observe that the base model performs reasonably well, with anR of .. This means that a simple
seasonal model can explain % of the total variation in suicide occurrences. We also re-port the results for a model withGooglesearches only, which is referred to as the ‘control model’. The control model outperforms the base model, with anRof .. However, the
improvement is limited.
In contrast, the completeGooglemodel (Eq. ()), where data on online searches enrich the base model, provides a more notable improvement, leading to an R of .. This
provides initial evidence that data on searches for these terms may help us estimate suicide rates before official data are released. Model improvement is demonstrated not only by an increase inR (. compared to .) but also by increases in adjustedR (R¯) which
accounts for the number of independent variables in the regression (. compared to .). Furthermore, the mean absolute percentage error (MAPE) of the model decreases from .% to .%.
Table 4 Model quality
R2 R¯2 MAPE RESET p-value
Base model 0.2263 0.1144 5.6401 0.1712 >0.1 Control model 0.2810 0.2326 5.8724 0.4308 >0.1
Googlemodel 0.4620 0.3362 4.9390 0.2473 >0.1
Google vs Base +0.2357 +0.2218 –0.7011 -
Table 5 Additional tests
J-B test p-value ARCH effect p-value CUSUM p-value
Base model 1.7621 >0.1 17.6826 >0.1 4.1902 <0.01
Control model 0.9725 >0.1 11.3692 >0.1 0.7985 >0.1
Googlemodel 0.2470 >0.1 9.9840 >0.1 0.2472 >0.1
The Jarque-Bera test checks normality of residuals, the ARCH effect test controls for conditional temporal heteroskedasticity in residuals and the CUSUM tests stability of the model across time. We find no evidence that the residuals are not normal, and no evidence of heteroskedasticity in the residuals. For the control model and theGooglemodel, we find no evidence that the parameters change across time, although this does not hold for the base model.
Table 6 Model improvement through inclusion ofGoogledata
Depression p-value Suicide p-value Joint p-value
4.7620 <0.01 7.9329 <0.01 5.6225 <0.01
AnF-test provides further evidence that data on searches for the terms ‘depression’ and ‘suicide’ help explain a significant proportion of variance in the suicide data.
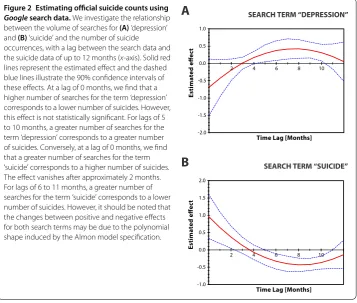
Figure 2 Estimating official suicide counts using Googlesearch data.We investigate the relationship between the volume of searches for(A)‘depression’ and(B)‘suicide’ and the number of suicide occurrences, with a lag between the search data and the suicide data of up to 12 months (x-axis). Solid red lines represent the estimated effect and the dashed blue lines illustrate the 90% confidence intervals of these effects. At a lag of 0 months, we find that a higher number of searches for the term ‘depression’ corresponds to a lower number of suicides. However, this effect is not statistically significant. For lags of 5 to 10 months, a greater number of searches for the term ‘depression’ corresponds to a greater number of suicides. Conversely, at a lag of 0 months, we find that a greater number of searches for the term ‘suicide’ corresponds to a higher number of suicides. The effect vanishes after approximately 2 months. For lags of 6 to 11 months, a greater number of searches for the term ‘suicide’ corresponds to a lower number of suicides. However, it should be noted that the changes between positive and negative effects for both search terms may be due to the polynomial shape induced by the Almon model specification.
All models pass the standard testing procedures, which are reported in Table and de-scribed in more detail in the Methods section. In addition, Table providesF-statistics and demonstrates that the data onGooglesearches add statistically significant explanatory power to the model. As a complementary analysis, we also perform a Likelihood Ratio (LR) test to compare the performance of the base model and theGooglemodel including data onGooglesearches for both the terms ‘depression’ and ‘suicide’. Again, we find that the
Googlemodel provides a better fit to the data (χ= .,df= ,p< .).
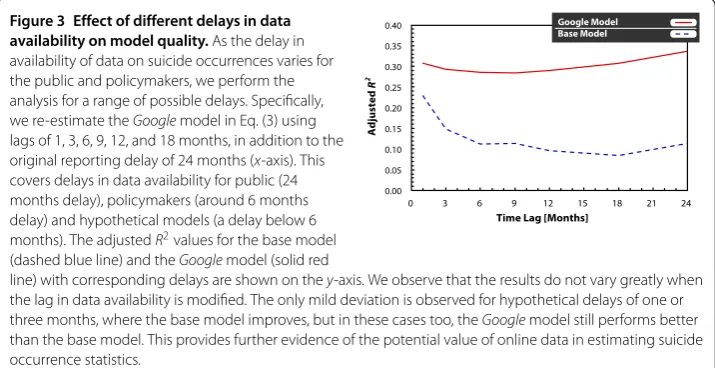
Figure 3 Effect of different delays in data availability on model quality.As the delay in availability of data on suicide occurrences varies for the public and policymakers, we perform the analysis for a range of possible delays. Specifically, we re-estimate theGooglemodel in Eq. (3) using lags of 1, 3, 6, 9, 12, and 18 months, in addition to the original reporting delay of 24 months (x-axis). This covers delays in data availability for public (24 months delay), policymakers (around 6 months delay) and hypothetical models (a delay below 6 months). The adjustedR2values for the base model (dashed blue line) and theGooglemodel (solid red
line) with corresponding delays are shown on they-axis. We observe that the results do not vary greatly when the lag in data availability is modified. The only mild deviation is observed for hypothetical delays of one or three months, where the base model improves, but in these cases too, theGooglemodel still performs better than the base model. This provides further evidence of the potential value of online data in estimating suicide occurrence statistics.
illustrates the interactions between theGoogle search data and data on suicide occur-rences implied by the Almon model (Eq. ()). We find that the relationship between the suicide data and search data for ‘depression’ is negative at lag zero and that it weakens with additional time lags, getting close to zero after approximately three months (Figure A). However, this pattern is not statistically significant. For lags of to months, a greater number of searches for the term ‘depression’ corresponds to a greater number of suicides. Conversely, we find that the relationship between the suicide occurrences and the ‘sui-cide’ search term is positive at the zero lag and the effect vanishes after approximately months. For lags of to months, a greater number of searches for the term ‘suicide’ cor-responds to a lower number of suicides. (Figure B). We note that the changes between positive and negative effects for both search terms may be due to the shape imposed by the Almon model specification. Note that qualitatively similar results hold even if data on the two search terms are included in the model separately, which implies that their conflict-ing behaviour is not caused by multicollinearity. Together, these results provide further evidence that monitoring of the number of suicide occurrences could potentially be im-proved using data on dynamics of the online searches, given that official suicide data for England are available only with a lag of two years.
As the delay varies for the public and for policymakers, we perform the analysis for var-ious delays.cSpecifically, we re-estimate theGooglemodel in Eq. () using lags of , , ,
, , and months in addition to the original reporting delay of months. This covers the data availability for public ( months delay), policymakers (around months delay) and hypothetical models (a delay below months). The adjusted coefficients of determi-nationR¯for the base and theGooglemodels with corresponding delays are summarised
in Figure . We observe that the results are very stable, and theGooglemodel provides a clear improvement for all delays, including hypothetical delay lengths below months. This provides further evidence of the value of the online search data in estimating suicide statistics for the most recent month.
3.3 Nowcasting analysis
Table 7 Nowcasting performance
Base model Googlemodel
Mean absolute error 29.559 15.059
Root mean squared error 41.564 34.59
Mean absolute percentage error 7.728 7.125
TheGooglemodel leads to lower errors than the base model, as evaluated by three different error metrics.
from , whereas online search data are available from only. As a result, our anal-ysis is limited to ten years of monthly data points, or data points. Up to this point, the results we have reported are all drawn from ‘in-sample’ analyses, where models are fitted to the full data set. However, the question remains as to whether a relationship be-tween online data and official statistics on suicides could be used in practice to estimate the number of suicide occurrences in the past month, before the official data are released with several months delay.
To investigate this, we perform a small nowcasting study using the available data, which as a by-product helps verify that our ‘in-sample’ results are not due to overfitting and non-stationarity of theGoogledata. In Table , we present statistics on the ‘out-of-sample’ performance of theGooglemodel compared to the base model. Both models are fitted using data gathered between and , and performance is tested for years and . We find that use of theGooglesearch data does indeed lead to lower errors in estimates, as evaluated using three different error metrics.
4 Discussion
Counts of the number of suicide occurrences in England are released with a delay of two years. Here, we investigate whether estimates of the number of suicide occurrences can be generated using data fromGooglesearches. We find that usingGoogledata, estimates of the number of suicides between and can be improved in comparison to estimates from previous suicide data alone.
Our findings are in line with the hypothesis that data onGooglesearches for ‘depression’ and ‘suicides’ may help improve estimates of the number of suicide occurrences in England before official figures are released. The results we report highlight the potential value of online communication data for creating new proxy measures of psychiatric illness across large populations.
Additional material
Additional file 1: Dataset.The dataset is provided in a comma separated value file (csv).
Competing interests
The authors declare that they have no competing interests.
Authors’ contributions
LK, HSM and TP have contributed to the manuscript equally. All authors read and approved the final manuscript.
Acknowledgements
The authors acknowledge funding from the Research Councils UK via Grant EP/K039830/1 and the Czech Science Foundation via Grant 16-00027S.
Data availability statement
Endnotes
a Monthly suicide occurrences are available at
https://www.ons.gov.uk/peoplepopulationandcommunity/birthsdeathsandmarriages/deaths/adhocs/ 005582numberofsuicidesbymonthofoccurrenceregionsofenglandandwales1981to2013. Occurrence counts are provided for regions of England, which we sum to get statistics for all of England. The complete dataset is attached as Additional file 1 - Dataset.
b In our analysis, we have evaluated polynomials up top= 4. Selection ofp= 2 provides the most stable results. c Interested readers are referred to the Statistical Bulletins of ONS at http://www.ons.gov.uk for comparison of the
reported delay and the actual data availability.
Received: 14 June 2016 Accepted: 29 October 2016
References
1. Barraclough B, Pallis D (1975) Depression followed by suicide: a comparison of depressed suicides with living depressives. Psychol Med 5:55-61
2. Pallis D, Barraclough B, Levely A, Jenkins J, Sainsbury P (1982) Estimating suicide risk among attempted suicides: I. The development of new clinical scales. Br J Psychiatry 141:37-44
3. Burk F, Kurz A, Moller H-J (1985) Suicide risk scales: do they help to predict suicidal behaviour? Eur Arch Psychiatr Neurol Sci 235:153-157
4. Kosky R, Silburn S, Zurbrick S (1990) Are children and adolescents who have suicidal thoughts different from those who attempt suicide? J Nerv Ment Dis 178:1-67
5. Loftin C, McDowall D, Wiersema B, Cottey T (1991) Effects of restrictive licensing of handguns on homicide and suicide in the District of Columbia. N Engl J Med 325:1615-1620
6. Hughes D (1996) Suicide and violence assessment in psychiatry. Gen Hosp Psych 18:416-421
7. Pirkis J, Burgess P, Meadows G, Dunt D (2001) Suicidal ideation and suicide attempts as predictors of mental health service use. Med J Aust 175:542-545
8. Rusch N, Zlati A, Black G, Thornicroft G (2014) Does the stigma of mental illness contribute to suicidality? Br J Psychiatry 205:257-259
9. Kolves K, De Leo D (2014) Suicide rates in children aged 10-14 years worldwide: changes in the past two decades. Br J Psychiatry 205:283-285
10. Schapiro M, Ahlburg D (1982) Suicide: the ultimate cost of unemployment. J Post Keynes Econ 5:276-280 11. Ahlburg D, Schapiro M (1984) Socioeconomic ramifications of changing cohort size: an analysis of U.S. postwar
suicide rates by age and sex. Demography 21:97-108
12. Wasserman I (1984) Imitation and suicide: a reexamination of the Werther effect. Am Sociol Rev 49:427-436 13. Platt S (1984) Unemployment and suicidal behaviour: a review of the literature. Soc Sci Med 19:93-115 14. Stack S, Haas A (1984) The effect of unemployment duration on national suicide rates: a time series analysis,
1948-1982. Sociol Focus 17:17-29
15. Stack S (1987) The effect of female participation in the labor force on suicide: a time series analysis, 1948-1980. Sociol Forum 2:257-277
16. Morrell S, Taylor R, Quine S, Kerr C (1993) Suicide and unemployment in Australia 1907-1990. Soc Sci Med 36:749-756 17. Linkov F, Bovbjerg DH, Freese KE, Ramanathan R, Eid GM, Gourash W (2014) Bariatric surgery interest around the
world: what Google Trends can teach us. Surg Obes Relat Dis 10:533-539
18. Telem DA, Pryor AD (2014) Google Trends: is it a real tool to predict the future of bariatric surgery or merely a marketing landmine? Surg Obes Relat Dis 10:538-539
19. McCallum ML, Bury GW (2013) Google search patterns suggest declining interest in the environment. Biodivers Conserv 22:1355-1367
20. Verissimo D, MacMillan DC, Smith RJ, Crees J, Davies ZG (2014) Has climate change taken prominence over biodiversity conservation? Bioscience 64:625-629
21. Polgreen PM, Chen Y, Pennock DM, Nelson FD, Weinstein RA (2008) Using Internet searches for influenza surveillance. Clin Infect Dis 47:1443-1448. http://cid.oxfordjournals.org/content/47/11/1443.full.pdf+html
22. Ginsberg J Mohebbi MH, Patel RS, Brammer L, Smolinski MS, Brilliant L (2009) Detecting influenza epidemics using search engine query data. Nature 457:1012-1014
23. Carneiro H, Mylonakis E (2009) Google Trends: a web-based tool for real-time surveillance of disease outbreaks. Clin Infect Dis 49:1557-1564
24. Seifter A, Schwarzwalder A, Geis K, Aucott J (2010) The utility of ‘Google Trends’ for epidemiological research: Lyme disease as an example. Geosp Health 4:135-137
25. Dugas A, Hsieh Y-H, Levin SR, Pines JM, Mareiniss DP, Mohareb A, Gaydos CA, Perl TM, Rothman RE (2012) Google Flu Trends: correlation with emergency department influenza rates and crowding metrics. Clin Infect Dis 54:463-469 26. Mocanu D, Baronchelli A, Perra N, Gonçalves B, Zhang Q, Vespignani A (2013) The Twitter of Babel: mapping world
languages through microblogging platforms. PLoS ONE 8:e61981
27. Metaxas PT, Mustafaraj E (2012) Social media and the elections. Science 338:472-473
28. Grabowicz PA, Ramasco JJ, Goncalves B, Eguiluz VM (2014) Entangling mobility and interactions in social media. PLoS ONE 9:e92196
29. Preis T, Reith D, Stanley HE (2010) Complex dynamics of our economic life on different scales: insights from search engine query data. Philos Trans R Soc A 368:5707-5719
30. Goel S, Hofman J, Lehaie S, Pennock DM, Watts DJ (2010) Predicting consumer behavior with Web search. Proc Natl Acad Sci USA 7:17486-17490
31. Vosen S, Schmidt T (2011) Forecasting private consumption: survey-based indicators vs. Google trends. J Forecast 30:565-578
33. Bordino I, Battiston S, Caldarelli G, Cristelli M, Ukkonen A, Weber I (2012) Web search queries can predict stock market volumes. PLoS ONE 7:e40014
34. Preis T, Moat HS, Stanley HE, Bishop SR (2012) Quantifying the advantage of looking forward. Sci Rep 2:350 35. Preis T, Moat HS, Stanley HE (2013) Quantifying trading behavior in financial markets using Google Trends. Sci Rep
3:1684
36. Kristoufek L (2013) Can Google Trends search queries contribute to risk diversification? Sci Rep 3:2713
37. Kristoufek L (2013) Bitcoin meets Google Trends and Wikipedia: quantifying the relationship between phenomena of the Internet era. Sci Rep 3:3415
38. Moat HS, Curme C, Avakian A, Kenett DY, Stanley HE, Preis T (2013) Quantifying Wikipedia usage patterns before stock market moves. Sci Rep 3:1801
39. Curme C, Preis T, Stanley HE, Moat HS (2014) Quantifying the semantics of search behavior before stock market moves. Proc Natl Acad Sci USA 111:11600-11605
40. Choi H, Varian H (2012) Predicting the present with Google Trends. Econ Rec 88:2-8
41. Botta F, Moat HS, Preis T (2015) Quantifying crowd size with mobile phone and Twitter data. R Soc Open Sci 2:150162 42. Barchiesi D, Moat HS, Alis C, Bishop S, Preis T (2015) Quantifying international travel flows using Flickr. PLoS ONE
10:e0128470
43. Barchiesi D, Preis T, Bishop S, Moat HS (2015) Modelling human mobility patterns using photographic data shared online. R Soc Open Sci 2:150046
44. Seresinhe CI, Preis T, Moat HS (2015) Quantifying the impact of scenic environments on health. Sci Rep 5:16899 45. Seresinhe CI, Preis T, Moat HS (2016) Quantifying the link between art and property prices in urban neighbourhoods.
R Soc Open Sci 3:160146
46. Preis T, Moat HS, Bishop SR, Treleaven P, Stanley HE (2013) Quantifying the digital traces of Hurricane Sandy on Flickr. Sci Rep 3:3141
47. Preis T, Moat HS (2014) Adaptive nowcasting of influenza outbreaks using Google searches. R Soc Open Sci 1:140095 48. Moat HS, Preis T, Olivola CY, Liu C, Chater N (2014) Using big data to predict collective behavior in the real world.
Behav Brain Sci 37:92-93
49. Garcia D, Tessone CJ, Mavrodiev P, Perony N (2014) The digital traces of bubbles: feedback cycles between socio-economic signals in the Bitcoin economy. J R Soc Interface 11:20140623
50. McCarthy MJ (2010) Internet monitoring of suicide risk in the population. J Affect Disord 122:277-279 51. Page A, Chang S-S, Gunnell D (2011) Surveillance of Australian suicidal behaviour using the Internet? Aust NZ J
Psychiatry 45:1020-1022
52. Sueki H (2011) Does the volume of Internet searches using suicide-related search terms influence the suicide death rate: data from 2004 to 2009 in Japan. Psychiatry Clin Neurosci 65:392-394
53. Yang AC, Tsa S-J, Huang NE, Peng C-K (2011) Association of Internet search trends with suicide death in Taipei City, Taiwan, 2004-2009. J Affect Disord 132:179-184
54. Hagihara A, Miyazaki S, Abe T (2012) Internet suicide searches and the incidence of suicide in young people in Japan. Eur Arch Psychiatry Clin Neurosci 262:39-46
55. Gun JF III, Lester D (2013) Using Google searches on the Internet to monitor suicidal behavior. J Affect Disord 148:411-412
56. Almon S (1965) The distributed lag model between capital appropriations and expenditures. Econometrica 33:178-196
57. Ramsey J (1969) Tests for specification errors in classical linear least squares regression analysis. J R Stat Soc B 31:350-371
58. Engle R (1982) Autoregressive conditional heteroskedasticity with estimates of the variance of United Kingdom inflation. Econometrica 50:987-1007
59. Arellano M (1987) Computing robust standard errors for withing-group estimators. Oxf Bull Econ Stat 49:431-434 60. Jarque C, Bera A (1980) Efficient tests for normality, homoskedasticity and serial independence of regression
residuals. Econ Lett 6:255-259
61. Barnard G (1959) Control charts and stochastic processes. J R Stat Soc B 21:239-271
62. Dickey D, Fuller W (1979) Distribution of the estimators for autoregressive time series with a unit root. J Am Stat Assoc 74:427-431
63. Kwiatkowski D, Phillips P, Schmidt P, Shin Y (1992) Testing the null of stationarity against alternative of a unit root: how sure are we that the economic time series have a unit root? J Econom 54:159-178
64. Engle R, Granger C (1987) Co-integration and error correction: representation, estimation and testing. Econometrica 55:251-276