http://wrap.warwick.ac.uk/
Original citation:
Cagno, Enrico, Masi, Donato and Leão, Celina Pinto. (2015) Drivers for OSH
interventions in small and medium-sized enterprises. International Journal of
Occupational Safety and Ergonomics . p. 19.
http://dx.doi.org/10.1080/10803548.2015.1117351
Permanent WRAP url:
http://wrap.warwick.ac.uk/75899
Copyright and reuse:
The Warwick Research Archive Portal (WRAP) makes this work of researchers of the
University of Warwick available open access under the following conditions. Copyright ©
and all moral rights to the version of the paper presented here belong to the individual
author(s) and/or other copyright owners. To the extent reasonable and practicable the
material made available in WRAP has been checked for eligibility before being made
available.
Copies of full items can be used for personal research or study, educational, or
not-for-profit purposes without prior permission or charge. Provided that the authors, title and
full bibliographic details are credited, a hyperlink and/or URL is given for the original
metadata page and the content is not changed in any way.
Publisher statement:
"This is an Accepted Manuscript of an article published by Taylor & Francis Group in
International Journal of Occupational Safety and Ergonomics on 14/12/2015, available
online:
http://www.tandfonline.com/10.1080/10803548.2015.1117351
.
A note on versions:
The version presented here may differ from the published version or, version of record, if
you wish to cite this item you are advised to consult the publisher’s version. Please see
the ‘permanent WRAP url’ above for details on accessing the published version and note
that access may require a subscription.
Drivers for OSH Interventions in Small and Medium-sized
Enterprises
Enrico Cagno a, Donato Masi a, c, Celina Pinto Leão b
a Department of Management, Economics and Industrial Engineering, Politecnico di Milano, Italy
b Department of Production and Systems, University of Minho, Portugal
Abstract: The debate concerning occupational safety and health (OSH) interventions has recently focused on the need of improving the evaluation of interventions, and in particular on the need of providing information about why the intervention worked or not, under what circumstances, and in which context. Key concepts in the analysis of the context are the drivers, i.e., those factors enabling, fostering, or facilitating OSH interventions. However, the concept of driver for an OSH intervention is both confused and contested. Although the term is widely used, there is little consensus on how drivers should be understood, how important they are in different contexts, and how they can facilitate interventions. This exploratory study based on interviews with the owner-managers and the safety officers of small- and medium-sized enterprises (SMEs) gives an overview of the most characteristic drivers for OSH interventions. The results will be used to make an initial evaluation of SMEs needs, and will help orient interventions and future research.
Keywords: OSH interventions, drivers, SMEs, empirical investigation.
Correspondence should be sent to Enrico Cagno, Department of Management, Economics and Industrial Engineering, Politecnico di Milano, Via Lambruschini 4/b, 20156 Milan, Italy. E-mail: [email protected].
1. Introduction
Smaller enterprises constitute a major challenge for the society’s effort to improve occupational safety and health (OSH) as they, on one hand, have extensive needs, and on the other hand, are difficult to improve. Regulators, practitioners, and researchers have therefore looked into the possibilities of designing interventions which meet the specific needs of small enterprises [1, 2]. These interventions focus on developing engineering strategies that decrease the probability of an employee engaging in at-risk behaviours (see, e.g., [3-5]), on educating and training employees regarding equipment, environmental hazards, policies and procedures (see, e.g., [6-8]), and on enforcing the safety related policies and procedures (see, e.g., [9, 10]). The proposed intervention strategies are more difficult to apply in small- and medium-sized enterprises (SMEs) for different reasons. It is firstly possible to consider the scarcity with regard to large enterprises of human, economic and technological resources [11, 12]. From another point of view, some papers [1, 2] focused on the lack of capacity of small enterprises to assess and control risks in an effective way. It is so generally agreed that it is necessary to tailor interventions to the specific needs and context of small enterprises. However, there are only limited discussions in the literature about how to carry out such tailoring.
In the light of these challenges, contextual factors play a decisive role. Indeed, contextual factors are crucial in designing interventions which meet the specific needs of small enterprises, and it might be a moot point to isolate intervention and outcome from contextual influences, when it comes to organizational research [13, 14]. A new stream of research is so growing, in which several models have been proposed to characterize the intervention process and its context [15].
In this respect, an effective description of the context could be provided by the analysis of barriers and drivers [16]: barriers and drivers identify all those factors of context not directly involved in workplace safety intervention, but significantly affecting, respectively hindering and fostering, the outcome of interventions. Quite often drivers and barriers are simply seen as points on a continuum. For instance, high worker engagement can be seen as a driver of interventions, while low worker engagement can be seen as a barrier. However, practitioners experience factors not as a continuum, but as separated factors with a different impact on interventions [16]. As a consequence, in order to match the perception of practitioners, it is convenient to investigate separately the negative and the positive factors, namely the barriers and the drivers. This paper focuses mainly on drivers, which actively contribute to the design of OSH policies at different levels. A previous paper [17] focused on barriers, which inhibit the process of OSH intervention.
The existing literature dealing with drivers to OSH interventions shows three main gaps. First, existing studies are usually specific, while a comprehensive classification of drivers to the intervention process is still missing. Second, little empirical investigation has been carried out figuring out the intensity of the drivers in the enterprises, and in particular in the context of SMEs. Third, the few existing empirical investigations have considered SMEs as a whole, thus neglecting the strong possible differences existing, e.g., between a micro enterprise and a medium-large enterprise. In other words, although the debate concerning the size of the enterprises and their corresponding safety performance is growing, very little attention is paid to
the difference between the micro- (MiEs, employees < 10), the small- (SEs, 10 ⩽ employees < 50), and the medium-sized
enterprises (MEs, 50 ⩽ employees < 250), as defined in the 2003/361/EC Recommendation; in the majority of the cases,
SMEs are bundled together and considered as a whole, in opposition to the large enterprises [11]. In the same way, the effect on the perceived drivers of the phase of the intervention process or the firm’s industrial sector is neglected.
In the light of the foregoing, this study carried out exploratory research in order to produce a first picture of drivers for OSH interventions in SMEs. More specifically, our research described the drivers to OSH interventions in SMEs and explored their relevance in different contexts and situations. The paper is structured as follows: in section 2, an overview of the literature on drivers for OSH interventions in SMEs is provided. In section 3, the analysis of the frequency of drivers in SMEs is presented. Finally, in section 4, conclusions are taken.
2. Drivers to OSH Interventions in SMEs: an overview of the literature
In order to describe the likely drivers to OSH interventions in SMEs, the authors reviewed the related literature. The review of the literature has been conducted using a wide perspective. The keywords were “interventions” and “workplace safety” combined with “drivers” and other synonyms. In some cases, papers dealing with relevant factors for OSH performance have been considered, since a positive performance of the company with respect to some of the factors could be seen as a driver. The research was conducted in databases (e.g., SCOPUS, Web of Knowledge), and Science Search Engines (e.g., IEEE Xplore, Google Scholar). At the end of the process, twelve papers focusing on drivers and strictly related topics have been included in the review. Once the most relevant studies had been identified, a cross cut analysis has been performed with the aim of producing definitions suited for the empirical investigation in SMEs. The cross cut analysis has been conducted in parallel with extensive discussions with five safety officers from SMEs; these discussions had the purpose of identifying the proper level of detail of definitions, as well as the optimal way of cutting generic concepts. Overlapping and related drivers have been grouped within a unique definition, while too generic drivers have been split in different drivers. At the end of this process, seventeen likely drivers have been identified and defined. The review of the literature and the results of the cross cut analysis are presented in this section.
for the modification or installation of plant and equipment, training and behavioural changes. The factors of the external and internal context are decisive for the outcome of an intervention, and therefore they must be considered during design, implementation and evaluation of intervention [14]. An essential part of the context is described by drivers.
Drivers are defined as the set of internal and external factors influencing the process of intervention, fostering it [18]. Several studies originating from different perspectives can be identified in the literature.
Vecchio-Sadus and Griffiths [19] observe how the improvements in workplace safety culture require management commitment and employee involvement. They outline different drivers influencing management commitment and employee involvement such as marketing tools and effective communication strategies. Hale et al. [20] analyse compare successful and not successful interventions and they conclude that interventions bringing about constructive dialogue between shop-floor and line management, providing motivation to line managers and strengthening the monitoring and learning loops in the safety management system appear more successful. Other distinguishing factor are the amount of energy and creativity injected by top managers and by the coordinator. Walker and Tait [21] study an approach helping SEs to set up a simple health and safety management system and they identify several drivers of success among which the low-cost approach and collaboration with local authorities, suppliers, commercial training organisations, and internal trainers. Pransky et al. [22] analyses the role of safety incentive programs on under-reporting and he conclude that the most effective programs are characterised by a clear statement about the goals and methods of the program, by reliance on appropriate, fair and objective measures and by giving the means to achieve reasonable target performance levels. The use of incentive programs. However, poses some challenges; e.g., Gangwar and Goodrum [23] focus on safety incentive programs in the US construction industry and they discover that the effectiveness of safety incentive programs diminishes with time. Other authors underline how the sharing of knowledge is an important driver for the improvement of OSH, and they suggest the introduction of knowledge networking approaches [24] or in the transfer of good practices among different enterprises working in the same field [25]. Tait and Walker [26] analyse OSH award schemes and they conclude that the participation in these schemes is clearly of help to medium and large organizations in managing OSH; important mediating factors are the higher motivation of employees, the improved business activities, and the enhanced image and reputation of the company. Kogi [27] discusses the types of effective support for participatory programs for OSH risk reduction and he observes how the described processes are facilitated by the use of locally adjusted training tools such as local good examples, action checklists, and group work methods. Cagno et al. [28] suggest to develop a software with a web-based interface capable of supporting SMEs in their safety management activities through the exchange of safety-related data and information and of certain management parameters of the enterprise. Hasle and Limborg [2] review the literature on preventive OSH activities in SEs and they analyse the role of intermediaries - such as occupational health services, insurance companies, labour unions, accountants and public authorities - in SEs. They conclude that in order to support OSH activities the personal contact between an intermediary and the SE is a more effectual and costly method with respect to written information. The role of intermediaries has also been studied by Antonnson et al. [29], and they underline it is of great interest to study the intermediaries. The study also produces a list of health and safety regulations relevant for small business, underlying how in some cases SMEs have difficulties in complying with these regulations. Sims [30] investigates the effects of internal firm characteristics and external incentives on hazard abatement and he argues that the effects of external incentives are in some cases controversial; as for the internal characteristics of the firms, he lists some factors which play critical roles in the decision to abate hazards in the workplace, namely the hazard management capabilities of the firm, the extent of management concern for OSH issues, and the cost of managing employees in the presence of hazards. The cross cut analysis of the above-presented studies and the discussions with SMEs’ practitioners gave origin to the following seventeen drivers (Table 1) and to the related definitions. In Table 2, the relationship between the seventeen drivers and the studies of the literature is presented.
xxxxxxxxxxxxxxxxxxxxxxxxxxxxxxxxxxxxxxxxxxxxxxxxxxxxxxxxxxxxxxxxxxxxxxxxxxxxxxxxxxxxxxxxxxxxxxxxxxxxxxxxx
Take in Table 1
xxxxxxxxxxxxxxxxxxxxxxxxxxxxxxxxxxxxxxxxxxxxxxxxxxxxxxxxxxxxxxxxxxxxxxxxxxxxxxxxxxxxxxxxxxxxxxxxxxxxxxxxx
xxxxxxxxxxxxxxxxxxxxxxxxxxxxxxxxxxxxxxxxxxxxxxxxxxxxxxxxxxxxxxxxxxxxxxxxxxxxxxxxxxxxxxxxxxxxxxxxxxxxxxxxx
Take in Table 2
xxxxxxxxxxxxxxxxxxxxxxxxxxxxxxxxxxxxxxxxxxxxxxxxxxxxxxxxxxxxxxxxxxxxxxxxxxxxxxxxxxxxxxxxxxxxxxxxxxxxxxxxx
In the light of the above literature overview, the authors decided to carry out exploratory research in order to produce a first picture of drivers to OSH interventions in SMEs. The authors retained SMEs for the exploratory study because of the high concentration of SMEs in the European Union zone – SMEs account for 99.8% of non-financial enterprises in 2012, which equates to 20.7 million businesses [31] – and because of the high average risk level, especially in the metal products sector [32]. More specifically, the analysis has been performed firstly taking into account the total sample (3.2), and then considering how the phase of the intervention process (3.3), the firm’s size (3.4), and the firm’s industrial sector (3.5) can affect drivers. These analyses are presented in the following sections.
3.1. Research methodology
Between April and July 2012, the authors contacted by phone the owners of several SMEs and asked their availability to participate to the research. Fifty-eight owners accepted, a questionnaire was previously sent to their companies by e-mail and then an appointment for a telephone interview was fixed. The questionnaire was addressed to the safety officers (which in some limited cases corresponded with the owner-manager and which, in all the cases, had a relevant experience in the role), and they had one or two days to properly analyse the questions and to think to the answers. The questionnaire was divided into two sections: (a) enterprise characteristics (sector, number of employees, turnover, interviewees’ role, etc.), (b) perceived intensity for each driver included in the proposed overview, considering separately the three phases of the interventions process: design, implementation, and evaluation. The questions did not aim at investigating the perceived intensity of drivers for a particular intervention, but an average value based on the experience and on the expertise of practitioners. In order to ensure that the judgments about each stage were as independent as possible, we firstly investigated all the drivers for the design, then for the implementation and finally for the evaluation. We acknowledge that the three phases are logically and temporally related; however the hypothesis of the research is that although related, some drivers could be more critical in specific phases of the intervention process. In order to be sure of the comprehensiveness of the analysis, after having analysed the drivers included in the theoretical overview, we asked to indicate any other perceived driver that had not been included. In some cases the interviewees proposed other factors, but after a discussion they agreed that these factors were already included in some of the drivers proposed in the theoretical overview. In the light of the noticeable experience of the interviewees in their role, a good feedback of the comprehensiveness of the analysis has been obtained.
A 3-point Likert scale was used, with 0 = absence of the driver, 1 = the perception of the driver with a Low (L) intensity, and 2 = the
perception of the driver with a High (H) intensity.
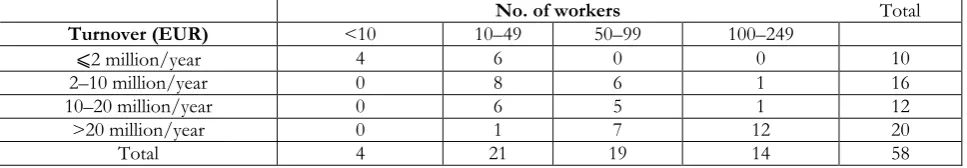
The distribution of sample firms by industry sectors is summarised in Table 3, while the distribution of sample firms by turnover and number or workers is summarised in Table 4. The SMEs – as defined in the 2003/361/EC Recommendation [33] – mainly belong to the most important sectors of the Lombardy Region in Italy in terms of employees and turnover and they have been classified according to the International Standard Industrial Classification of All Economic Activities ISIC rev.4, as reported in Table 3. As it can be argued from Table 4, the SMEs have been divided into 4 classes: MiEs (employees
< 10), SEs (10 ⩽ employees < 50), MSEs (50 ⩽ employees < 100), and MLEs (100 ⩽ employees < 250). This classification
differs from the one proposed by the European Commission as it introduces an additional class, i.e., the medium-sized enterprises (MEs) class has been divided into two sub classes (MSEs and MLEs). As a matter of fact, considering the organizational processes within SMEs, there might be a difference in their behaviour, as observed in other issues, e.g., energy efficiency [34].
The sample is not necessarily representative of all the firms in the sectors, and this introduces certain limitations in terms of generalization of results. The small size of the sample, coupled with the fact that the data obtained in telephone interviews were not validated in the field or through interviews with employees, also limits the scope of the results. Even so, the findings can be used as a pilot to orient future research and OSH interventions.
The data were compiled and analysed using the Microsoft Excel and SPSS 22.0. Frequency distributions tables referred to the total sample were produced first. These tables were then compared with a set of descriptive variables corresponding to other characteristics of the firms and of the interventions process. Three variables, i.e., phase of the intervention process, firm’s
size, and firm’s industrial sector were selected to provide an overall description of the dynamics of drivers in SMEs. The χ2
test for independence was used as a test for statistical significance due to the nature of the variable in study, nominal (or
categorical) variables. When the χ2 test was significant, the post-hoc Bonferroni correlation test with pairwise comparisons
was performed exploring the data further. For the statistical analysis a significance level of 5% was used.
xxxxxxxxxxxxxxxxxxxxxxxxxxxxxxxxxxxxxxxxxxxxxxxxxxxxxxxxxxxxxxxxxxxxxxxxxxxxxxxxxxxxxxxxxxxxxxxxxxxxxxxxx
Take in Table 3
xxxxxxxxxxxxxxxxxxxxxxxxxxxxxxxxxxxxxxxxxxxxxxxxxxxxxxxxxxxxxxxxxxxxxxxxxxxxxxxxxxxxxxxxxxxxxxxxxxxxxxxxx
Take in Table 4
xxxxxxxxxxxxxxxxxxxxxxxxxxxxxxxxxxxxxxxxxxxxxxxxxxxxxxxxxxxxxxxxxxxxxxxxxxxxxxxxxxxxxxxxxxxxxxxxxxxxxxxxx
Using those responses, four main different analyses have been carries out: frequency and intensity of drivers in the total sample, Effect of the phase of the intervention process, Effect of the firm’s size, and Effect of the sector.
3.2. The total sample
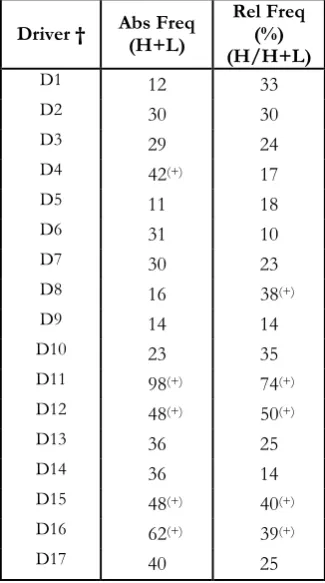
The frequency and the intensity of the drivers detected on the whole sample are reported in Table 5. The second column of Table 5 reports the absolute frequency of the drivers with intensity both high and low (Abs Freq (H+L)), i.e., the number of 1 and 2 in the answers to the questionnaires. It has been used because of the relatively small size of the sample, as to better clarify the number of answers taken into account for the analysis. Since there are 58 questionnaires, and each driver could be detected during three phases (design, implementation, and evaluation), the highest possible absolute frequency for each driver is 174 (i.e., 58 × 3). The third column of Table 5 reports the relative frequency of drivers perceived with a high intensity normalised by the absolute frequency of drivers with intensity both high and low (Rel Freq (H/H+L) = Abs Freq (H)/Abs Freq (H/L)), i.e., the number of 2 in the answers to the questionnaires, divided by the number of 1 and 2 in the answers to the questionnaires.
xxxxxxxxxxxxxxxxxxxxxxxxxxxxxxxxxxxxxxxxxxxxxxxxxxxxxxxxxxxxxxxxxxxxxxxxxxxxxxxxxxxxxxxxxxxxxxxxxxxxxxxxx
Take in Table 5
xxxxxxxxxxxxxxxxxxxxxxxxxxxxxxxxxxxxxxxxxxxxxxxxxxxxxxxxxxxxxxxxxxxxxxxxxxxxxxxxxxxxxxxxxxxxxxxxxxxxxxxxx
Analysing the distribution of the frequencies of the drivers, the 6 most frequent are the External support of consultants (D11), the Availability of Knowledge of effective interventions (D16), the Collaborations with associations and networks of
companies (D12), the ICT (information and communication technology) tools supporting OSH interventions (D15), the Reduction
of the insurance premium by the national compensation authority (D4), and collaboration with other stakeholders (D17). It is firstly possible to observe the relevant role played by intermediaries, since 3 of the 5 most perceived drivers - External support of consultants (D11), Collaborations with associations and networks of companies (D12), and Reduction of the insurance premium by the national compensation authority (D4) - deal with intermediaries. The relevance of intermediaries for OSH has been already underlined in the literature [2]; the frequency and the intensity of the drivers related to intermediaries give the opportunity of understanding the relative importance for SMEs of the different kinds of intermediaries.
The most perceived driver is the External support of consultants (D11). The relevance of this driver can be related to several causes. First, several SMEs do not hold an inner OSH function, and they commit OSH management to external consultant. In these cases, it is possible to hypothesise that external consultants are the main promoters of OSH interventions, as well as the main source of knowledge and guidance for their proper implementation. Second, OSH interventions suggested by consultants are suited to the features of the companies, while interventions promoted by other intermediaries such as control authorities or associations are – or should be – more general and so less effective for SMEs: indeed, the characteristics of SMEs are so different that it is terribly difficult for these general preventive efforts to reach all SMEs and become effective [28, 35]. This driver is often (in 74% of the cases) perceived with a high intensity. This result is an indicator of the effectiveness of the driver; indeed the simple high frequency could be related to the lack of alternative measures or to the simplicity of use of this driver. Because of this effectiveness, this driver should be recommended and promoted among SMEs. In the light of the importance consultants for SMEs, there are several questions that should be carefully considered by researchers. First, the effectiveness of the methods adopted by consultants, second, the special qualification needed [36], and third, how to organize the contact in a cost effective way [2].
proven effectiveness cannot be directly re-applied in SMEs because different contexts and features of the enterprise could alter the outcome of the intervention itself. The mediating role of consultants and safety officers is always needed in order to re-use previous knowledge.
The third most perceived driver is the Collaborations with associations and networks of companies (D12). This driver covers a broad range of possibilities. Examples of collaboration are the sharing of information [27, 28], but also in the sharing of human and economic resources, more and more promoted in fields like the eco-efficiency [39]. Associations and networks of companies are another kind of intermediaries, which play an essential role for SMEs, as previously stated. Associations and networks of companies have a relevant role for different reasons. First, when SMEs request interventions to central or local authorities: the isolated enterprises will likely not be able to influence these authorities, while the influence of associations and networks is obviously stronger. In all the cases in which interventions form external authorities are essential for the improvement of OSH conditions, the relevance of this driver is so clear. Second, in several cases the use of consultants is not cost effective. A meaningful example is represented by training interventions related, e.g., to new laws and regulations. The interventions are exactly the same for lot of enterprises and so it can be more effectively provided by an association instead of being implemented by the companies separately. This driver is often (in 50% of the cases) perceived with a high intensity, thus demonstrating that for the all the above-mentioned cases associations and networks of companies are as effective as consultants in the improvement of OSH conditions.
The fourth most perceived driver is ICT tools supporting OSH interventions (D15). This driver is important for two different reasons: first, it is important in all the interventions based on a flow of information; second, it can reinforce the effect of other drivers using information. Examples of drivers that could be reinforced by ICT tools are the availability of knowledge of effective interventions (D16) previously described and Collaborations with associations and networks of companies (D12), since the collaboration could include the sharing of information.
The fifth most perceived driver is the Reduction of the insurance premium by the national compensation authority (D4). It is possible to do several observations. First, it is interesting to notice how this economic support is one of the most perceived driver, but only the fifth one and moreover the intensity perceived for this driver is generally low. This seem to confirm some studies focusing on barriers to OSH interventions [16, 17], that include the lack of resources among barriers to OSH interventions but not among the most perceived ones. This result suggest that the economic support for OSH is an useful measure which however should be provided in conjunction with other measures, aiming, e.g., at improving the awareness of SMEs or the effectiveness of the tools used for the implementation of interventions. Second, it is possible to notice how the Reduction of the insurance premium by the national compensation authority (D4) recurs with an higher frequency with respect to other economic incentives, such as Rewards, bonuses and awards from the company (D1), Monetary incentives from central or local authorities (D2), Reduction of fees for deserving companies (D3). This result could be related to a distortion in the perception of practitioners. Indeed, while the incentives proposed by the driver D4 have been experiences by practitioners of Italian SMEs, the other drivers (D1-D2-D3) have been rarely experienced in Italian SMEs, and so practitioners tend to neglect their relevance. Moreover, it has to be considered that according to a common vision OSH is considered only as a cost, and so it is difficult that practitioners connect OSH to other economic areas of the company, such as the investments and the related credit availability. These considerations suggest that apart from introducing economic incentives in conjunction with other measures, practitioners should be made aware of the economic advantages of OSH [40] and consequently of the possibility of asking for different new economic incentives.
The sixth most perceived driver is related to the Collaboration with other stakeholders (D17) such as customers, contractors, and suppliers. This driver bears a particular relevance firstly when the enterprise is responsible for the safety of these external actors: e.g., when contractors work in a yard managed by the enterprise. The improvement of the safety conditions of these external workers is strongly dependent on their collaboration. Other cases in which this driver plays a relevant role arise when a supplier provides machinery that is critical for OSH: the supplier has to clearly communicate the features of the machinery and he has to collaborate with the enterprise in order to ensure its proper use.
3.3. Effect of the phase of the intervention process
The effect of the phase of the intervention process on the frequency and intensity of the drivers is reported in Table 6. For each phase, two columns are presented. The first column reports the absolute frequency of the drivers (Abs Freq (H+L)), i.e., the number of 1 and 2 detected for the particular phase (since there are 58 questionnaires, the highest possible absolute frequency for the particular phase is 58); and an asterisk indicates that the driver is detected mainly (i.e., >45% of the times for the whole intervention process) in that particular phase. The second column reports the relative frequency of the drivers perceived with a high intensity normalised by the absolute frequency (Rel Freq (H/H+L)), i.e., the number of 2, divided by the number of 1 and 2 in that particular phase; an asterisk indicates that the difference between the relative frequency of drivers in the particular phase and in the total sample is >20%.
xxxxxxxxxxxxxxxxxxxxxxxxxxxxxxxxxxxxxxxxxxxxxxxxxxxxxxxxxxxxxxxxxxxxxxxxxxxxxxxxxxxxxxxxxxxxxxxxxxxxxxxxx
xxxxxxxxxxxxxxxxxxxxxxxxxxxxxxxxxxxxxxxxxxxxxxxxxxxxxxxxxxxxxxxxxxxxxxxxxxxxxxxxxxxxxxxxxxxxxxxxxxxxxxxxx
If we compare the design, implementation and evaluation phases, it is possible to observe that the drivers are mainly concentrated in the design and implementation phases. Even considering the overall mean of the intensity across all 17 drivers
obtained: Design phase, 0.40 (SD = 0.31); Implementation, 0.27 (SD = 0.20); and Evaluation, 0.17 (SD = 0.16), this behaviour
remains. There was a statistically significant difference in the intensity of the drivers depending on the phase, χ2(2) = 16.69, p
< 0.001. Post hoc analysis with Wilcoxon signed-rank tests was conducted with a Bonferroni correction applied, resulting in
a significance level set at p = 0.017 (0.05/3). Median (IQR) intensity for the Design, Implementation and Evaluation phase
were 0.26 (0.17 to 0.53), 0.22 (0.14 to 0.31) and 0.12 (0.06 to 0.20), respectively. Despite the overall reduction in intensity in
the Design vs. Implementation (Z = –2.18, p = 0.03) there were no significant difference. However, there was statistically
significant reduction on intensity for Evaluation vs. Design (Z = –3.58, p < 0.001) and for Evaluation vs. Implementation (Z
= –2.43, p = 0.015).
This result was easy predictable, and can be related to different causes. First, the most critical phases from the point of view of time and resources required are the design and the implementation of interventions. As a consequence, practitioners give mainly attention to these phases and tend to perceive the effect of drivers mainly in these phases. Second, in several SMEs the evaluation of interventions is rarely performed or, at most, it is performed by external actors. As a consequence, it is possible to imagine that there are drivers which have an effect mainly in the evaluation of interventions, but whose effect is underestimated by practitioners.
The most frequent drivers during the design of interventions are the external support of consultants (D11), the Availability of Knowledge of effective interventions (D16), the ICT tools supporting OSH interventions (D15), the Collaborations with associations and networks of companies (D12), the Training programs for SMEs (D13), and the Collaboration with other stakeholders (D17). The main difference with respect to the total sample is the relative higher importance given to the Training programs for SMEs (D13), and the relative lower importance given to the Reduction of the insurance premium by the national compensation authority (D4). This result was easy predictable, since during the design of intervention the knowledge plays an essential role, while the economic drivers are mainly important in other phases of the intervention process such as the implementation. It is possible to notice a high concentration of drivers detected mainly in the design phase (all the drivers D10–D17). This result suggests that the design of interventions is particularly critical for SMEs, as previously underlined in the literature [41], and that SMEs need the support of external actors mainly during the design of interventions. Such a consideration is also confirmed by the relative distribution of the perceived drivers among the phases; it is possible to notice that all the drivers related to external actors (D10 D11 D12 D17) and to communication and knowledge (D13 D14 D15 D16) are concentrated in the design phase.
The most frequent drivers during the implementation of interventions are the external support of consultants (D11), the Collaborations with associations and networks of companies (D12), the Availability of Knowledge of effective interventions (D16), the Collaboration with other stakeholders (customers, contractors, and suppliers) (D17), the Monetary incentives from central or local authorities (D2), and the Reduction of the insurance premium by the national compensation authority (D4). The main difference with respect to the Absolute frequency and intensity is the presence of another economic driver among the most perceived, related to monetary incentives from central or local authorities (D2). It is interesting to notice that when the importance of economic incentives is higher, namely during the implementation of interventions, another kind of economic drivers such as the Monetary incentives from central or local authorities (D2) are among the drivers most perceived by practitioners.
If we have a look at the drivers often perceived with a high intensity, a noticeable result is the high intensity given to Sanctions by control authorities (D7), to ICT tools (D15) and to Knowledge of effective interventions (D16) during the evaluation of interventions. The importance given to these drivers clearly underlines the main reasons leading SMEs’ practitioners to evaluate OSH interventions: the demonstration of compliance with regulations (D7) and the re-use of previous knowledge (D15 and D16). Although the demonstration of compliance can strongly motivate practitioners to perform the evaluation of interventions, practitioners should be made aware of the several advantages of properly evaluating OSH interventions (Robson et al., 2001). Indeed, an evaluation only driven by the demonstration of compliance could be distorted, and could neglect important factors only because they are not explicitly mentioned by regulations. The evaluation of OSH interventions should be always methodologically correct and consistent [42], while matching the requirements of regulation. The importance given to the drivers D15 and D16 demonstrate how the management of knowledge in among the criticalities encountered by SMEs, and it suggests that ICT tools should be intensely used for the improvement of the evaluation, often neglected or not properly performed in SMEs.
3.4. Effect of the firm’s size
The Effect of the firm’s size on the frequency of drivers is presented in Table 7. The companies of the sample have been
grouped into 4 classes: MiEs (employees < 10), SEs (10 ⩽ employees < 50), MSEs (50 ⩽ employees < 100), and MLEs (100
⩽ employees < 250). For each dimensional class, two columns are presented. The first column reports the frequency of the
it comparable, it was normalised with the number of enterprises in that particular dimensional class. The value used for the normalization of the relative frequency is 12 (4 × 3) for MiEs, 63 (21 × 3) for SEs, 57 (19 × 3) for MSEs, and 42 (14 × 3) for MLEs. An asterisk indicates that the frequency of the driver has a great variation (i.e., >55%) with respect to the correspondent value detected for the total sample. The second column reports the relative frequency of drivers perceived with a high intensity normalised by the absolute frequency of drivers with intensity both high and low (Rel Freq (H/H+L)) in that dimensional class. An asterisk indicates that the difference between the relative frequency of drivers for the particular dimensional class and in the total sample is >20%. The relative frequency of the drivers detected for the total sample has been reported in the third column, in order to easily compare these values with the ones detected in the different dimensional classes.
xxxxxxxxxxxxxxxxxxxxxxxxxxxxxxxxxxxxxxxxxxxxxxxxxxxxxxxxxxxxxxxxxxxxxxxxxxxxxxxxxxxxxxxxxxxxxxxxxxxxxxxxx
Take in Table 7
xxxxxxxxxxxxxxxxxxxxxxxxxxxxxxxxxxxxxxxxxxxxxxxxxxxxxxxxxxxxxxxxxxxxxxxxxxxxxxxxxxxxxxxxxxxxxxxxxxxxxxxxx
As for MiEs, it has firstly to be underlined how the results are distorted by the small dimensions of the sample, made up only by 4 companies. This distortion is mainly relevant for the results related to the intensity of the drivers: the high intensity related to the drivers D1, D2, and D9, as well as the low intensity related to the drivers D3-9 is not meaningful, since these drivers were perceived only one time. It is possible to do some general considerations relative to the relevance of intermediaries (D10, D11, and D12) and of knowledge (D13, D15, and D16). The relevance detected for the total sample is confirmed also for MiEs; it is interesting to notice how, differently from the total sample, the drivers related to the knowledge (D15 and D16) are more frequent with respect to the drivers related to intermediaries (D11 and D12). This result could be related to the difficulty of involving MiEs in associations and to the lack of resources that renders difficult the collaboration with consultants.
There was a statistically significant effect of drivers for firm size, χ2(3) = 11.89, p = 0.008. Post hoc analysis with Wilcoxon
signed-rank tests was conducted with a Bonferroni correction applied, resulting in a significance level set at p = 0.008 (0.05/6).
There were statistically significant reductions on intensity for SEs vs. MiEs (Z = –2.79, p = 0.005) and for MLEs vs. SEs (Z
= –2.87, p = 0.004). The behaviour of SEs and MSEs is similar (Z = –1.75, p = 0.080). The relevance of drivers related to
intermediaries and to knowledge, already detected for the total sample, is confirmed. However, there are some noticeable results. The Collaborations with associations and networks of companies (D12) is more frequently perceived in SEs and less perceived in MSEs than in the total sample. Moreover, in SEs this driver is perceived with a high intensity in the 54% of the cases. The high relevance of associations in SEs could be associated to a combination among different factors determining the resort to consultants or to associations. Indeed, enterprises resort to intermediaries considering on the one hand their needs and on the other the available resources. Both the needs and the available resources are generally growing with the size of the company. It is possible to make the hypothesis that a balance between needs and available resources renders the use of associations particularly efficient and effective for SEs, while in MSEs more complex need and the more available resources render more appropriate an “internal” management of safety, thus reducing the relevance of associations.
In MSEs and MLEs drivers related to knowledge and to the support of intermediaries (D10 up to D17) still recur with high frequencies; however drivers related to economic resources acquire a higher relevance, as demonstrated by the intensity of drivers D2 and D3. This result can be related to higher awareness towards safety issues and to the higher awareness of the economic relevance of OSH that characterize MSEs.
3.5. Effect of the sector
The Effect of the sector on the frequency of drivers is presented in Table 8. The companies of the sample have been grouped into three clusters: C22 (rubber and plastic products), C25 (metal products, excluding machinery and equipment), and other sectors. For each sector, two columns are presented. The first column reports the frequency of the drivers (Norm Abs Freq (H+L)) detected for the particular sector. Since the sample is not homogeneous, to make it comparable, it was normalised with the number of enterprises in that particular sector. The value used for the normalization of the relative frequency is 33 (11 × 3) for C22, 45 (15 × 3) for C25, and 96 (32 × 3) for other sectors. An asterisk indicates that the frequency of the driver has a great variation (i.e., >55%) with respect to the correspondent value detected for the total sample. The second column reports the relative frequency of drivers perceived with a high intensity normalised by the absolute frequency of drivers with intensity both high and low (Rel Freq (H/H+L)) in that sector. An asterisk indicates that the difference between the relative frequency of drivers for the particular dimensional class and in the total sample is >20%. The relative frequency of the drivers detected in the total sample has been reported in the third column, in order to easily compare these values with the ones detected in the different sectors.
Take in Table 8
xxxxxxxxxxxxxxxxxxxxxxxxxxxxxxxxxxxxxxxxxxxxxxxxxxxxxxxxxxxxxxxxxxxxxxxxxxxxxxxxxxxxxxxxxxxxxxxxxxxxxxxxx
There are not meaningful differences among frequencies if we consider the sector of companies (χ2(2) = 17.77, p < 0.001).
With respect to the other analyses, fewer conclusions can be taken. From a general perspective, it is possible to observe that the sectors C22 and C25 have on average higher frequencies of drivers with respect to the other sectors and with no significant
difference (Z = –0.402, p = 0.687), but it is difficult to relate these frequencies to the features of the sector. The driver
consisting in the External support of consultants (D11) is common to all the sectors; the drivers consisting in Reduction of the insurance premium by the national compensation authority (D4), Knowledge of effective interventions (D16), and Collaboration with other stakeholders (D17) are mainly perceived in the sector C22; the drivers consisting in the Collaborations with associations and networks of companies (D12) and Knowledge of effective interventions (D16) are mainly perceived ion the sector C25. However, it is difficult to identify patterns explaining these results; the only observation is that the strong importance of intermediaries and in particular of consultants is confirmed and seems to be common to all the analysed sectors.
4. Conclusions
The debate concerning OSH interventions has recently focused on the need of improving the evaluation of interventions, and in particular on the need of providing information about why the intervention worked or not, under what circumstances, and in which context. Key concepts in the analysis of the context are the drivers, i.e., those factors enabling, fostering, or facilitating OSH interventions. However, the concept of a driver for an OSH intervention is both confused and contested. Although the term is widely used, there is little consensus on how drivers should be understood, how important they are in different contexts, and how they should be promoted.
In the light of this gap, this paper focused on the drivers for the intervention process with two different objectives: first, to provide a theoretical overview of the drivers thanks to a review of the literature; second, to analyse the frequency and intensity of the drivers on the basis of the perception of practitioners. The empirical analysis focused on SMEs, since in these companies the OSH interventions are particularly difficult to promote and to implement.
The overview included 17 drivers. This overview gives a contribution to the existing literature for different reasons. First, it takes into account different aspects that, to date, had been considered separately; it does not create a conceptual advance, but its value is mainly in summarising and comparing what has been studied across diverse disciplines and often for entirely different reasons and end objectives. Second, it provides definitions for the drivers matching the features of SMEs. Third, it enables the design of tailor made interventions, which could be selected and chosen having considered the main drivers. This first part of the research has some limitations. First, the paper does not introduce any new driver. Indeed, we are providing a summary of the factors that have been theoretically investigated and some results on the relative importance of these factors. The list does not encompasses any new factor other than those present in the literature, nevertheless the novelty of the study stands in presenting a comprehensive list of drivers (as literature review reveals). We think that this overview is an important preliminary step in the further development of a more robust taxonomy. Second, the review of the literature is limited to the OSH field; other drivers could be identified considering different studies, such as the ones dealing with drivers to Eco-Efficiency. Third, some drivers are logically overlapping or strongly related; further studies could improve the logical separation among these drivers. As for this last limitation, it has to be considered that developing precise and non-overlapping definitions for all drivers is extremely difficult given the current state of the art, the quality, form, and availability of relevant information, and complexities of communication across diverse disciplines in which subjects are studied often for entirely different reasons and end objectives.
however, the results suggest that some perceptions of practitioners are distorted. As a consequence, further researches could analyse the perception of other stakeholder, such as members of control authorities or physicians.
References
1. Champoux D, Brun J-P. Occupational health and safety management in small size enterprises: an overview of the
situation and avenues for intervention and research. Saf Sci. 2003; 41: 301–318.
2. Hasle P, Limborg HJ. A review of the literature on preventive occupational health and safety activities in small
enterprises. Ind Health.2006; 44: 6–12.
3. Hollnagel E. Barriers and Accident Prevention. Hamshire, UK: Ashgate Publishing Limited; 2004.
4. Hasan R, Bernard A, Ciccotelli J, MartinP. Integrating safety into the design process: elements and concepts relative to
the working situation. Saf Sci. 2003; 41: 155–179.
5. Pohjola VJ. Fundamentals of safety conscious process design. Saf Sci. 2003; 41: 181–218.
6. Robson LS, Stephenson CM, Schulte PA, Amick BCI, Irvin EL, Eggerth DE, Chan S, Bielecky AR, Wang AM,
Heidotting TL, Peters RH, Clarke JA, Cullen K, Rotunda CJ, Grubb PL. A systematic review of the effectiveness of occupational health and safety training. Scand. J Work Environ Health. 2011; 38: 193–208.
7. Paul PS, Maiti J. The role of behavioral factors on safety management in underground mines. Saf Sci. 2007; 45: 449–471.
8. Whysall Z, Haslam C, HaslamR. A stage of change approach to reducing occupational ill health. Prev Med. 2006; 43:
422–428.
9. Robson LS, Clarke JA, Cullen K, Bielecky A, Severin C, Bigelow PL, IrvinE, Culyer A, Mahood Q. The effectiveness of
occupational health and safety management system interventions: A systematic review. Saf Sci. 2007; 45: 329–353.
10.Laurence D. Safety rules and regulations on mine sites - The problem and a solution. J Safety Res. 2005; 36: 39–50.
11.Micheli GJL, Cagno E. Dealing with SMEs as a whole in OHS issues: Warnings from empirical evidence. Saf Sci. 2010;
48: 729–733.
12.Beaver G. Management and the small firm. Strateg Chang. 2003; 12: 63–68.
13.Olsen O, Albertsen K, Nielsen ML, Poulsen KB, Gron SMF, Brunnberg NL. Workplace restructurings in intervention
studies - a challenge for design, analysis and interpretation. BMC Med Res Methodol. 2008; 8: 39.
14.Pawson R. Evidence-based Policy: The Promise of `Realist Synthesis’. Evaluation. 2002; 8: 340–358.
15.Pedersen LM, Nielsen KJ, Kines P. Realistic evaluation as a new way to design and evaluate occupational safety
interventions. Saf Sci. 2012; 50: 48–54.
16.Whysall Z, Haslam C, Haslam R. Implementing health and safety interventions in the workplace: An exploratory study.
Int J Ind Ergon. 2006; 36: 809–818.
17.Masi D, Cagno E. Barriers to OHS interventions in small and medium-sized enterprises. Saf Sci. 2015; 71: 226–241.
18.González E, Cockburn W, Irastorza X. European Survey of Enterprises on New and Emerging Risks: Managing safety
and health at work. European Agency for Safety and Health at Work; 2010.
19.Vecchio-Sadus AM, Griffiths S. Marketing strategies for enhancing safety culture. Saf Sci. 2004; 42: 601–619.
20.Hale AR, Guldenmund FW, van Loenhout PLCH, Oh JIH, Evaluating safety management and culture interventions to
improve safety: Effective intervention strategies. Saf Sci. 2010; 48: 1026–1035.
21.Walker D, Tait R. Health and safety management in small enterprises: An effective low cost approach. Saf Sci. 2004; 42:
69-83.
22.Pransky G, Snyder T, Dembe A, Himmelstein J.Under-reporting of work-related disorders in the workplace: a case study
and review of the literature. Ergonomics. 1999; 42: 171–182.
23.Gangwar M, Goodrum PM. The effect of time on safety incentive programs in the US construction industry. Constr
Manag Econ. 2005; 23: 851–859.
24.Roy M, Parent R, Desmarais L. Knowledge Networking: A Strategy to Improve Workplace Health & Safety Knowledge
Transfer. Knowl Creat Diffus Util. 2003; 1: 159-166 .
25.European Network for Workplace Health Promotion (ENWHP). Criteria and models of good practice for workplace
health promotion in small and medium-sized enterprises (SMEs). 2001.
26.Tait R, Walker D. Motivating the Workforce : The Value of External Health and Safety Awards. J Safety Res. 2000; 31:
27.Kogi K. Advances in participatory occupational health aimed at good practices in small enterprises and the informal sector. Ind. Health. 2006; 44: 31–34.
28.Cagno E, Micheli GJL, Perotti S. Identification of OHS-related factors and interactions among those and OHS
performance in SMEs. Saf Sci. 2011; 49: 216–225.
29.Antonnson L, Birgersdotter AB, Bornberger-Dankvardt S. Small enterprises in Sweden - Health and safety and the
significance of intermediaries in preventive health and safety. Stockholm, Sweden: National Institute for Working Life; 2002.
30.Sims RH. Hazard Abatement as a Function of Firm Size - The Effects of Internal Firm Characteristics and External
Incentives [doctoral dissertation]. Santa Monica, USA: Pardee Rand Graduate School; 2008.
31.European Commission. EU SMEs in 2012: at the crossroads - Annual report on small and medium-sized enterprises in
the EU, 2011/12. 2012.
32.INAIL (Italian Workers’ Compensation Authority). Annual Report 2011. Rome, Italy: INAIL; 2012.
33.European Commission. Commission recommendation of 6 May 2003 concerning the definition of micro-small and
medium-size enterprises. 2003.
34.Trianni A, Cagno E. Dealing with barriers to energy efficiency and SMEs: Some empirical evidences. Energy. 2012; 37:
494–504.
35.Walters D. Health and Safety in Small Enterprises. European Strategies for Managing Improvement. Bruxelles, Belgium:
Peter Lang International Academic Publishers; 2001.
36.Hasle P. Health and safety in small interprises in Denmark and the role of intermediaries. Copehagen, Denmark: Centre
for Alternative Social Analysis; 2000.
37.Verbeek J, Husman K, Van Dijk F, Jauhiainen M, Pasternack I, Vainio H. Building an evidence base for occupational
health interventions. Scand J Work Environ Health. 2004; 30: 164–168.
38.Schulte PA, Okun A, Stephenson CM, Colligan M, Ahlers H, Gjessing C, Loos G, Niemeier RW, Sweeney MH.
Information Dissemination and Use : Critical Components in Occupational Safety and Health. 2003; 531: 515–531.
39.Wallner HP. Towards sustainable development of industry: networking, complexity and eco-clusters. J Clean Prod. 1999;
7: 49–58.
40.Cagno E, Micheli GJL, Masi D, Jacinto C. Economic evaluation of OSH and its way to SMEs: A constructive review.
Saf Sci. 2013; 53: 134–152.
41.Swuste P, Hale A, Pantry S. Solbase: A Databank of Solutions for Occupational Hazards and Risks. Ann Occup Hyg.
2003; 47: 541–547.
42.Robson LS, Shannon HS, Goldenhar LM, Hale AR. Guide to evaluating the effectiveness of strategies for preventing
Symbol Driver Definition Reference
D1 Rewards, bonuses and awards from the company
The driver arises when the company awards some “prize” to individual employees or employee groups who have worked for a specified period of time without having an accident or who have adopted correct safety behaviours. These programs can facilitate OSH interventions in all the cases in which the involvement of personnel plays a decisive role.
[22, 23]
D2 Monetary incentives from central or local control authorities
The driver consists in monetary incentives provided to the companies achieving or aiming at achieving one or more OSH performance thresholds. The incentives could be provided by several control authorities. The driver facilitates interventions by providing economic resources for their implementation or by motivating the company to obtain these incentives and to invest on safety.
[26, 21, 30]
D3 Reduction of fees for
deserving companies The driver consists in the reduction of fees guaranteed to the companies achieving one or more OSH performance thresholds. The driver facilitates interventions by providing economic resources for their implementation or by motivating the company to obtain reduction of fees and to invest on safety.
[26, 21]
D4 Reduction of the insurance premium by the national
compensation authority
The driver consists in the reduction of the insurance premium – compulsory by law- guaranteed to the companies achieving one or more OSH performance thresholds. The driver facilitates interventions by providing economic resources for their implementation or by motivating the company to obtain these discounts and to invest on safety.
[26, 21]
D5 Reduction in bank
lending rates The driver consists in the bank benefits guaranteed to the companies achieving one or more OSH performance thresholds. [26, 21] D6 Insurance benefits The driver consists in the reduction of the insurance costs - not
compulsory by law - guaranteed to the companies achieving one or more OSH performance thresholds.
[26, 21]
D7 Sanctions by control
authorities The driver indicates sanctions imposed by the control authorities to the companies not achieving one or more OSH performance thresholds. It can facilitate OSH interventions by motivating companies to intervene and through the indications for the improvement provided by control authorities.
[2]
D8 Behaviour of unions The driver indicates the support to OSH interventions provided by unions. This support could consists both in motivating the management or the workers, both in providing technical or economic support.
[2]
D9 Tailor made legislation
for SMEs The driver indicates laws and regulations matching the features of SMEs and fostering OSH interventions. The support to interventions could derive from guidelines for the compliance with regulations or from the regulation themselves, providing the motivation to intervene on the proper factors.
[29]
D10 External support in the OSH management by control authorities
The driver indicates the support to OSH interventions provided by control authorities. This support could consists both in motivating the management or the workers, both in providing technical or economic support.
[2, 26, 21]
D11 External support of
consultants The driver indicates the support to OSH interventions provided by external consultants. This support mainly consists in the competencies and the knowledge provided by the consultants.
[29]
D12 Collaborations with associations and networks of companies
The driver indicates the support to OSH interventions provided by associations and networks of companies. This support consists in sharing knowledge, in sharing other OSH related resources, and in promoting common initiatives. This kind of support to OSH interventions is crucial in all the cases in which the collaboration of similar companies plays an essential role.
[2, 28, 24]
D13 Training programs for SMEs
This driver indicates training programs designed for SMEs. These ones foster interventions by increasing the awareness and the knowledge of the personnel, which is so more motivated to intervene or to correctly behave.
[21]
D14 Communication tools This driver indicates all the tools fostering the communication among employees or between management and employees. It can foster OSH interventions in all the cases in which a proper communication plays an essential role.
D15 ICT tools This driver indicates all the ICT tools fostering OSH interventions. These tools can improve the communication and the management of data and information; they play an essential role in all the phases of the interventions requiring the use of knowledge or the fast flow of information.
[28]
D16 Knowledge of
[image:15.595.77.517.70.226.2]effective interventions This driver indicates the availability of knowledge of effective OSH interventions. Those interventions can be replicated or adapted in the particular SMES, thus helping the achievement of proper safety conditions.
[25, 24, 30]
D17 Collaboration with other stakeholders (customers, contractors, and suppliers)
The driver indicates the support to OSH interventions provided by other stakeholders such as customers, contractors, and suppliers. This driver bears a particular relevance firstly when the enterprise is responsible for the safety of these external actors: e.g., when contractors work in a yard managed by the enterprise or when a supplier provide a machinery which is critical for OSH.
[21]
Driver †
D1 D2 D3 D4 D5 D6 D7 D8 D9 D10 D11 D12 D13 D14 D15 D16 D17
Reference Main driver(s)
[22] Safety incentive programmes X
[26] Externally organized health and safety award schemes X X
[25] Sharing best practices X
[29] Support of consultants X
Legislation X
[24] Networks of companies X X
[27] Communication tools X
[19] Marketing tools and effective communication strategies X
[21] Low-cost X X X X X X X X
[23] Rewards and incentives from the company X
[2]
Occupational health services X
Insurance companies X
Labour unions X
Accountants and public authorities X X
[20] Constructive dialogue between shop-floor and line
management X
[28] ICT tools X
[image:16.842.122.808.55.354.2]Sharing of knowledge X
Table 2: Relationships between the overview of drivers and the contributions of the literature.
Sector Code companies No. of
Food C 10 2
Textiles, wearing apparel C 13; C 14 2
Leather (excluding apparel) and related products C 15 1
Wood, and wood and cork products C 16 2
Paper and paper products C 17 1
Coke and refined petroleum products C 19 1
Chemical products, Basic pharmaceutical products and pharmaceutical preparations C 20; C 21 4
Rubber and plastic products C 22 11
Other non-metallic mineral products C 23 2
Basic Metals C 24 1
Metal products, excluding machinery and equipment C 25 15
Computer, electronic and optical products; electro-medical and measuring equipment,
watches and clocks, Electrical equipment and non-electric domestic appliances C 26; C 27 5
Machinery and equipment C 28 6
Motor-vehicles, trailers, semi-trailers C 29 1
Other manufacturing industry products C 32 1
Other – 3
[image:17.595.55.541.88.322.2]Total 58
No. of workers Total
Turnover (EUR) <10 10–49 50–99 100–249
⩽2 million/year 4 6 0 0 10
2–10 million/year 0 8 6 1 16
10–20 million/year 0 6 5 1 12
>20 million/year 0 1 7 12 20
[image:18.595.57.541.83.167.2]Total 4 21 19 14 58
Driver † Abs Freq (H+L) Rel Freq (%) (H/H+L)
D1 12 33
D2 30 30
D3 29 24
D4 42(+) 17
D5 11 18
D6 31 10
D7 30 23
D8 16 38(+)
D9 14 14
D10 23 35
D11 98(+) 74(+)
D12 48(+) 50(+)
D13 36 25
D14 36 14
D15 48(+) 40(+)
D16 62(+) 39(+)
[image:19.595.216.379.89.381.2]D17 40 25
Table 5: Absolute frequency of the drivers with intensity both high and low (i.e., Abs Freq (H+L)) and relative frequency of drivers with a high intensity (i.e., Rel Freq (H/H+L)), detected on the whole sample. In each column the 5 highest values are marked with (+).
Driver † Freq Abs (H+L)
Rel Freq (%) (H/H+L)
Phase of the intervention process
Design Implementation Evaluation
Abs Freq (H+L)
Rel Freq (%) (H/H+L)
Abs Freq (H+L)
Rel Freq (%) (H/H+L)
Abs Freq (H+L)
Rel Freq (%) (H/H+L)
D1 12 33 5 40(+) 4 25 3 33
D2 30 30 12 25 16(+) * 31 2 50(+)
D3 29 24 12 8 12 50(+) * 5 0
D4 42(+) 17 16 25 15(+) 20 11(+) 0
D5 11 18 5 * 0 4 50(+) * 2 0
D6 31 10 12 17 10 10 9(+) 0
D7 30 23 11 0 12 17 7 71(+) *
D8 16 38(+) 6 50(+) 9 * 33 1 0
D9 14 14 6 33 6 0 2 0
D10 23 35 11 * 36 6 33 6 33
D11 98(+) 74(+) 46(+) * 70(+) 32(+) 75(+) 20(+) 85(+)
D12 48(+) 50(+) 25(+) * 56(+) 18(+) 44(+) 5 40
D13 36 25 22(+) * 27 10 20 4 25
D14 36 14 20 * 15 8 0 8 25
D15 48(+) 40(+) 26(+) * 27 9 44(+) 13(+) 62(+) *
D16 62(+) 39(+) 32(+) * 41(+) 15(+) 13 15(+) 60(+) *
[image:20.842.199.648.55.382.2]D17 40 25 21 * 29 15(+) 20 4 25
Table 6: Effect of the phase on the absolute (i.e., Abs Freq (H+L)) and relative frequency (i.e., Rel Freq (H/H+L)) of drivers. For each phase, the first column reports the absolute frequency of the drivers and an asterisk indicates that the driver is detected mainly (>45%) in that particular phase. The second column reports the relative frequency of the drivers perceived with a high intensity and an asterisk indicates that the difference between the relative frequency of drivers in the particular phase and in the total sample is relevant (>20%). In each column the 5 highest values are marked with (+).