http://go.warwick.ac.uk/lib-publications
Original citation:
Tao, H., Guo, S., Ge, T., Kendrick, K. M., Xue, Z., Liu, Z. and Feng, Jianfeng. (2013)
Depression uncouples brain hate circuit. Molecular Psychiatry, Vol.18 . pp. 101-111.
Permanent WRAP url:
http://wrap.warwick.ac.uk/42240
Copyright and reuse:
The Warwick Research Archive Portal (WRAP) makes the work of researchers of the
University of Warwick available open access under the following conditions.
This article is made available under the Creative Commons
Attribution-NonCommercial-NoDerivs 3.0 Unported (CC BY-NC-ND 3.0) license and may be reused according to the
conditions of the license. For more details see:
http://creativecommons.org/licenses/by-nc-nd/3.0/
A note on versions:
The version presented in WRAP is the published version, or, version of record, and may
be cited as it appears here.
ORIGINAL ARTICLE
Depression uncouples brain hate circuit
H Tao
1,6, S Guo
2,6, T Ge
3,6, KM Kendrick
4,6, Z Xue
1, Z Liu
1and J Feng
3,51Institute of Mental Health, Second Xiangya Hospital, Central South University, Changsha, PR China;2Mathematics and
Computer Science College, Hunan Normal University, Changsha, PR China;3Centre for Computational Systems Biology,
School of Mathematical Sciences, Fudan University, Shanghai, PR China;4Cognitive and Systems Neuroscience Group,
The Babraham Institute, Cambridge, UK and5Department of Computer Science, University of Warwick, Coventry, UK
It is increasingly recognized that we need a better understanding of how mental disorders such as depression alter the brain’s functional connections to improve both early diagnosis and therapy. A new holistic approach has been used to investigate functional connectivity changes in the brains of patients suffering from major depression using resting-state functional magnetic resonance imaging (fMRI) data. A canonical template of connectivity in 90 different brain regions was constructed from healthy control subjects and this identified a six-community structure with each network corresponding to a different functional system. This template was compared with functional networks derived from fMRI scans of both first-episode and longer-term, drug resistant, patients suffering from severe depression. The greatest change in both groups of depressed patients was uncoupling of the so-called ‘hate circuit’ involving the superior frontal gyrus, insula and putamen. Other major changes occurred in circuits related to risk and action responses, reward and emotion, attention and memory processing. A voxel-based morphometry analysis was also carried out but this revealed no evidence in the depressed patients for altered gray or white matter densities in the regions showing altered functional connectivity. This is the first evidence for the involvement of the ‘hate circuit’ in depression and suggests a potential reappraisal of the key neural circuitry involved. We have hypothesized that this may reflect reduced cognitive control over negative feelings toward both self and others.
Molecular Psychiatry(2013)18,101–111; doi:10.1038/mp.2011.127; published online 4 October 2011
Keywords: fMRI; functional connectivity; hate circuit; major depression; mental disorder; voxel-based morphometry
Introduction
At the brain circuit level, most of what we understand about depression and its biological abnormalities during the resting state comes from functional magnetic resonance imaging (fMRI) studies targeting changes in a small number of the brain regions, as recently reviewed in Raichle1 and Zhang and Raichle.2 These studies have suggested the involve-ment of a default mode network including the dorsal anterior cingulate cortex and some subcortical areas such as amygdala and thalamus.3–7 However, the conclusions drawn from these studies are based on either seed-based analysis or independent component analysis and are questionable in spite of the wide and successful application of such methods in the
analysis of resting-state fMRI data.8–13 Seed-based analysis is a hypothesis-driven approach, which means the foci (seeds) of the disorder must be specified a priori. It is therefore a biased approach lacking a global and independent view.14 With the independent component analysis approach, it is assumed that the human brain is composed of independent components, whereas in reality, differ-ent parts of the human brain undoubtedly work in a coordinated manner. Hence, given the complexity and multiple causes of depression together with variability between individuals, a novel, unbiased approach is urgently called for which identifies pathway changes in a holistic manner.
In the current paper, we have adopted such a new holistic approach aiming to unambiguously identify the key connections, which are modified in the brains of depressed patients. To achieve this, we have first applied a canonical template constructed for the whole brain based upon data from a large number of healthy individuals. Using a community discovery algorithm we have developed previously,15 six dis-crete interconnected communities were recovered from this template, each corresponding to a func-tional system in the human brain: a default mode network that has been reported extensively in the
Received 18 May 2011; revised 1 August 2011; accepted 29 August 2011; published online 4 October 2011
Correspondence: Professor J Feng, Centre for Computational Systems Biology, Fudan University, Shanghai, PR China and Department of Computer Science, Warwick University, Coventry CV4 7AL, UK or Professor Z Liu, Institute of Mental Health, Second Xiangya Hospital, Central South University, Changsha 410011, PR China.
E-mails: [email protected] or [email protected] 6These authors contributed equally to this work.
literature,11,12 an attention network consisting of frontal and parietal areas, the auditory system, the visual system, the sensory-motor areas and finally a subcortical network. Corresponding functional maps for patients suffering from severe depression with or without pharmacological treatments (first-episode major depressive disorder (FEMDD) patients and resistant major depressive disorder (RMDD) patients) were then constructed using a similar approach enabling us to carry out a thorough comparison between the brains of healthy and depressed indivi-duals. Voxel-based morphometry analysis was also carried out to assess whether gray or white matter volume changes occurred in those brain regions of depressed patients showing altered functional connectivity.
The most significant differences between both FEMDD and RMDD patients and healthy populations occurred in intercommunity rather than intracommu-nity links. The greatest change was in a circuit associated with feelings of hate, comprising the superior frontal gyrus, insula and putamen,16 where these regions were uncoupled in depressed patients in both hemispheres. The other main circuits identi-fied that were significantly affected in depressed patients included those involved with risk-taking and action, emotion and reward, attention and memory. This is the first time changes in the functional connectivity of the so-called ‘hate circuit’ have been identified in the brains of depressed patients.
Subjects and methods
Subjects
Fifteen treatment-naive adult patients with FEMDD (seven females, eight males; mean age 28.27±7.45 years; mean education 12.13±3.60 years) and 24 treatment-RMDD patients (16 females, 8 males; mean age 27.83±7.86 years; mean education 11.92±3.56 years) were recruited from inpatient or outpatient departments of the Second Xiangya Hospital of Central South University in Changsha, Hunan Pro-vince, China. The mean illness duration for patients with FEMDD was 21.10±24.67 months, and the mean score on the 17-item version of Hamilton Rating Scale for Depression17,18 was 26.07±6.51. The mean illness duration for patients with RMDD was 34.00±45.14 months, and the mean score on the 17-item version of Hamilton Rating Scale for Depres-sion was 24.29±3.70. None of the patients had comorbidities with other disorders. Detailed treat-ments for RMDD patients can be found in Supple-mentary Table S1.
All RMDD patients were taking antidepressants at the time of the MRI scan and treatment resistance was defined as non-responsiveness to at least two ade-quate trials in terms of dosage, duration (6 weeks for each trial), and use of different classes of antidepres-sants consistent with previous studies.19,20 Non-responsiveness was defined as a < 50% reduction in HRSD score21after a treatment at a minimum dose of
150 mg per day of imipramine equivalents (dose converted using a conversion table22) for 6 weeks.
Thirty-seven age, gender and education duration matched healthy control subjects (14 females, 23 males; mean age 28.22±6.47 years; mean education 13.32±3.29 years) were also recruited (gender matching: w2 test = 4.873, P= 0.087; age matching: F = 0.037, P= 0.964 and education matching: F = 1.205,P= 0.306).
All patients met the following inclusion criteria: (I) current MDD attack as assessed by two experienced psychiatrists using the Structural Clinical Interview for DSM-IV; (II) 18–45 years of age; (III) right-handed Han Chinese; (IV) Hamilton Rating Scale for Depres-sion scores of at least 17; (V) treatment-naive adult patients with FEMDD had not taken any medication before MRI scan.
Patients and healthy controls were excluded if they had any of the following: (I) a history of neurological diseases or other serious physical diseases; (II) a history of electroconvulsive therapy; (III) history of substance (that is drugs, alcohol and other psychoac-tive substance) abuse; (IV) comorbidities with other disorders (no evidence for schizoaffective disorder or Axis II, personality disorders and mental retardation); (V) any contraindications for MRI.
This study was approved by the Ethics Committee of the Second Xiangya Hospital, Central South University, Hunan, China. Written informed consent was obtained from all subjects.
Imaging acquisitions and data preprocessing
All functional imaging data were acquired using a 1.5-T GE Signa Twinspeed scanner (General Electric Medical System, Milwaukee, WI, USA) at the Second Xiangya Hospital of Central South University in Changsha, Hunan Province, China. A total of 180 volumes of echo planar images were obtained axially (repetition time, 2000 ms; echo time, 40 ms; slices, 20; thickness, 5 mm; gap, 1 mm; field of view, 2424 mm2; resolution, 6464; flip angle, 901).
Before functional images preprocessing, the first 10 volumes were discarded to allow for scanner stabilization and the subjects’ adaptation to the environment. fMRI data preprocessing was then conducted by SPM8 (University College London, UK; http://www.fil.ion.ucl.ac.uk/spm) and DPARSF (Data Processing Assistant for resting-state fMRI).23 Briefly, the remaining functional scans were first corrected for within-scan acquisition time differences between slices, and then realigned to the middle volume to correct for interscan head motions. Subse-quently, the functional scans were spatially normal-ized to a standard template (Montreal Neurological Institute) and resampled to 333 mm3. After nor-malization, the Blood Oxygenation Level Dependent (BOLD) signal of each voxel was first detrended to abandon linear trend and then passed through a band-pass filter (0.01–0.08 Hz) to reduce low-frequency drift and high-frequency physiological noise. Finally, nui-sance covariates including head motion parameters,
H Taoet al
global mean signals, white matter signals and cere-brospinal fluid signals were regressed out from the Blood Oxygenation Level Dependent signals.
High-resolution whole-brain volume T1-weighted images were acquired sagittally with a 3D spoiled gradient echo pulse sequence (repetition time, 12.1 ms; echo time, 4.2 ms; flip angle, 151; field of
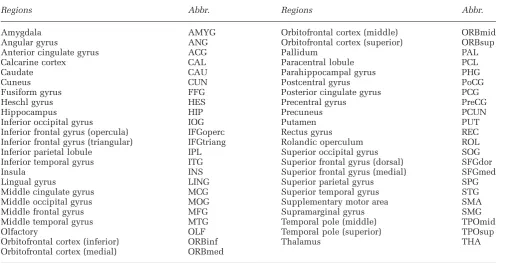
view = 240240 mm2; acquisition matrix, 256256; thickness, 1.8 mm; number of excitations, 2; 172 slices.) All T1-weighted structural data were pro-cessed with VBM5 toolbox (Structural Brain Mapping Group, Jena, Germany; http://dbm.neuro.unijena. de/vbm) based on the SPM software package. After modulate normalizing, the images were segmented into gray matter, white matter and the cerebrospinal fluid. These segmented images were smoothed using a 12-mm full width at half maximum (FWHM) Gaussian kernel. An automated anatomical labeling atlas24was used to parcellate the brain into 90 regions of interest (ROIs) (45 in each hemisphere). The names of the ROIs and their corresponding abbreviations are listed in Table 1. Volumes of the gray matter and the white matter for each ROI were extracted. Two sample
t-tests with Bonferroni correction were then used to assess whether there were significant volume differ-ences between patients and normal controls.
Construction of whole-brain functional network
After data preprocessing, the time series were ex-tracted in each ROI by averaging the signals of all voxels within that region. Pearson correlation coeffi-cients between all pairs of ROIs were first calculated. Significant correlations were detected with aP-value < 0.01. A 9090 correlation matrix was obtained
for each subject. However, significant correlation between two ROIs may be spurious, that is, a by-product of the correlations of the two ROIs with a third region. To find out whether the correlation for the two ROIs is genuine, the third ROI should be kept constant. Statistically, this problem can be tackled by means of a partial correlation test. In such a test, the effects of the third ROI upon the relation between the other two ROIs are eliminated. By calculating partial correlation coefficients between all pairs of ROIs with all the remaining ROIs being controlling variables, a 9090 connection matrix was obtained for each subject with a P-value < 0.01. The population level network can be obtained by summarizing all indivi-dual networks in FEMDD, RMDD and Healthy subject groups, respectively, and thresholding them into binarized matrices with matched and reasonable sparsity values (defined as the total number of edges in a network divided by the maximum number of possible edges). In the analysis of this paper, the sparsities of the normal, FEMDD and RMDD networks were 2.74, 2.77 and 2.64%, respectively.
Community mining algorithm
[image:4.595.38.550.473.736.2]A network community generally refers to a group of vertices within which the connecting links are dense but sparse in between. In this study, a community structure of the functional network of the brain corresponds to groups of brain regions that have similar functions and dense functional connectivity with each other. Our former developed community mining algorithm described in Yang et al.15 tries to explore the notion of network modularity by means of understanding the dynamics of the network, which
Table 1 The names and abbreviations of the regions of interest (ROIs)
Regions Abbr. Regions Abbr.
Amygdala AMYG Orbitofrontal cortex (middle) ORBmid
Angular gyrus ANG Orbitofrontal cortex (superior) ORBsup
Anterior cingulate gyrus ACG Pallidum PAL
Calcarine cortex CAL Paracentral lobule PCL
Caudate CAU Parahippocampal gyrus PHG
Cuneus CUN Postcentral gyrus PoCG
Fusiform gyrus FFG Posterior cingulate gyrus PCG
Heschl gyrus HES Precentral gyrus PreCG
Hippocampus HIP Precuneus PCUN
Inferior occipital gyrus IOG Putamen PUT
Inferior frontal gyrus (opercula) IFGoperc Rectus gyrus REC
Inferior frontal gyrus (triangular) IFGtriang Rolandic operculum ROL
Inferior parietal lobule IPL Superior occipital gyrus SOG
Inferior temporal gyrus ITG Superior frontal gyrus (dorsal) SFGdor
Insula INS Superior frontal gyrus (medial) SFGmed
Lingual gyrus LING Superior parietal gyrus SPG
Middle cingulate gyrus MCG Superior temporal gyrus STG
Middle occipital gyrus MOG Supplementary motor area SMA
Middle frontal gyrus MFG Supramarginal gyrus SMG
Middle temporal gyrus MTG Temporal pole (middle) TPOmid
Olfactory OLF Temporal pole (superior) TPOsup
Orbitofrontal cortex (inferior) ORBinf Thalamus THA
Orbitofrontal cortex (medial) ORBmed
can naturally reflect the intrinsic properties of the network with modularity structure and exhibit local mixing behaviors. Based on large deviation theory,15 this algorithm sheds light on the fundamental significance of the network communities and the intrinsic relationships between the modularity and the characteristics of the network. See Supplementary Information for more details.
Results
Canonical template
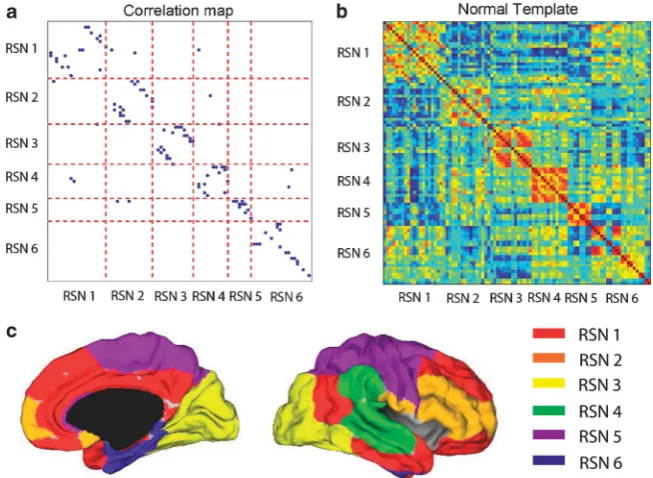
The six-community structure constructed for the whole brain from 37 healthy subjects is shown in Figure 1a. Each dot represents a significant link between the two brain regions, with their names listed in Table 1. For clarity, only one dot is plotted for any two linked regions and it is easy to see the existence of the six communities in the whole brain. We have observed this same structure in an even larger population of around 400 people (data from Cambridge USA and Beijing publicly available in Biswal et al.,25 results not shown). Figure 1b is the actual correlation matrix for a randomly selected individual, showing again the clear community structure. The six communities correspond to six resting-state networks (RSN), which can be identified in terms of broad functions and can be classified as a default mode network (RSN1), an attention network (RSN2), a visual recognition network (RSN3), an auditory network (RSN4), sensory-motor areas (RSN5) and a subcortical network (RSN6). Figure 1c shows the medial and lateral views of the cortical surface mapping of the six-community structure.
FEMDD and RMDD patients
For both the 15 FEMDD patients and 24 RMDD patients, functional maps were constructed and compared with those for the healthy subject group. Comparing the FEMDD network with the canonical template from healthy subjects, there are 97 common links that appear in both networks, 14 links that appear in healthy subjects but are absent in the FEMDD network and 15 links that appear in the FEMDD network but cannot be found in the canonical template. For the RMDD and healthy subject net-works, there are 93 common links, 14 links that only appear in the RMDD network and 18 links that appear in the healthy subjects only. In order to rank the significance of the change for each link, a score is defined as follows for each particular link:
S¼ Lh Nh
Lp Np
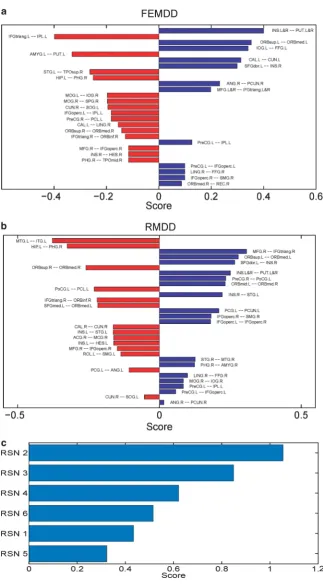
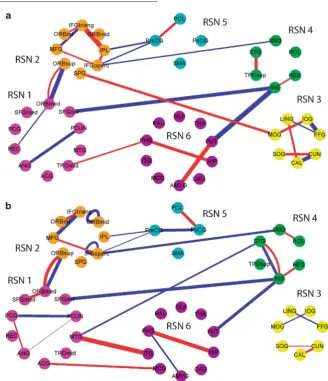
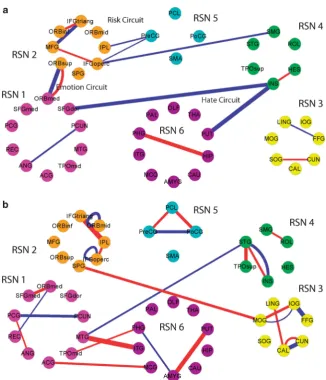
[image:5.595.144.471.461.700.2]where s is the score for a particular link, Lp is the number of this link present in the individual net-works of depressives, Np is the total number of patients,Lhis the number of this link present in the individual networks of normal controls andNhis the total number of healthy controls. Scores for different links in the two hemispheres between the FEMDD network and the canonical template are shown in Figure 2a and those between the RMDD network and canonical template in Figure 2b. The summations of the scores for links within each RSN in both FEMDD and RMDD networks are shown in Figure 2c. To better visualize the changes, Figures 3a and b show the altered connections for the two patient groups but without differentiating between brain hemispheres.
Figure 1 (a) Community structure of the normal template. (b) The correlation coefficient matrix of the Blood Oxygenation Level Dependent (BOLD) signals from 90 regions of interest (ROIs) of one randomly selected subject. (c) (Left) Medial view of the surface of the brain. (Right) The lateral view of the surface of the brain. Different colors represent different communities.
H Taoet al
Scores for the links altered in both hemispheres are combined to aid clarity. Figures 4a and b do the same but to illustrate the similarities and differences
[image:6.595.124.448.63.648.2]between changes in the two patient groups. It can be seen from Figures 2, 3 and 4 that the strongest evidence for reduced connectivity compared with
Figure 2 (a) Bar plot of the scores of the first-episode major depressive disorder (FEMDD) network compared with the normal template. (b) Bar plot of the scores of the resistant major depressive disorder (RMDD) network compared with the normal template. In both (a,b), red bars represent the links appeared in patients’ network while disappeared in normal template, blue bars arevise verse. (c) Summarized scores for the six communities.
control subjects in both FEMDD and RMDD is that between the insula and putamen in both brain hemispheres (s= 0.4 and 0.25 for FEMDD and RMDD, respectively). Additionally, the link between the left superior frontal gyrus and the right insula is also reduced (s= 0.2991 and 0.2658). Thus, the links between the three main components of the ‘hate circuit’ have become largely uncoupled. Connections to the left inferior frontal gyrus (opercular) from the left precentral gyrus (s= 0.0991 and 0.0574) and those from the right inferior frontal gyrus (opercular) to the right supramarginal gyrus (s= 0.0991 and 0.1824) are also reduced together with those from left precentral gyrus to the left inferior parietal lobe (s= 0.1261 and 0.0845). These four regions comprise a risk/action circuit. In what we have designated as an emotion/ reward circuit, the connection from the superior to the inferior orbitofrontal cortex, is considerably weakened in the left hemisphere of depressed
patients (s= 0.3532 and 0.2782) but correspondingly strengthened in the right hemisphere (s=0.1423 and
[image:7.595.141.470.59.441.2]0.259). There is also a weakening of the connection between the right lingual gyrus and right fusiform gyrus in the visual recognition circuit (s= 0.0991 and 0.0991) and between the right angular gyrus and right precuneus in the default circuit (s= 0.2324 and 0.0158). In both groups of depressed patients, strengthened connections were also found within a number of circuits, most notably between the left hippocampus and right parahippocampal gyrus in the subcortical network (s=0.2505 and 0.3255) but also between the right inferior frontal gyrus (triangu-lar) and right inferior orbitofrontal cortex (s=0.1279 and 0.2196) and between the right medial frontal gyrus and right inferior frontal gyrus (triangular) (s= 0.1658 and 0.3074) in the attention circuit. Finally, the connection between the right cuneus and left superior occipital gyrus in the visual
Figure 3 (a) Functional network structure with different links of normal template and first-episode major depressive disorder (FEMDD) patients. (b) Functional network structure with different links of normal template and resistant major depressive disorder (RMDD) patients. In both (a,b), red lines are links that appear in depression network only while blue lines are links that appear in normal template only. The widths of the lines are proportional to the scores.
H Taoet al
recognition circuit (s=0.1946 and 0.0529) was strengthened.
With the large number of individual connections analyzed between 90 different brain structures, the changes for individual links could fail to be signifi-cant after making corrections for multiple compar-isons. We therefore also carried out a permutation analysis on total scores for different circuits (the summation of the scores for all altered links within a circuit) to assess the significance of changes in depressed patients. A comparison of the total scores for the main intercommunity connection changes was 0.61 (P= 0.003) for the hate circuit (superior frontal gyrus, insula and putamen), 0.32 (P= 0.026) for the risk/action circuit (inferior frontal gyrus (opercular), precentral gyrus, superior medial gyrus and inferior parietal lobule) and 0.52 (P= 1.76e–4) for the emo-tion/reward circuit (superior and medial orbitofrontal cortex). The main intracommunity circuit changes were in the attentional circuit (right inferior frontal
gyrus (triangular), right inferior orbitofrontal cortex and medial frontal gyrus) (s= 0.4, P= 0.007) and between the hippocampus and parahippocampal gyrus (s= 0.29, P= 0.005). The overall change in the visual circuit (cuneus, superior occipital gyrus, angular gyrus and fusiform gyrus) just failed to achieve significance (s= 0.23,P= 0.06).
Voxel-based morphometry analysis revealed no significant (P> 0.05,t-test with Bonferroni correction) gray or white matter volume reductions in these pathways. (See Supplementary Tables S2–S4 for details of the gray/white matter volumes of the ROIs involved in these pathways for both patients and normal controls are listed.)
Discussion
[image:8.595.123.450.65.446.2]The holistic approach adopted here to identify altered functional circuits in the brains of depressed patients has proved to be very informative. The approach is
Figure 4 (a) The common links of the first-episode major depressive disorder (FEMDD) and resistant major depressive disorder (RMDD) networks. (b) Different links of the FEMDD and RMDD networks. In both (a,b), red lines are links that appear in depression network only while blue lines are links that appear in normal template only. The widths of the lines are proportional to the scores.
completely different from existing methods: seed-based analysis and independent component analysis— and makes no assumptions about which circuits might be altered or that brain regions are independent of one another. Furthermore, our approach has identified the so-called ‘hate circuit’, as the one showing the largest change in both FEMDD and RMDD, although similar major changes also occurred in the emotion and risk/action circuits. This involve-ment of the ‘hate circuit’ has not, to the best of our knowledge, been found in previous studies. Interest-ingly, some of the main circuitry identified by other studies using ana prioriseed-based approach, such as the links related to the amygdala and cingulate cortex,4–7was not found to be altered consistently in both patient groups. A link with the amygdala was present in RMDD, but absent in FEMDD, while the cingulate link was absent in RMDD but present in FEMDD.
Overall, our voxel-based morphometry analysis revealed no significant gray or white matter changes in any of the brain regions, showing connectivity changes in depressed patients. It therefore seems unlikely that observed changes were simply caused by reduced tissue volumes.
Although the current approach has only been applied to one of the major brain disorders, depres-sion, it is clear that it could be easily applied to other forms of psychiatric, developmental or neurodegen-erative disorders and provide information on how each of these disorders are characterized by a specific subset of functional connectivity changes as well as helping to identify possible common traits across, for example, affective or learning and memory disorders.
It could be argued that the changes in functional circuit we have identified are simply a reflection of altered coherent activities (both positive and negative correlations) among the brain regions in the resting state and that they might not be predictive of altered responsivity to internal or external stimuli promoting behavioral responses. For example, the ‘hate circuit’ might lose its coherency in the patients in a resting state, but regain this coherency and function normally in response to appropriate stimuli. This is certainly an issue for all resting-state studies requiring further investigation although, as we will discuss below, there are some interesting parallels between our current findings and previous studies, showing stimulus-evoked changes in these same circuits in depressed patients.
So what might be the significance of the uncoupling we have found bilaterally in the so-called ‘hate circuit’ of depressed patients? This circuit is asso-ciated with feelings of hate because it has been reported that the superior frontal gyrus, insula and putamen are the three main brain regions showing altered activation when individuals view people who they hate,16 although interestingly they are also affected similarly by seeing people you love, or have loved but recently been rejected by.16,26–28 The insula
region is also reported to be involved in feelings of disgust as well as other emotions29and a recent fMRI study has shown enhanced responses in the insula to faces expressing disgust.30A relationship between the different components of the ‘hate circuit’ and various psychiatric and neurodegenerative diseases such as schizophrenia,31Huntington’s disease32,33and depres-sion30has already been reported.
A recent meta-analysis of changes in brain activa-tion during depression shows that the superior frontal gyrus, insula and putamen are consistently affected.34 This meta-analysis reports that the superior frontal gyrus shows increased activation in depressed pa-tients as well as enhanced activation in response to positive emotional stimuli and decreased activation in response to negative emotional stimuli. The insula exhibits decreased basal activity and responses to both positive and negative emotional stimuli in depressed patients. The putamen on the other hand shows decreased responses to positive emotional stimuli and increased ones to negative emotional stimuli. The differential patterns of changes in these three structures are consistent with our finding that in depressed patients they have become functionally uncoupled both in the resting state and during exposure to emotional stimuli, although the latter needs to be confirmed in further experiments. Inter-estingly, the meta-analysis also reports that with SSRI treatments, all three structures tend to show de-creased activity, which might suggest reestablishment of the coupling between them leads to more coordina-tion between them.
Depression is associated with reduced size of the putamen,35although we did not find any evidence for this in our depressed patients. Elevated dopamine D2 receptor binding36 and increased oxidative stress37 have also been reported in the putamen of depressed patients, and stroke patients with damage to this region can show depressive symptoms.38 Altered functioning of the insular cortex has been found in a number of psychiatric disorders, including depres-sion.39 Depression is associated with a disturbed sense of interoceptive awareness and the insula appears to be important in this respect.40The superior frontal gyrus has also been reported to be reduced in size in depressed patients41although we did not find this in our patients.
Depression is often characterized by intense self-loathing, and while it is associated with anhedonia, there is no obvious indication that depressives are less prone to hate others. One possibility is that the uncoupling of this circuit could be associated with impaired ability to control and learn from social or other situations that provoke feelings of hate toward self or others. This in turn could lead to an inability to deal appropriately with feelings of hate and an increased likelihood of both uncontrolled self-loath-ing and withdrawal from social interactions. De-pressed patients also have problems in controlling negative thoughts and so a potential hypothesis is that the functional uncoupling in this circuit may be
H Taoet al
contributing to impaired cognitive control over pervasive internal feelings of self-loathing or hatred toward others and/or external circumstances. Indeed, reduced cognitive control over emotions has been proposed as one of the important factors in depres-sion.42
The ‘hate circuit’ may be involved in the control of other behaviors influenced by depression. The same brain regions, for example, also appear to be involved in feelings of self-awareness. A recent experiment using real-time fMRI training has reported that feed-back enhanced metacognitive awareness, in terms of turning attention toward or away from their own thoughts, results in increased activation of the prefrontal cortex, insula and putamen.43 Depressed patients also have problems in controlling their thoughts and perhaps feedback training on meta-cognitive awareness might actually be a potential therapeutic approach for restoring functional cou-pling in this circuit.
Other significantly affected circuits in depressed patients were those associated with risk and action, reward and emotion, attention and memory processing. The risk/action circuitry comprises the inferior frontal gyrus and its connections with the precentral gyrus in the left hemisphere and supramarginal gyrus in the right hemisphere. The inferior frontal gyrus is particularly associated with response inhibition44,45 and its activation has been found to be positively correlated with perception of and taking higher risks in a variety of experimental contexts.46–48 These pathways together with the left precentral gyrus connection to the inferior parietal lobe are all reduced in strength in depressed patients and are part of the ‘mirror’ system involved in imitating the actions of others and also responding to self-movements.49,50 They are also involved in aspects of semantic processing, which can also be impaired in depressed patients.51In this context, it is interesting to note that connectivity between the angular gyrus and cuneus is weakened in our depressed patients, which might contribute to impaired semantic processing.52The inferior parietal lobe has also been shown to be important for the perception of emotions during presentation of facial stimuli.53 This finding, coupled with the observed weakening of connections between the fusiform and lingual gyri provides a neural basis for impaired face emotion processing in depressed patients. Indeed, altered responsiveness to emotional facial stimuli in depressives has been taken as one of the biomarkers for early diagnosis.54
A meta-analysis of the brain regions affected in depressed patients has shown the inferior frontal gyrus to be influenced both in terms of basal activity and responses to affective stimuli.34Overall therefore one possibility is that, as with the ‘hate circuit’, the altered coupling in the risk/action circuit may also reflect reduced cognitive control via the frontal cortex over a range of adaptive responses to emotional stimuli.
The part of an emotion and reward circuit sig-nificantly altered in depressed patients comprises the links between the superior and medial regions of the orbitofrontal cortex, and is known to be closely related to psychiatric and developmental disorders such as schizophrenia,55 obsessive compulsive dis-order56 and autism.57 Neuroimaging studies have found that the reward value, the expected reward value, and even the subjective pleasantness of foods and other reinforcers are also represented in the orbitofrontal cortex.58,59 Interestingly, there is a clear difference between the effects of depression on right and left brain hemispheres in relation to functional coupling in this pathway. Our results show that it is increased in strength in the right hemisphere and decreased in the left. There is evidence that the right orbitofrontal cortex is more activated by punishment, whereas the left is activated more by positive rewards.60 This may therefore possibly reflect in-creased responsivity to negative stimuli (right hemi-sphere) and decreased responses to positive stimuli (left) typically found in depressed patients. Since there are also strengthened connections between the right inferior frontal gyrus and the right inferior orbitofrontal cortex, and also the medial frontal gyrus in depressed patients in the attention circuit, this might also reflect an increased attentional bias toward negative stimuli.
Another main pathway affected in both groups of depressed patients was that between the hippocam-pus and parahippocampal gyrus. This may reflect aspects of impaired memory functions in depressed patients. Interestingly, there is increasing evidence that neurogenesis in the hippocampus is important for learning and there may be a link between depression and reduced neurogenesis in the hippo-campus.61,62Loss of hippocampal neurons is found in some depressive individuals and correlates with impaired memory and dysthymic mood. Antidepres-sant drugs that increase serotonin levels in the brain may also help by stimulating neurogenesis and increasing the total mass of the hippocampus thereby helping to restore mood and memory dysfunction.63
The main focus of this study was to identify functional pathways altered in both FEMDD and RMDD patients who were currently suffering from severe depression in order to try and help establish which ones are most strongly linked with depression
per se. There were clearly a large number of differences between the patient groups, which emphasizes the importance of not basing analyses of potential brain correlates of depression on a single type of patient group. However, it must be empha-sized that the RMDD group had only been drug-treatment free for 24 h compared with at least 2 weeks for the FEMDD group and so some of the differences observed in the two groups could be drug related although obviously in the REMDD group their severe depression symptoms had not ameliorated significantly in response to these drugs. It is clear that it would need a more detailed investigation on
drug-free patients in the two groups to establish which differences between the two patient groups could be of potential relevance. However, as already mentioned above, it is of particular interest at this stage that alterations in amygdala and cingulate connectivity, which have often been considered to be central to neural circuitry involved in depression, are different in these two patient groups despite both having similar current levels of severe depression.
Conflict of interest
The authors declare no conflict of interest.
Acknowledgments
SG was supported by The National Natural Science Foundation of China (NSFC) (10901049) and excel-lent taexcel-lent of Hunan Normal University (ET11001) and Key Laboratory of Computational and Stochastic Mathematics and Its Application of Hunan Province (11K038). TG was supported by the China Scholar-ship Council (CSC). ZL was supported by research grants from the NSFC (81071092), the National Basic Research Program of China (2007CB512300), and the 11th Five-Year Key Program for Science and Technol-ogy Development of China (2007BAI17B05). JF is a Royal Society Wolfson Research Merit Award holder, partially supported by an EU Grant BION, a UK EPSRC grant and National Centre for Mathematics and Interdisciplinary Sciences (NCMIS) in Chinese Academy of Sciences.
References
1 Raichle M. The brain’s dark energy.Sci Am Mag2010;302: 44–49. 2 Zhang D, Raichle ME. Disease and the brain’s dark energy.Nat Rev
Neurol2010;6: 15–28.
3 Zhang D, Snyder AZ, Fox MD, Sansbury MW, Shimony JS, Raichle ME. Intrinsic functional relations between human cerebral cortex and thalamus.J Neurophysiol2008;100: 1740.
4 Greicius MD, Flores BH, Menon V, Glover GH, Solvason HB, Kenna H et al. Resting-state functional connectivity in major depression: abnormally increased contributions from subgenual cingulate cortex and thalamus.Biol Psychiatry2007;62: 429–437. 5 Anand A, Li Y, Wang Y, Lowe MJ, Dzemidzic M. Resting state corticolimbic connectivity abnormalities in unmedicated bipolar disorder and unipolar depression.Psychiatry Res2009; 171: 189–198.
6 Anand A, Li Y, Wang Y, Wu J, Gao S, Bukhari Let al.Activity and connectivity of brain mood regulating circuit in depression: a functional magnetic resonance study. Biol Psychiatry 2005; 57: 1079–1088.
7 Anand A, Li Y, Wang Y, Wu J, Gao S, Bukhari L et al.
Antidepressant effect on connectivity of the mood-regulating circuit: an FMRI study. Neuropsychopharmacology 2005; 30: 1334–1344.
8 Kiviniemi V, Kantola JH, Jauhiainen J, Hyva¨rinen A, Tervonen O. Independent component analysis of nondeterministic fMRI signal sources.Neuroimage2003;19: 253–260.
9 McKeown MJ, Makeig S, Brown GG, Jung TP, Kindermann SS, Bell AJ et al. Analysis of fMRI data by blind separation into independent spatial components.Human Brain Mapping 1998; 6: 160–188.
10 Smith SM, Fox PT, Miller KL, Glahn DC, Fox PM, Mackay CEet al.
Correspondence of the brain’s functional architecture during activation and rest.Proc Natl Acad Sci2009;106: 13040. 11 Greicius MD, Krasnow B, Reiss AL, Menon V. Functional
connectivity in the resting brain: a network analysis of the default mode hypothesis.Proc Natl Acad Sci2003;100: 253.
12 Fox MD, Snyder AZ, Vincent JL, Corbetta M, Van Essen DC, Raichle ME. The human brain is intrinsically organized into dynamic, anticorrelated functional networks.Proc Natl Acad Sci USA2005;102: 9673.
13 Biswal B, Yetkin FZ, Haughton VM, Hyde JS. Functional connectivity in the motor cortex of resting human brain using echo-planar MRI.Magn Reson Med1995;34: 537–541.
14 Cole DM, Smith SM, Beckmann CF. Advances and pitfalls in the analysis and interpretation of resting-state FMRI data.Front Syst Neurosci2010;4: 8.
15 Yang B, Liu J, Feng J. On the spectral characterization and scalable mining of network communities.Knowledge and Data Engineer-ing, IEEE Transactions On; doi:10.1109/TKDE.2010.233 (in press). 16 Zeki S, Romaya JP. Neural correlates of hate.PLoS One2008;3:
e3556.
17 Hamilton M. A rating scale for depression.J Neurol Neurosurg Psychiatry1960;23: 56.
18 Miller IW, Bishop S, Norman WH, Maddever H. The modified Hamilton rating scale for depression: reliability and validity.
Psychiatry Res1985;14: 131–142.
19 Furtado CP, Maller JJ, Fitzgerald PB. A magnetic resonance imaging study of the entorhinal cortex in treatment-resistant depression.Psychiatry Res2008;163: 133–142.
20 Shah PJ, Ebmeier KP, Glabus MF, Goodwin GM. Cortical grey matter reductions associated with treatment-resistant chronic unipolar depression. Controlled magnetic resonance imaging study.Br J Psychiatry1998;172: 527.
21 Nierenberg A, Amsterdam J. Treatment-resistant depression: definition and treatment approaches. Discussion.J Clin Psychiatry
1990;51: 39–50.
22 Iidaka T, Nakajima T, Suzuki Y, Okazaki A, Maehara T, Shiraishi H. Quantitative regional cerebral blood flow measured by Tc-99m HMPAO SPECT in mood disorder.Psychiatry Res1997; 68: 143–154.
23 Yan C, Zang Y. DPARSF: a MATLAB toolbox for ‘pipeline’ data analysis of resting-state fMRI.Front Syst Neurosci2010;4: 13. 24 Tzourio-Mazoyer N, Landeau B, Papathanassiou D, Crivello F,
Etard O, Delcroix N et al. Automated anatomical labeling of activations in SPM using a macroscopic anatomical parcellation of the MNI MRI single-subject brain.Neuroimage2002;15: 273–289. 25 Biswal BB, Mennes M, Zuo XN, Gohel S, Kelly C, Smith SMet al.
Toward discovery science of human brain function. Proc Natl Acad Sci2010;107: 4734.
26 Bartels A, Zeki S. The neural basis of romantic love.Neuroreport
2000;11: 3829.
27 Bartels A, Zeki S. The neural correlates of maternal and romantic love.Neuroimage2004;21: 1155–1166.
28 Fisher HE, Brown LL, Aron A, Strong G, Mashek D. Reward, addiction, and emotion regulation systems associated with rejection in love.J Neurophysiol2010;104: 51.
29 Chen YH, Dammers J, Boers F, Leiberg S, Edgar JC, Roberts TPL
et al.The temporal dynamics of insula activity to disgust and happy facial expressions: a magnetoencephalography study.
Neuroimage2009;47: 1921–1928.
30 Surguladze SA, El-Hage W, Dalgleish T, Radua J, Gohier B, Phillips ML. Depression is associated with increased sensitivity to signals of disgust: a functional magnetic resonance imaging study.
J Psychiatric Res2010;44: 894–902.
31 Wylie KP, Tregellas JR. The role of the insula in schizophrenia.
Schizophr Res2010;123: 93–104.
32 Calder AJ, Keane J, Manes F, Antoun N, Young AW. Impaired recognition and experience of disgust following brain injury.Nat Neurosci2000;3: 1077–1078.
33 Calder AJ, Lawrence AD, Young AW. Neuropsychology of fear and loathing.Nat Rev Neurosci2001;2: 352–363.
34 Fitzgerald PB, Laird AR, Maller J, Daskalakis ZJ. A meta analytic study of changes in brain activation in depression.Human Brain Mapping2008;29: 683–695.
H Taoet al
35 Husain MM, McDonald WM, Doraiswamy PM, Figiel GS, Na C, Escalona PR et al. A magnetic resonance imaging study of putamen nuclei in major depression. Psychiatry Res1991; 40: 95–99.
36 Meyer JH, McNeely HE, Sagrati S, Boovariwala A, Martin K, Verhoeff Net al.Elevated putamen D2 receptor binding potential in major depression with motor retardation: an [11C] raclopride positron emission tomography study.Am J Psychiatry2006;163: 1594. 37 Michel TM, Camara S, Tatschner T, Frangou S, Sheldrick AJ,
Riederer Pet al.Increased xanthine oxidase in the thalamus and putamen in depression.World J Biol Psychiatry2010;11: 314–320. 38 Vataja R, Leppavuori A, Pohjasvaara T, Mantyla R, Aronen HJ, Salonen O et al. Poststroke depression and lesion location revisited.J Neuropsychiatry Clin Neurosci2004;16: 156. 39 Craig A. How do you feel—now? The anterior insula and human
awareness.Nat Rev Neurosci2009;10: 59–70.
40 Wiebking C, Bauer A, de Greck M, Duncan NW, Tempelmann C, Northoff G. Abnormal body perception and neural activity in the insula in depression: an fMRI study of the depressed ‘material me’.
World J Biol Psychiatry2010;11: 538–549.
41 Leung KK, Lee T, Wong M, Li L, Yip P, Khong PL. Neural correlates of attention biases of people with major depressive disorder: a voxel-based morphometric study.Psychol Med2009;39: 1097–1106. 42 Ebmeier K, Rose E, Steele D. Cognitive impairment and fMRI in
major depression.Neurotox Res2006;10: 87–92.
43 McCaig RG, Dixon M, Keramatian K, Liu I, Christoff K. Improved modulation of rostrolateral prefrontal cortex using real-time fMRI training and meta-cognitive awareness. Neuroimage 2010; 55: 1298–1305.
44 Aron AR, Robbins TW, Poldrack RA. Inhibition and the right inferior frontal cortex.Trends Cogn Sci2004;8: 170–177. 45 Swick D, Ashley V. Left inferior frontal gyrus is critical for
response inhibition.BMC Neurosci2008;9: 102.
46 Christopoulos GI, Tobler PN, Bossaerts P, Dolan RJ, Schultz W. Neural correlates of value, risk, and risk aversion contributing to decision making under risk.J Neurosci2009;29: 12574. 47 Knoch D, Gianotti LRR, Pascual-Leone A, Treyer V, Regard M,
Hohmann Met al.Disruption of right prefrontal cortex by low-frequency repetitive transcranial magnetic stimulation induces risk-taking behavior.J Neurosci2006;26: 6469.
48 Fecteau S, Pascual-Leone A, Zald DH, Liguori P, The´oret H, Boggio PS et al. Activation of prefrontal cortex by transcranial direct current stimulation reduces appetite for risk during ambiguous decision making.J Neurosci2007;27: 6212.
49 Macuga KL, Frey SH. Selective responses in right inferior frontal and supramarginal gyri differentiate between observed movements of oneself vs. another.Neuropsychologia2011;49: 1202–1207. 50 Rizzolatti G, Sinigaglia C. The functional role of the parieto-frontal
mirror circuit: interpretations and misinterpretations. Nat Rev Neurosci2010;11: 264–274.
51 Klumpp H, Deldin P. Review of brain functioning in depression for semantic processing and verbal fluency.Int J Psychophysiol2010; 75: 77–85.
52 De´monet JF, Price C, Wise R, Frackowiak R. Differential activation of right and left posterior sylvian regions by semantic and phonological tasks: a positron-emission tomography study in normal human subjects.Neurosci Lett1994;182: 25–28. 53 Peeters R, Simone L, Nelissen K, Fabbri-Destro M, Vanduffel W,
Rizzolatti Get al.The representation of tool use in humans and monkeys: common and uniquely human features.J Neurosci2009; 29: 11523.
54 Hahn T, Marquand A, Ehlis A, Dresler T, Kittel-Schneider S, Jarczok Tet al.Integrating neurobiological markers of depression.
Arch Gen Psychiatry2010;68: 361–368.
55 Larquet M, Coricelli G, Opolczynski G, Thibaut F. Impaired decision making in schizophrenia and orbitofrontal cortex lesion patients.Schizophr Res2010;116: 266–273.
56 Chamberlain SR, Menzies L, Hampshire A, Suckling J, Fineberg NA, del Campo Net al.Orbitofrontal dysfunction in patients with obsessive-compulsive disorder and their unaffected relatives.
Science2008;321: 421.
57 Bachevalier J, Loveland KA. The orbitofrontal-amygdala circuit and self-regulation of social-emotional behavior in autism.
Neurosci Biobehav Rev2006;30: 97–117.
58 Kringelbach ML, Rolls ET. The functional neuroanatomy of the human orbitofrontal cortex: evidence from neuroimaging and neuropsychology.Prog Neurobiol2004;72: 341–372.
59 Rolls E, Hornak J, Wade D, McGrath J. Emotion-related learning in patients with social and emotional changes associated with frontal lobe damage.J Neurol Neurosurg Psychiatry1994;57: 1518. 60 O’Doherty J, Kringelbach ML, Rolls ET, Hornak J, Andrews C.
Abstract reward and punishment representations in the human orbitofrontal cortex.Nat Neurosci2001;4: 95–102.
61 Minkel J. Brain pathway may underlie depression: a crescent of electrical activity spotted in rats may allow researchers to map the depressed brain. Sci Am Mind News; http://www.sciam.com/ article.cfm, 2007.
62 Airan RD, Meltzer LA, Roy M, Gong Y, Chen H, Deisseroth K. High-speed imaging reveals neurophysiological links to behavior in an animal model of depression.Science2007;317: 819. 63 Becker S, Wojtowicz JM. A model of hippocampal neurogenesis in
memory and mood disorders.Trends Cogn Sci2007;11: 70–76.
This work is licensed under the Creative Commons Attribution-NonCommercial-Share Alike 3.0 Unported License. To view a copy of this license, visit http://creativecommons.org/ licenses/by-nc-sa/3.0/
Supplementary Information accompanies the paper on the Molecular Psychiatry website (http://www.nature.com/mp)