GBD 2015 HIV Collaborators (Including: Uthman, Olalekan A.). (2016) Estimates of global,
regional, and national incidence, prevalence, and mortality of HIV, 1980–2015 : the Global
Burden of Disease Study 2015. The Lancet HIV, 3 (8). e361-e387.
Permanent WRAP URL:
http://wrap.warwick.ac.uk/81341
Copyright and reuse:
The Warwick Research Archive Portal (WRAP) makes this work of researchers of the
University of Warwick available open access under the following conditions.
This article is made available under the Creative Commons Attribution 4.0 International
license (CC BY 4.0) and may be reused according to the conditions of the license. For more
details see:
http://creativecommons.org/licenses/by/4.0/
A note on versions:
The version presented in WRAP is the published version, or, version of record, and may be
cited as it appears here.
Estimates of global, regional, and national incidence,
prevalence, and mortality of HIV, 1980–2015: the Global
Burden of Disease Study 2015
GBD 2015 HIV Collaborators*
Summary
Background
Timely assessment of the burden of HIV/AIDS is essential for policy setting and programme evaluation.
In this report from the Global Burden of Disease Study 2015 (GBD 2015), we provide national estimates of levels and
trends of HIV/AIDS incidence, prevalence, coverage of antiretroviral therapy (ART), and mortality for 195 countries
and territories from 1980 to 2015.
Methods
For countries without high-quality vital registration data, we estimated prevalence and incidence with data
from antenatal care clinics and population-based seroprevalence surveys, and with assumptions by age and sex on
initial CD4 distribution at infection, CD4 progression rates (probability of progression from higher to lower CD4
cell-count category), on and off antiretroviral therapy (ART) mortality, and mortality from all other causes.
Our estimation strategy links the GBD 2015 assessment of all-cause mortality and estimation of incidence and
prevalence so that for each draw from the uncertainty distribution all assumptions used in each step are internally
consistent. We estimated incidence, prevalence, and death with GBD versions of the Estimation and Projection
Package (EPP) and Spectrum software originally developed by the Joint United Nations Programme on HIV/AIDS
(UNAIDS). We used an open-source version of EPP and recoded Spectrum for speed, and used updated assumptions
from systematic reviews of the literature and GBD demographic data. For countries with high-quality vital registration
data, we developed the cohort incidence bias adjustment model to estimate HIV incidence and prevalence largely
from the number of deaths caused by HIV recorded in cause-of-death statistics. We corrected these statistics for
garbage coding and HIV misclassifi cation.
Findings
Global HIV incidence reached its peak in 1997, at 3·3 million new infections (95% uncertainty interval [UI]
3·1–3·4 million). Annual incidence has stayed relatively constant at about 2·6 million per year (range 2·5–2·8 million)
since 2005, after a period of fast decline between 1997 and 2005. The number of people living with HIV/AIDS has been
steadily increasing and reached 38·8 million (95% UI 37·6–40·4 million) in 2015. At the same time, HIV/AIDS
mortality has been declining at a steady pace, from a peak of 1·8 million deaths (95% UI 1·7–1·9 million) in 2005, to
1·2 million deaths (1·1–1·3 million) in 2015. We recorded substantial heterogeneity in the levels and trends of HIV/AIDS
across countries. Although many countries have experienced decreases in HIV/AIDS mortality and in annual new
infections, other countries have had slowdowns or increases in rates of change in annual new infections.
Interpretation
Scale-up of ART and prevention of mother-to-child transmission has been one of the great successes of
global health in the past two decades. However, in the past decade, progress in reducing new infections has been slow,
development assistance for health devoted to HIV has stagnated, and resources for health in low-income countries
have grown slowly. Achievement of the new ambitious goals for HIV enshrined in Sustainable Development Goal 3
and the 90-90-90 UNAIDS targets will be challenging, and will need continued eff orts from governments and
international agencies in the next 15 years to end AIDS by 2030.
Funding
Bill & Melinda Gates Foundation, and National Institute of Mental Health and National Institute on Aging,
National Institutes of Health.
Copyright
© The Author(s). Published by Elsevier Ltd. This is an Open Access article under the CC BY license
Introduction
HIV/AIDS is a leading cause of death and disease
burden, especially in sub-Saharan Africa.
1–5Introduction of
antiretroviral therapy (ART) in 1996 greatly reduced
HIV-related mortality.
6,7Creation of the Joint United
Nations Programme on HIV/AIDS (UNAIDS) in 1996; the
Global Fund to Fight AIDS, Tuberculosis and Malaria in
2002; and the US President’s Emergency Plan for AIDS
Relief (PEPFAR) in 2003, galvanised the mobilisation of
resources to combat the HIV epidemic. In the past 15 years,
the global com munity has provided US$109·8 billion of
development assistance to curb the HIV/AIDS epidemic.
8As a result, HIV mortality has declined overall in
low-income and middle-income countries since 2004.
1The success of ART and prevention of mother-to-child
transmission programmes led to ambitious calls to
Lancet HIV 2016; 3: e361–87
Published Online
July 19, 2016
http://dx.doi.org/10.1016/ S2352-3018(16)30087-X
This online publication has been corrected. The corrected version fi rst appeared at thelancet.com/hiv on August 22, 2016
See Comment page e337 *Collaborators listed at the end of the Article
Correspondence to: Dr Haidong Wang, Institute for Health Metrics and Evaluation, University of Washington, Seattle, WA 98121, USA
eliminate HIV as a public health threat. However,
maintenance and scale-up of suffi
ciently funded AIDS
eff orts will be crucial to realise the goal of ending the
AIDS epidemic as a public health threat by 2030.
9Achievement of these goals, including the UNAIDS
90-90-90 targets, which aim to have 90% of people living
with HIV know their status, 90% of those detected
treated with ART, and 90% of those receiving treatment
achieving viral load suppression,
10requires a coordinated
global scale-up of prevention pro grammes, pre-exposure
prophylaxis (PrEP), and detection and treatment
programmes.
11However, development assistance for
health targeted for HIV has stagnated since 2010, and, in
many low-income countries, national resources for
health are scarce and expected to grow slowly.
12,13The ambitious goals set forth by the global community,
and the few resources available to combat HIV/AIDS,
emphasise the importance of under
standing and
monitoring the trends of each country’s HIV/AIDS
epidemic. Measurement of disease burden according to
geographic units enables comparison with other major
dominant cause of health loss and where the burden is
still rising in spite of national and global eff orts. Such
measurement also enables direct comparison of
diff erent HIV/AIDS metrics, emphasising the specifi c
needs of each geographic region and allowing for a
more targeted response to the epidemic.
UNAIDS produces a biannual assessment of
incidence of infections, prevalence of people living with
HIV, and deaths from HIV/AIDS;
14the Global Burden of
Disease Study (GBD) provides an alternative assessment
of these rates. UNAIDS and GBD estimates have
increasingly converged at the global level.
2Nevertheless,
estimates diff er substantially in several countries,
particularly in middle-income and high-income
countries, where GBD estimates are based on data from
vital registration systems and UNAIDS estimates are
based on prevalence in high-risk groups and estimates
of the fraction of the population in these groups. This
report from GBD 2015 provides a unique perspective on
the national-level epidemiology of HIV/AIDS, which
includes a comprehensive assessment of HIV/AIDS
Research in context
Evidence before this study
We searched PubMed between Aug 18, 2015, and
April 3, 2016, for studies that comprehensively assessed the
burden of HIV/AIDS globally. Our search terms included “HIV”
and “global” and “mortality” or “incidence” or “prevalence”,
and searches were restricted to articles published in English up
to April 1, 2016. To our knowledge through the search, Global
Burden of Disease (GBD) and UNAIDS are the only two sources
that provide comparable evaluations of levels and trends of
the HIV/AIDS epidemic at both the global and country level.
UNAIDS has provided global estimates on HIV/AIDS since
1997, and has developed two epidemiological programs to
estimate incidence, prevalence, and mortality: Estimation and
Projection Package (EPP) and Spectrum. GBD 2013 used
improved versions of Spectrum to generate comprehensive,
comparable estimates of levels and trends of HIV/AIDS
incidence, prevalence, and mortality across geographies.
Studies from both organisations have shown rapid changes in
the HIV/AIDS epidemic worldwide and that up-to-date
epidemiological and demographic information is needed to
more accurately assess the burden of HIV at both the country
and global level.
Added value of this study
For GBD 2015, we systematically updated the key inputs to
our HIV/AIDS estimation process, which includes prevalence
from national surveys and antenatal care clinics, demographic
input on fertility and migration, mortality on and off
antiretroviral therapy (ART), and background HIV-free
mortality; updates to these inputs were concluded in
April, 2016; October, 2015; December, 2015; and April, 2016,
respectively. We also improved the integration of EPP,
Spectrum, and the GBD all-cause mortality estimation process
to make them internally consistent. For countries with
high-quality vital registration data, we developed a new
method to improve the accuracy of and consistency among
estimates of HIV/AIDS incidence, prevalence, and mortality
leveraging the number of deaths recorded each year as caused
by HIV/AIDS. This method also allowed us to use vital
registration data to generate plausible incidence curves in
countries that are not part of UNAIDS’ results, and in
subnational units where we previously only had national-level
data. We developed an ensemble model to reconcile HIV
mortality estimates from EPP and Spectrum and from those
indicated in GBD’s all-cause mortality estimation process.
Remarkable progress has been made in curbing the HIV/AIDS
epidemic worldwide; however, our fi ndings emphasise the
need for continued eff orts from governments and
international agencies in the next 15 years to end AIDS by
2030, in view of the low ART coverage and stagnation in
decline of annual new infections in the past decade.
Implications of all available evidence
Methods
Study design
GBD is a systematic, scientifi c eff ort to quantify all-cause
mortality; cause-specifi c mortality; and disease incidence,
prevalence, and burden attributable to risk factors by age,
sex, and geography over time. GBD 2015 includes
195 countries and territories and covers the time span
from 1980 to 2015. Additional details of the GBD cause
hierarchy, data inputs and processing, and estimation
methods have been published elsewhere.
15In brief, the GBD estimation framework for HIV/AIDS
used the general natural history epidemiological models,
Estimation and Projection Package (EPP) and Spectrum,
developed by UNAIDS for estimation of the burden of
HIV/AIDS for their biannual report on the state of the
HIV/AIDS epidemic at the global and country levels.
1EPP uses HIV seroprevalence estimates from surveys
and antenatal care clinics to estimate incidence curves
that are consistent with the input data of prevalence and
other factors, including on-ART and off -ART mortality
and demographic information within the given
population. Spectrum, a compartmental model, is used
to generate age-specifi c and sex-specifi c incidence,
prevalence, and mortality by use of the incidence curves
generated in EPP and other key inputs, including
program data on ART and prevention of mother-to-child
transmission and other key assumptions of
on-ART and
off -ART mortality and HIV-free background mortality.
Details of methods and parameters in EPP and Spectrum
have been described previously.
16–23In GBD 2015, we improved on UNAIDS’ estimation
procedures in four ways. First, we used additional data,
both from vital registration systems and population
health surveys, to measure seroprevalence. Second, we
used consistent estimates of HIV-free mortality in both
EPP and Spectrum, and in the estimation of on-ART and
off
-ART mortality—key inputs to both EPP and
Spectrum. These HIV-free mortality rates, generated in
GBD’s all-cause mortality estimation process, have
linked our HIV/AIDS estimation process and the
all-cause mortality estimation process. Third, we
developed an adjustment process—cohort incidence bias
adjust
ment—to ensure that incidence and prevalence
estimates formulated with Spectrum are consistent with
HIV mortality estimates based on vital registration
systems when available. Fourth, through an expanded
literature search, we updated rates of on-ART mortality
(appendix pp 6–10), particularly for developed countries,
in close collaboration with the Antiretroviral Therapy
Cohort Collaboration.
24Due to the interconnected nature of the HIV modelling
process and the process of estimation of mortality and
causes of death, data and codes for the GBD 2015 HIV
estimation process will be made available along with all
the GBD 2015 results, in compliance with the Guidelines
for Accurate and Transparent Health Estimates Reporting
(GATHER) developed by the WHO.
25Mortality estimation
The GBD estimation framework contains three sources
for estimates of HIV-specifi c mortality: estimated HIV
mortality from Spectrum; estimated excess HIV/AIDS
mortality in our all-cause mortality estimation process;
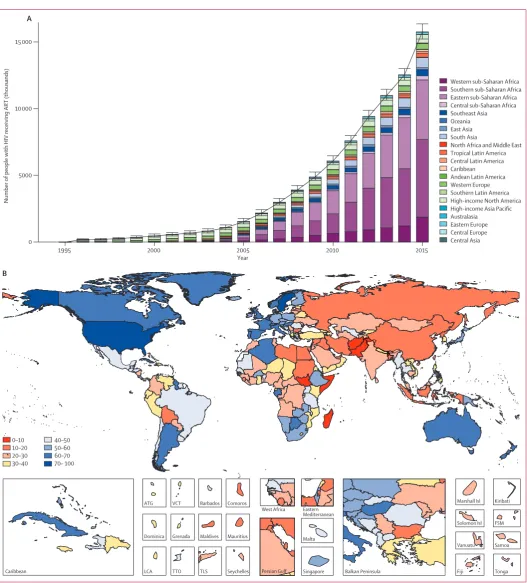
15 [image:4.595.264.565.209.725.2]and space–time Gaussian process regression smoothed
cause-specifi c HIV/AIDS mortality from vital registration
Figure 1: Evolution of the HIV epidemic from 1980 to 2015
Global estimates of new HIV infections (A), people living with HIV/AIDS (B), HIV/AIDS deaths (C), and proportion of people living with HIV receiving ART (D). Shaded areas show 95% uncertainty intervals. ART=antiretroviral therapy.
0 1000 2000 3000 4000
A
0 10 000 20 000 30 000 40 000
0 500 1000 1500 2000
0 10 20 30 40
1980 1990 2000 2010
Year
Number of new infections (thousands)
People living with HIV/AIDS (thousands)
Deaths due to HIV/AIDS (thousands)
Proportion of people living with HIV receiving ART (%)
Both sexes Women Men
B
C
D
Figure 2: Incidence of new HIV infections from 1980 to 2015, and HIV incidence in 2015
Global number of new HIV infections by region (A). Bars show the mean number of estimated new infections within a given year. Error bars represent 95% uncertainty intervals. Each Global Burden of Disease region is represented by a separate colour. HIV incidence by country (B). We calculated incidence as cumulative new cases of HIV throughout the year divided by the total population at the mid-year. Rates are per 100 000 people. Colour bins correspond to the 0–50th, 50–70th, 70–80th, 80–90th, 90th–92nd, 92nd–94th, 96–98th, 98–99th, and 99–100th percentiles to highlight variation
0 1000 2000 3000
1980 1990 2000 2010
Year
Number of new infections (thousands)
Western sub-Saharan Africa Southern sub-Saharan Africa Eastern sub-Saharan Africa Central sub-Saharan Africa Southeast Asia Oceania East Asia South Asia
North Africa and Middle East Tropical Latin America Central Latin America Caribbean Andean Latin America Western Europe Southern Latin America High-income North America High-income Asia Pacific Australasia
Eastern Europe Central Europe Central Asia
B
A
152–200 200–348 348–707 707–1043 1043–1163 0–8
8–20 20–46 46–97 97– 152
Persian Gulf
Caribbean LCA
Dominica ATG
TTO Grenada VCT
TLS Maldives Barbados
Seychelles Mauritius Comoros
West Africa Eastern Mediterranean
Malta
Singapore Balkan Peninsula Tonga
Samoa FSM
Fiji Solomon Isl Marshall Isl
systems that were adjusted for incompleteness and
misclassifi cation of causes of death. We used tailored
estimation methods to produce fi nal estimates of
mortality depending on age groups, and the availability
and quality of data for mortality of HIV/AIDS.
We assigned countries and territories to one of four
groups, depending on data availability and quality. Group 1
included countries with prevalence data from either
household surveys or antenatal care clinics, most of which
have generalised epidemics. Group 2A referred to
countries with high-quality vital registration systems,
which in GBD 2015 included countries with more than
25 years of vital registration data with more than 95%
completeness. Group 2B referred to countries with vital
registration systems that were not in group 2A. Group 2C
included countries for which we had no data from a vital
registration system. Briefl y, for adults in group 1 countries,
we applied an ensemble model to average HIV/AIDS
mortality rates from Spectrum and those implied by the
all-cause mortality estimation process. This approach was
based on the fact that our estimation processes (appendix
pp 12–15) in EPP, Spectrum, and all-cause mortality
models were intrinsically linked by the same HIV-free
mortality rates at the draw level for group 1 countries.
Because EPP and Spectrum are largely based on prevalence
estimates from surveys and antenatal care clinics and
various assumptions, and all-cause mortality estimation
process in group 1 countries are mostly based on sibling
survival data with various biases that need to be corrected
for, we used our ensemble model to give equal weights to
HIV mortality estimates from the two processes.
For adults in group 2A countries, we used the results
from space–time Gaussian process regression for
age-specifi c HIV mortality. For adults in group 2B and
2C countries, we used the HIV-specifi c mortality rates
from Spectrum with cohort incidence bias adjustment.
For children younger than 5 years in group 1, we applied
the proportion of all HIV deaths estimated within
Spectrum to the age-specifi
c all-cause mortality
estimates. For children of this age in group 2A countries,
we used space–time Gaussian process regression
estimates of HIV mortality. For children aged 5–14 years
from countries in group 1, we used the average of the
HIV-specifi c mortality rates from Spectrum and the
implied HIV mortality from the all-cause mortality
process. For group 2A countries, we used estimates of
HIV mortality from space–time Gaussian process
regression. For groups 2B and 2C, we used the estimates
of HIV-specifi c mortality from Spectrum.
Incidence and prevalence estimation
We generated incidence and prevalence estimates with
the recoded Spectrum model with updated assumptions
of on-ART and off -ART mortality and other program data
from the UNAIDS country fi les.
HIV cause-specifi c deaths from vital registration
systems and sample registration systems are among the
most reliable sources for estimation of the burden of
HIV/AIDS. We used our cohort incidence bias
adjust-ment method to scale the sizes of each incidence cohort
on the basis of the raw estimates of HIV mortality from
Spectrum, using unadjusted incidence curves and those
observed in the vital registration system with proper
incompleteness and cause misclassifi cation
adjust-ments.
15For this procedure, we fi rst ran space–time
Gaussian process regression on age-specifi c HIV/AIDS
mortality rates after correcting for garbage codes, HIV
misclassifi cation, and under-registration by use of
formal demographic methods to generate complete
time-series estimates by location, sex, year, and age. We
then restructured Spectrum by addition of another
com-partment such that it could follow groups of people
living with HIV/AIDS who were infected in a specifi c
year and age group. We then ran the modifi ed program
to produce 1000 draws of incidence, prevalence, and
mortality for each location and sex combination. From
this step, we were able to obtain the proportion of each
infection cohort dying in each year and age cell after
infection. We then used these proportions to weigh the
ratio of the numbers of deaths based on the age-specifi c
mortality rates from vital registration and processed by
space–time Gaussian process regression, and the
population estimated with Spectrum, and those directly
from Spectrum. This process greatly improves both the
model fi t on mortality data, closer to what the adjusted
vital registration suggests, and the incidence mortality
ratio. Further details of the method are described in
appendix pp 13–15.
Uncertainty analysis
We systematically propagated uncertainty across EPP,
Spectrum, and the all-cause mortality estimation
processes. We used 1000 draws of the quantities of
interest throughout all the steps in the estimation
process. Some key inputs to the HIV estimation process
did not include uncertainty: these were estimates of
fertility and population, HIV programme metrics
(including coverage of ART and prevention of
mother-to-child transmission), and behavioural factors. We present
results with 95% uncertainty intervals (UIs).
Role of the funding source
The funder of the study had no role in study design, data
collection, data analysis, data interpretation, or writing of
the report. The corresponding author had full access to
all the data in the study and had fi nal responsibility for
the decision to submit for publication.
Results
New infections (in thousands)
People living with HIV (in thousands)
HIV/AIDS deaths (in thousands)
ART coverage per 100 people living with HIV (%)
Age-standardised incidence ARC from 2005 to 2015
Age-standardised prevalence ARC from 2005 to 2015
Age-standardised mortality ARC from 2005 to 2015
Global 2450·92
(2236·13 to 2686·79)
38 802·50
(37 635·88 to 40 371·67)
1192·57 (1131·11 to 1270·05)
40·60 (39·36 to 41·80)
–0·02 (–0·03 to –0·01)
0·01 (0·00 to 0·01)
–0·05 (–0·06 to –0·05)
High SDI 101·75
(75·18 to 146·96)
2204·18 (1751·36 to 2799·27)
33·51 (31·96 to 35·43)
51·49 (43·90 to 57·55)
0·01 (–0·01 to 0·04)
0·01 (0·00 to 0·02)
–0·01 (–0·02 to –0·01)
High-to-middle SDI 646·76 (557·07 to 748·55)
10 421·94 (9873·26 to 10 989·83)
240·15 (224·08 to 259·28)
48·01 (45·99 to 50·13)
–0·02 (–0·03 to –0·01)
0·01 (0·01 to 0·02)
–0·05 (–0·06 to –0·05)
Middle SDI 298·33
(238·18 to 394·91)
4155·45 (3616·14 to 5163·64)
131·57 (111·27 to 183·00)
37·66 (32·68 to 40·83)
0·00 (–0·02 to 0·02)
0·02 (0·01 to 0·03)
–0·02 (–0·04 to –0·00)
Low-to-middle SDI 796·30 (655·25 to 951·76)
11 783·44
(11 251·57 to 12 472·97)
408·87 (368·10 to 457·42)
35·48 (33·62 to 37·52)
–0·01 (–0·03 to 0·01)
–0·00 (–0·01 to 0·00)
–0·06 (–0·07 to –0·06)
Low SDI 606·54
(510·14 to 707·36)
10 213·36 (9762·90 to 10 684·37)
377·68 (350·43 to 408·08)
37·89 (35·93 to 39·79)
–0·05 (–0·07 to –0·03)
–0·01 (–0·02 to –0·01)
–0·08 (–0·09 to –0·07)
High-income 45·67
(37·88 to 53·92)
1660·18 (1359·94 to 1997·98)
13·95 (13·79 to 14·11)
66·91 (64·76 to 69·43)
–0·01 (–0·02 to –0·00)
–0·00 (–0·01 to 0·00)
–0·06 (–0·06 to –0·05)
High-income North America
24·16 (18·76 to 31·10)
882·60 (692·93 to 1136·45)
7·89 (7·79 to 7·98)
69·86 (66·81 to 73·51)
–0·02 (–0·04 to –0·01)
–0·00 (–0·01 to 0·00)
–0·07 (–0·07 to –0·07)
Canada 1·11
(0·18 to 2·81)
49·25 (15·89 to 102·34)
0·31 (0·29 to 0·33)
64·14 (56·58 to 73·43)
–0·03 (–0·14 to 0·02)
–0·01 (–0·03 to 0·01)
–0·06 (–0·07 to –0·05)
Greenland 0·00
(0·00 to 0·01)
0·23 (0·06 to 0·55)
0·00 (0·00 to 0·00)
61·88 (52·84 to 69·43)
–0·10 (–0·65 to –0·02)
–0·01 (–0·03 to 0·00)
–0·03 (–0·07 to 0·01)
USA 23·04
(17·68 to 29·96)
833·03 (648·62 to 1078·06)
7·57 (7·48 to 7·67)
70·18 (67·09 to 74·00)
–0·02 (–0·04 to –0·01)
–0·00 (–0·01 to 0·00)
–0·07 (–0·07 to –0·07)
Australasia 0·45
(0·19 to 0·89)
18·69 (7·37 to 37·10)
0·10 (0·09 to 0·10)
62·24 (57·73 to 67·54)
–0·02 (–0·04 to –0·01)
–0·00 (–0·01 to 0·00)
–0·04 (–0·05 to –0·03)
Australia 0·39
(0·15 to 0·84)
16·24 (5·20 to 34·28)
0·09 (0·08 to 0·09)
62·38 (57·07 to 68·35)
–0·02 (–0·03 to –0·01)
–0·01 (–0·02 to 0·00)
–0·04 (–0·05 to –0·03)
New Zealand 0·06
(0·02 to 0·13)
2·45 (0·71 to 5·38)
0·01 (0·01 to 0·01)
60·68 (54·45 to 68·06)
–0·03 (–0·10 to –0·01)
0·00 (–0·01 to 0·01)
–0·04 (–0·05 to –0·03)
High-income Asia Pacifi c
0·75 (0·55 to 1·02)
22·06 (14·82 to 35·17)
0·32 (0·31 to 0·33)
49·98 (45·98 to 53·54)
–0·03 (–0·09 to –0·00)
0·02 (0·01 to 0·03)
–0·01 (–0·01 to –0·01)
Brunei 0·01
(0·00 to 0·03)
0·26 (0·09 to 0·59)
0·00 (0·00 to 0·00)
37·66 (29·23 to 47·75)
–0·03 (–0·16 to 0·02)
0·02 (–0·00 to 0·04)
–0·02 (–0·06 to 0·01)
Japan 0·50
(0·40 to 0·60)
10·41 (8·40 to 12·69)
0·17 (0·17 to 0·17)
57·43 (55·29 to 60·02)
0·01 (–0·00 to 0·02)
0·04 (0·03 to 0·04)
–0·03 (–0·03 to –0·03)
Singapore 0·05
(0·02 to 0·10)
1·85 (0·60 to 4·06)
0·01 (0·01 to 0·01)
54·61 (45·56 to 64·61)
0·01 (–0·05 to 0·05)
0·01 (–0·01 to 0·02)
0·12 (0·11 to 0·12)
South Korea 0·19
(0·02 to 0·43)
9·54 (2·92 to 21·96)
0·14 (0·13 to 0·14)
39·34 (31·76 to 47·08)
–0·12 (–0·32 to –0·04)
0·00 (–0·01 to 0·02)
0·01 (0·01 to 0·02)
Western Europe 12·89 (9·48 to 16·95)
651·38 (448·53 to 896·75)
3·42 (3·35 to 3·50)
63·81 (60·91 to 67·06)
–0·03 (–0·04 to –0·02)
–0·01 (–0·01 to –0·00)
–0·06 (–0·06 to –0·05)
Andorra 0·00
(0·00 to 0·01)
0·21 (0·02 to 1·37)
0·00 (0·00 to 0·01)
57·49 (32·52 to 80·56)
–0·04 (–0·72 to 0·10)
0·01 (–0·03 to 0·08)
–0·01 (–0·08 to 0·08)
Austria 0·31
(0·10 to 0·71)
11·65 (2·72 to 28·30)
0·04 (0·04 to 0·04)
55·15 (48·70 to 62·52)
–0·04 (–0·09 to –0·01)
0·01 (–0·00 to 0·02)
–0·06 (–0·06 to –0·05)
Belgium 0·21
(0·06 to 0·47)
10·68 (2·90 to 25·23)
0·05 (0·05 to 0·05)
61·74 (55·20 to 68·73)
–0·03 (–0·12 to 0·00)
–0·00 (–0·02 to 0·01)
–0·04 (–0·05 to –0·04)
Cyprus 0·01
(0·00 to 0·03)
0·39 (0·11 to 0·88)
0·00 (0·00 to 0·00)
48·50 (40·52 to 58·86)
–0·06 (–0·67 to 0·02)
0·01 (–0·01 to 0·03)
0·00 (–0·04 to 0·03)
Denmark 0·13
(0·03 to 0·30)
7·67 (2·13 to 15·27)
0·03 (0·02 to 0·03)
62·61 (55·63 to 70·23)
–0·06 (–0·19 to –0·01)
–0·00 (–0·02 to 0·01)
–0·05 (–0·06 to –0·04)
Finland 0·03
(0·01 to 0·08)
1·35 (0·36 to 3·09)
0·01 (0·01 to 0·01)
57·85 (51·54 to 64·82)
–0·06 (–0·19 to –0·02)
0·00 (–0·01 to 0·02)
–0·04 (–0·05 to –0·04)
France 0·96
(0·36 to 2·04)
79·17 (23·19 to 175·70)
0·49 (0·46 to 0·52)
63·37 (54·81 to 71·07)
–0·04 (–0·08 to –0·02)
–0·02 (–0·04 to –0·01)
–0·07 (–0·08 to –0·07)
Germany 1·76
(0·65 to 3·66)
60·55 (17·98 to 129·32)
0·43 (0·41 to 0·46)
55·55 (47·85 to 64·54)
–0·01 (–0·04 to 0·01)
0·01 (–0·00 to 0·03)
–0·03 (–0·04 to –0·03)
Greece 0·05
(0·03 to 0·09)
1·22 (0·59 to 2·18)
0·02 (0·02 to 0·02)
39·67 (30·76 to 49·54)
0·01 (–0·02 to 0·03)
0·01 (–0·00 to 0·02)
New infections (in thousands)
People living with HIV (in thousands)
HIV/AIDS deaths (in thousands)
ART coverage per 100 people living with HIV (%)
Age-standardised incidence ARC from 2005 to 2015
Age-standardised prevalence ARC from 2005 to 2015
Age-standardised mortality ARC from 2005 to 2015
(Continued from previous page)
Iceland 0·01
(0·00 to 0·02)
0·18 (0·05 to 0·42)
0·00 (0·00 to 0·00)
50·06 (40·56 to 61·16)
–0·01 (–0·18 to 0·03)
0·01 (–0·01 to 0·03)
–0·04 (–0·05 to –0·04)
Ireland 0·06
(0·01 to 0·14)
2·55 (0·70 to 5·85)
0·01 (0·01 to 0·01)
58·51 (51·76 to 66·14)
–0·03 (–0·15 to –0·00)
–0·00 (–0·02 to 0·01)
–0·00 (–0·01 to 0·01)
Israel 0·17
(0·05 to 0·35)
4·85 (1·39 to 10·45)
0·04 (0·03 to 0·04)
50·92 (44·16 to 58·93)
–0·01 (–0·09 to 0·01)
0·01 (–0·01 to 0·02)
–0·02 (–0·03 to –0·01)
Italy 1·96
(0·76 to 4·19)
137·07 (43·51 to 276·32)
0·61 (0·57 to 0·64)
67·08 (62·08 to 72·04)
–0·05 (–0·07 to –0·03)
–0·01 (–0·02 to –0·00)
–0·03 (–0·03 to –0·02)
Luxembourg 0·01
(0·00 to 0·03)
0·41 (0·12 to 0·96)
0·00 (0·00 to 0·00)
52·04 (43·46 to 61·91)
0·00 (–0·09 to 0·03)
0·01 (–0·01 to 0·02)
–0·05 (–0·05 to –0·04)
Malta 0·01
(0·00 to 0·02)
0·26 (0·08 to 0·58)
0·00 (0·00 to 0·00)
48·30 (38·71 to 59·59)
0·01 (–0·08 to 0·04)
0·02 (–0·00 to 0·04)
–0·03 (–0·03 to –0·02)
Netherlands 0·20
(0·07 to 0·47)
14·56 (4·14 to 32·34)
0·05 (0·05 to 0·05)
69·53 (62·81 to 76·01)
–0·02 (–0·07 to 0·01)
–0·02 (–0·03 to –0·01)
–0·07 (–0·07 to –0·06)
Norway 0·05
(0·02 to 0·11)
2·77 (0·78 to 6·18)
0·01 (0·01 to 0·01)
63·51 (57·61 to 69·83)
–0·02 (–0·09 to –0·00)
–0·01 (–0·02 to 0·00)
–0·08 (–0·09 to –0·07)
Portugal 2·22
(0·53 to 4·91)
115·25 (32·31 to 263·86)
0·53 (0·50 to 0·56)
60·58 (54·02 to 66·88)
–0·04 (–0·13 to –0·01)
–0·01 (–0·02 to 0·00)
–0·07 (–0·08 to –0·07)
Spain 2·35
(0·99 to 4·76)
130·33 (39·66 to 281·12)
0·82 (0·77 to 0·87)
65·54 (56·76 to 73·75)
0·01 (–0·01 to 0·02)
–0·02 (–0·03 to –0·01)
–0·08 (–0·09 to –0·07)
Sweden 0·08
(0·03 to 0·15)
3·69 (1·62 to 6·61)
0·02 (0·02 to 0·02)
76·01 (71·06 to 82·01)
–0·01 (–0·06 to 0·01)
–0·00 (–0·02 to 0·01)
–0·05 (–0·05 to –0·04)
Switzerland 0·20
(0·05 to 0·45)
13·03 (3·77 to 28·24)
0·04 (0·04 to 0·04)
69·48 (64·10 to 75·77)
0·00 (–0·09 to 0·03)
–0·01 (–0·03 to –0·01)
–0·06 (–0·07 to –0·06)
UK 2·06
(1·66 to 2·54)
52·67 (41·67 to 66·15)
0·22 (0·21 to 0·22)
61·21 (58·45 to 64·08)
–0·04 (–0·04 to –0·03)
0·02 (0·02 to 0·03)
–0·03 (–0·04 to –0·03)
Southern Latin America
7·42 (3·55 to 10·30)
85·45 (56·64 to 122·34)
2·23 (2·13 to 2·32)
63·83 (58·62 to 69·84)
0·04 (–0·05 to 0·07)
0·02 (0·00 to 0·03)
–0·01 (–0·02 to –0·01)
Argentina 6·32
(2·58 to 9·20)
62·94 (36·49 to 96·26)
1·60 (1·51 to 1·70)
69·73 (64·04 to 76·37)
0·07 (–0·05 to 0·09)
0·03 (0·00 to 0·04)
–0·01 (–0·02 to –0·01)
Chile 0·71
(0·43 to 1·15)
16·25 (7·33 to 32·90)
0·46 (0·43 to 0·49)
45·88 (33·79 to 57·54)
–0·05 (–0·08 to –0·01)
–0·01 (–0·02 to 0·01)
–0·00 (–0·01 to 0·00)
Uruguay 0·38
(0·20 to 0·64)
6·26 (2·83 to 11·94)
0·16 (0·15 to 0·18)
46·96 (39·24 to 56·35)
–0·01 (–0·05 to 0·03)
0·01 (–0·01 to 0·02)
–0·01 (–0·02 to –0·00)
Eastern Europe, central Europe, and central Asia
78·25 (52·91 to 122·49)
940·86 (617·41 to 1490·53)
28·38 (26·94 to 30·12)
20·07 (16·88 to 24·38)
0·02 (–0·01 to 0·06)
0·03 (0·02 to 0·04)
0·01 (0·00 to 0·01) Eastern Europe 73·10
(48·14 to 117·64)
864·89 (547·01 to 1413·14)
26·09 (24·67 to 27·65)
18·69 (15·34 to 23·40)
0·02 (–0·01 to 0·06)
0·03 (0·02 to 0·05)
0·01 (0·01 to 0·02)
Belarus 1·37
(0·76 to 2·29)
17·50 (8·74 to 29·52)
0·59 (0·41 to 0·96)
35·42 (27·69 to 46·87)
0·01 (–0·03 to 0·05)
0·04 (0·02 to 0·06)
0·02 (–0·00 to 0·05)
Estonia 0·11
(0·06 to 0·19)
1·62 (0·81 to 2·93)
0·03 (0·03 to 0·04)
31·07 (25·55 to 36·79)
–0·02 (–0·04 to 0·00)
0·05 (0·03 to 0·06)
–0·01 (–0·02 to 0·01)
Latvia 0·17
(0·05 to 0·35)
2·93 (1·42 to 5·82)
0·11 (0·10 to 0·12)
16·62 (11·92 to 23·32)
–0·05 (–0·16 to 0·00)
0·00 (–0·03 to 0·04)
0·04 (0·03 to 0·05)
Lithuania 0·08
(0·01 to 0·17)
1·67 (0·83 to 3·17)
0·06 (0·06 to 0·07)
22·13 (16·73 to 29·50)
–0·06 (–0·21 to –0·01)
0·00 (–0·03 to 0·03)
0·01 (–0·01 to 0·02)
Moldova 0·54
(0·31 to 0·92)
7·94 (3·67 to 14·59)
0·18 (0·16 to 0·21)
21·43 (15·09 to 30·21)
–0·01 (–0·03 to 0·01)
0·03 (0·02 to 0·04)
–0·03 (–0·04 to –0·02)
Russia 57·34
(32·75 to 102·27)
607·05 (312·14 to 1107·70)
17·89 (16·58 to 19·33)
13·91 (10·90 to 17·43)
0·05 (0·01 to 0·10)
0·05 (0·03 to 0·06)
0·03 (0·02 to 0·04)
Ukraine 13·49
(9·92 to 18·67)
226·16 (132·70 to 360·43)
7·22 (6·52 to 8·01)
28·19 (21·83 to 36·31)
–0·04 (–0·06 to –0·02)
0·01 (–0·00 to 0·01)
–0·01 (–0·03 to –0·00)
Central Europe 1·19 (0·82 to 1·55)
19·79 (14·35 to 26·53)
0·42 (0·39 to 0·49)
46·47 (41·14 to 52·17)
0·00 (–0·03 to 0·02)
0·02 (0·00 to 0·03)
–0·04 (–0·04 to –0·02)
Albania 0·00
(0·00 to 0·01)
0·07 (0·02 to 0·14)
0·00 (0·00 to 0·00)
46·34 (32·88 to 63·31)
–0·07 (–0·57 to 0·04)
0·00 (–0·04 to 0·04)
–0·00 (–0·04 to 0·04)
New infections (in thousands)
People living with HIV (in thousands)
HIV/AIDS deaths (in thousands)
ART coverage per 100 people living with HIV (%)
Age-standardised incidence ARC from 2005 to 2015
Age-standardised prevalence ARC from 2005 to 2015
Age-standardised mortality ARC from 2005 to 2015
(Continued from previous page)
Bosnia and Herzegovina
0·00 (0·00 to 0·01)
0·10 (0·03 to 0·21)
0·00 (0·00 to 0·01)
48·18 (35·41 to 63·19)
–0·06 (–0·50 to 0·04)
0·00 (–0·03 to 0·03)
–0·00 (–0·04 to 0·06)
Bulgaria 0·14
(0·06 to 0·26)
1·86 (0·83 to 4·00)
0·05 (0·05 to 0·06)
17·02 (12·25 to 22·96)
–0·00 (–0·06 to 0·03)
0·01 (–0·02 to 0·03)
–0·05 (–0·06 to –0·03)
Croatia 0·02
(0·00 to 0·02)
0·34 (0·16 to 0·60)
0·01 (0·01 to 0·01)
53·33 (43·15 to 65·99)
–0·02 (–0·12 to 0·01)
0·01 (–0·01 to 0·03)
0·01 (–0·00 to 0·02)
Czech Republic 0·04 (0·01 to 0·07)
0·75 (0·37 to 1·21)
0·01 (0·01 to 0·02)
53·80 (46·23 to 62·90)
0·01 (–0·10 to 0·05)
0·02 (–0·00 to 0·04)
0·03 (0·01 to 0·04)
Hungary 0·06
(0·04 to 0·08)
1·24 (0·66 to 1·99)
0·04 (0·04 to 0·05)
45·77 (37·00 to 56·61)
–0·02 (–0·05 to 0·00)
–0·02 (–0·03 to –0·00)
–0·08 (–0·09 to –0·06)
Macedonia 0·01
(0·00 to 0·01)
0·09 (0·03 to 0·18)
0·00 (0·00 to 0·00)
40·71 (29·03 to 59·30)
–0·06 (–0·53 to 0·04)
0·03 (–0·02 to 0·07)
0·02 (–0·02 to 0·08)
Montenegro 0·00
(0·00 to 0·01)
0·05 (0·02 to 0·10)
0·00 (0·00 to 0·00)
42·44 (30·59 to 60·43)
–0·04 (–0·53 to 0·07)
0·02 (–0·02 to 0·06)
0·01 (–0·03 to 0·07)
Poland 0·41
(0·13 to 0·67)
7·71 (3·88 to 12·56)
0·14 (0·13 to 0·15)
56·60 (48·73 to 67·12)
–0·00 (–0·11 to 0·03)
0·01 (–0·01 to 0·03)
–0·02 (–0·03 to –0·01)
Romania 0·45
(0·15 to 0·69)
6·33 (3·17 to 10·39)
0·09 (0·08 to 0·10)
43·39 (34·99 to 54·03)
0·03 (–0·07 to 0·06)
0·04 (0·01 to 0·06)
–0·06 (–0·07 to –0·05)
Serbia 0·04
(0·02 to 0·08)
0·87 (0·38 to 2·21)
0·05 (0·03 to 0·12)
26·76 (20·80 to 32·60)
–0·08 (–0·11 to –0·05)
–0·00 (–0·02 to 0·01)
0·08 (0·03 to 0·13)
Slovakia 0·02
(0·01 to 0·03)
0·24 (0·11 to 0·42)
0·01 (0·00 to 0·01)
46·16 (36·95 to 55·76)
0·02 (0·00 to 0·04)
0·04 (0·01 to 0·06)
0·00 (–0·03 to 0·02)
Slovenia 0·01
(0·00 to 0·01)
0·14 (0·06 to 0·27)
0·00 (0·00 to 0·00)
58·71 (45·13 to 71·99)
0·02 (–0·01 to 0·04)
–0·00 (–0·02 to 0·02)
–0·07 (–0·08 to –0·06)
Central Asia 3·96
(2·64 to 5·58)
56·19 (39·49 to 79·69)
1·87 (1·52 to 2·57)
30·50 (25·59 to 36·68)
–0·01 (–0·05 to 0·03)
0·01 (–0·01 to 0·02)
–0·03 (–0·05 to –0·02)
Armenia 0·07
(0·03 to 0·13)
0·57 (0·29 to 1·04)
0·02 (0·01 to 0·02)
21·59 (17·29 to 27·60)
0·07 (–0·03 to 0·26)
0·07 (0·02 to 0·12)
0·05 (0·00 to 0·09)
Azerbaijan 0·36
(0·17 to 0·58)
4·06 (1·89 to 7·45)
0·11 (0·07 to 0·21)
32·83 (23·57 to 47·48)
0·04 (–0·07 to 0·09)
0·02 (–0·01 to 0·05)
–0·06 (–0·09 to –0·02)
Georgia 0·15
(0·08 to 0·25)
1·70 (0·98 to 2·56)
0·03 (0·03 to 0·04)
38·75 (33·41 to 44·83)
0·04 (–0·01 to 0·09)
0·13 (0·10 to 0·15)
0·12 (0·09 to 0·15)
Kazakhstan 1·63
(0·88 to 2·64)
17·70 (8·32 to 31·95)
0·31 (0·27 to 0·36)
24·79 (19·36 to 32·88)
0·09 (0·06 to 0·14)
0·04 (0·02 to 0·05)
–0·05 (–0·07 to –0·04)
Kyrgyzstan 0·32
(0·16 to 0·62)
6·62 (3·03 to 13·08)
0·30 (0·21 to 0·46)
32·24 (26·28 to 38·78)
–0·07 (–0·14 to –0·01)
0·03 (0·01 to 0·05)
0·02 (0·01 to 0·04)
Mongolia 0·01
(0·00 to 0·01)
0·08 (0·03 to 0·17)
0·00 (0·00 to 0·01)
26·46 (17·72 to 41·13)
0·03 (–0·12 to 0·18)
–0·01 (–0·06 to 0·02)
–0·06 (–0·09 to –0·03)
Tajikistan 0·32
(0·14 to 0·61)
4·64 (2·20 to 8·86)
0·18 (0·13 to 0·30)
27·27 (20·60 to 36·20)
–0·03 (–0·12 to 0·06)
–0·01 (–0·03 to 0·02)
–0·05 (–0·08 to –0·02)
Turkmenistan 0·79
(0·10 to 1·96)
9·22 (3·17 to 19·29)
0·35 (0·22 to 0·56)
21·76 (13·98 to 36·05)
0·01 (–0·18 to 0·16)
0·02 (–0·05 to 0·07)
–0·01 (–0·05 to 0·04)
Uzbekistan 0·31
(0·10 to 0·68)
11·59 (5·53 to 26·29)
0·57 (0·35 to 1·16)
40·92 (29·74 to 52·77)
–0·17 (–0·29 to –0·08)
–0·05 (–0·06 to –0·03)
–0·06 (–0·09 to –0·02)
Latin America and Caribbean
85·47 (77·62 to 94·22)
1322·07 (1194·38 to 1474·60)
46·81 (43·27 to 50·98)
45·10 (43·68 to 46·49)
–0·00 (–0·01 to 0·00)
0·01 (0·00 to 0·01)
–0·02 (–0·03 to –0·02)
Central Latin America 29·38 (24·91 to 34·23)
394·06 (328·88 to 465·79)
12·31 (12·01 to 12·71)
40·01 (38·29 to 41·84)
0·01 (0·00 to 0·03)
0·02 (0·02 to 0·03)
–0·02 (–0·02 to –0·02)
Colombia 6·15
(3·42 to 10·00)
73·95 (36·96 to 131·07)
2·42 (2·30 to 2·56)
29·75 (24·34 to 36·98)
0·03 (0·00 to 0·07)
0·02 (0·01 to 0·04)
–0·02 (–0·03 to –0·02)
Costa Rica 0·35
(0·22 to 0·50)
6·66 (3·38 to 10·89)
0·15 (0·14 to 0·16)
50·08 (43·35 to 56·40)
–0·03 (–0·05 to –0·02)
0·01 (0·01 to 0·02)
–0·02 (–0·03 to –0·01)
El Salvador 0·80
(0·47 to 1·21)
16·11 (8·09 to 27·60)
0·55 (0·42 to 0·77)
46·22 (40·88 to 50·96)
–0·05 (–0·07 to –0·03)
0·01 (–0·00 to 0·02)
0·02 (–0·01 to 0·04)
Guatemala 1·67
(0·84 to 2·96)
27·74 (12·99 to 49·27)
0·68 (0·65 to 0·71)
42·04 (36·62 to 47·33)
–0·03 (–0·10 to 0·03)
–0·00 (–0·02 to 0·02)
–0·06 (–0·06 to –0·05)
New infections (in thousands)
People living with HIV (in thousands)
HIV/AIDS deaths (in thousands)
ART coverage per 100 people living with HIV (%)
Age-standardised incidence ARC from 2005 to 2015
Age-standardised prevalence ARC from 2005 to 2015
Age-standardised mortality ARC from 2005 to 2015
(Continued from previous page)
Honduras 1·48
(0·88 to 2·29)
19·82 (12·09 to 30·07)
0·59 (0·50 to 0·73)
40·41 (35·61 to 45·45)
0·01 (–0·04 to 0·05)
0·02 (–0·01 to 0·04)
–0·03 (–0·06 to 0·00)
Mexico 12·47
(11·23 to 13·83)
169·52 (147·48 to 194·76)
5·17 (5·11 to 5·24)
45·67 (43·88 to 47·67)
0·01 (0·00 to 0·02)
0·03 (0·02 to 0·03)
–0·02 (–0·03 to –0·02)
Nicaragua 0·97
(0·49 to 1·68)
7·93 (4·03 to 13·74)
0·19 (0·16 to 0·25)
22·22 (19·37 to 25·34)
0·09 (0·04 to 0·14)
0·09 (0·06 to 0·11)
0·02 (–0·00 to 0·05)
Panama 1·80
(0·96 to 3·16)
18·92 (9·91 to 31·50)
0·51 (0·38 to 0·75)
38·52 (33·38 to 43·53)
0·12 (0·05 to 0·25)
0·02 (0·01 to 0·04)
–0·02 (–0·05 to 0·01)
Venezuela 3·68
(1·64 to 6·45)
53·41 (27·48 to 95·77)
2·04 (1·94 to 2·15)
33·10 (28·61 to 38·45)
–0·01 (–0·10 to 0·03)
0·02 (–0·00 to 0·04)
0·01 (0·00 to 0·02)
Andean Latin America 3·83 (2·68 to 5·33)
49·31 (32·11 to 71·86)
1·81 (1·54 to 2·20)
34·59 (31·27 to 38·93)
0·01 (–0·01 to 0·04)
0·02 (0·01 to 0·04)
–0·01 (–0·03 to 0·00)
Bolivia 0·19
(0·10 to 0·31)
2·23 (1·01 to 4·17)
0·10 (0·07 to 0·14)
18·69 (15·60 to 21·98)
0·02 (–0·02 to 0·07)
0·02 (–0·00 to 0·04)
–0·01 (–0·03 to 0·02)
Ecuador 2·02
(1·14 to 3·19)
23·39 (12·33 to 39·59)
0·79 (0·64 to 1·09)
34·40 (30·49 to 38·80)
0·02 (–0·01 to 0·06)
0·04 (0·01 to 0·06)
0·01 (–0·02 to 0·03)
Peru 1·62
(0·96 to 2·50)
23·70 (12·56 to 41·07)
0·92 (0·75 to 1·22)
35·94 (30·57 to 42·07)
0·00 (–0·03 to 0·03)
0·01 (–0·00 to 0·02)
–0·03 (–0·04 to –0·02)
Caribbean 17·29
(12·72 to 23·36)
307·45 (272·69 to 342·05)
11·28 (9·73 to 12·89)
46·11 (42·49 to 49·62)
–0·02 (–0·04 to 0·01)
–0·01 (–0·02 to 0·00)
–0·07 (–0·08 to –0·06)
Antigua and Barbuda
0·02 (0·01 to 0·04)
0·34 (0·14 to 0·71)
0·01 (0·01 to 0·01)
39·68 (29·72 to 49·29)
0·01 (–0·07 to 0·14)
0·00 (–0·02 to 0·05)
–0·03 (–0·04 to –0·03)
The Bahamas 0·11
(0·07 to 0·18)
3·33 (1·75 to 5·39)
0·11 (0·07 to 0·17)
51·08 (42·61 to 61·04)
–0·07 (–0·10 to –0·03)
–0·01 (–0·02 to 0·01)
–0·05 (–0·07 to –0·03)
Barbados 0·06
(0·03 to 0·10)
1·07 (0·50 to 1·86)
0·03 (0·02 to 0·03)
46·43 (38·95 to 55·50)
0·02 (–0·02 to 0·05)
0·00 (–0·01 to 0·01)
–0·04 (–0·05 to –0·03)
Belize 0·19
(0·12 to 0·28)
3·03 (1·58 to 5·21)
0·10 (0·06 to 0·17)
58·12 (53·15 to 63·65)
0·02 (–0·02 to 0·05)
0·00 (–0·01 to 0·01)
0·00 (–0·04 to 0·04)
Bermuda 0·02
(0·01 to 0·04)
0·36 (0·15 to 0·77)
0·01 (0·01 to 0·01)
40·56 (30·34 to 50·33)
0·01 (–0·08 to 0·14)
–0·00 (–0·02 to 0·04)
–0·03 (–0·04 to –0·02)
Cuba 1·14
(0·70 to 1·78)
18·71 (9·53 to 30·35)
0·32 (0·31 to 0·34)
62·31 (56·48 to 68·60)
–0·00 (–0·03 to 0·02)
0·09 (0·06 to 0·11)
0·07 (0·06 to 0·08)
Dominica 0·01
(0·00 to 0·03)
0·20 (0·08 to 0·41)
0·01 (0·00 to 0·01)
37·59 (28·28 to 46·01)
0·01 (–0·08 to 0·16)
0·01 (–0·01 to 0·06)
–0·01 (–0·04 to 0·04)
Dominican Republic 2·82 (2·03 to 3·84)
55·93 (48·99 to 62·58)
1·99 (1·34 to 2·55)
39·80 (35·00 to 45·75)
0·01 (–0·05 to 0·12)
–0·04 (–0·05 to –0·03)
–0·11 (–0·15 to –0·08)
Grenada 0·02
(0·01 to 0·05)
0·33 (0·14 to 0·70)
0·01 (0·01 to 0·02)
33·58 (25·44 to 41·30)
0·00 (–0·08 to 0·13)
0·01 (–0·01 to 0·06)
–0·01 (–0·04 to 0·04)
Guyana 1·14
(0·65 to 1·78)
18·89 (8·80 to 32·29)
0·47 (0·30 to 0·71)
62·25 (54·32 to 69·67)
–0·01 (–0·03 to 0·01)
0·02 (0·00 to 0·05)
0·02 (–0·01 to 0·05)
Haiti 9·49
(5·37 to 15·10)
157·01 (132·94 to 183·68)
6·72 (5·38 to 8·10)
44·09 (38·75 to 49·87)
–0·04 (–0·08 to 0·01)
–0·02 (–0·03 to –0·00)
–0·09 (–0·10 to –0·07)
Jamaica 0·66
(0·41 to 0·97)
11·08 (5·47 to 17·67)
0·42 (0·30 to 0·63)
39·55 (34·00 to 46·05)
–0·00 (–0·03 to 0·02)
–0·00 (–0·02 to 0·01)
–0·04 (–0·06 to –0·01)
Puerto Rico 0·44
(0·17 to 1·10)
12·01 (4·45 to 28·56)
0·28 (0·26 to 0·30)
50·14 (35·87 to 63·33)
–0·01 (–0·10 to 0·14)
–0·03 (–0·05 to 0·01)
–0·07 (–0·08 to –0·06)
Saint Lucia 0·02
(0·01 to 0·05)
0·39 (0·16 to 0·82)
0·01 (0·01 to 0·01)
37·89 (28·04 to 46·64)
0·01 (–0·08 to 0·15)
0·01 (–0·01 to 0·05)
–0·04 (–0·05 to –0·03)
Saint Vincent and the Grenadines
0·05 (0·02 to 0·11)
0·82 (0·34 to 1·70)
0·02 (0·02 to 0·02)
36·75 (27·32 to 45·46)
0·01 (–0·08 to 0·15)
0·01 (–0·01 to 0·06)
–0·03 (–0·04 to –0·02)
Suriname 0·19
(0·11 to 0·32)
3·81 (1·79 to 6·76)
0·14 (0·10 to 0·21)
44·05 (35·93 to 50·95)
–0·01 (–0·04 to 0·02)
–0·01 (–0·02 to 0·00)
0·00 (–0·03 to 0·03)
Trinidad and Tobago
0·31 (0·19 to 0·50)
8·20 (3·80 to 15·61)
0·22 (0·20 to 0·23)
41·38 (33·87 to 48·39)
–0·05 (–0·07 to –0·03)
–0·01 (–0·02 to –0·00)
–0·05 (–0·05 to –0·04)
US Virgin Islands 0·01 (0·01 to 0·03)
0·27 (0·11 to 0·55)
0·01 (0·01 to 0·02)
43·23 (31·95 to 53·07)
0·01 (–0·08 to 0·16)
0·01 (–0·01 to 0·06)
–0·01 (–0·05 to 0·04)
New infections (in thousands)
People living with HIV (in thousands)
HIV/AIDS deaths (in thousands)
ART coverage per 100 people living with HIV (%)
Age-standardised incidence ARC from 2005 to 2015
Age-standardised prevalence ARC from 2005 to 2015
Age-standardised mortality ARC from 2005 to 2015
(Continued from previous page)
Tropical Latin America 34·97 (31·13 to 38·94)
571·24 (468·17 to 701·82)
21·41 (18·29 to 25·43)
48·93 (47·39 to 50·56)
–0·01 (–0·01 to –0·00)
0·01 (0·00 to 0·01)
0·02 (0·01 to 0·03)
Brazil 33·76
(30·24 to 37·52)
558·84 (454·38 to 687·40)
21·05 (17·92 to 25·13)
49·37 (47·89 to 50·94)
–0·01 (–0·01 to –0·00)
0·01 (0·00 to 0·01)
0·02 (0·01 to 0·02)
Paraguay 1·21
(0·48 to 2·42)
12·40 (5·81 to 22·65)
0·36 (0·26 to 0·46)
29·48 (24·14 to 36·67)
0·02 (–0·04 to 0·06)
0·06 (0·03 to 0·08)
0·05 (0·01 to 0·07)
Southeast Asia, east Asia, and Oceania
174·31 (121·70 to 266·48)
2335·91 (1716·35 to 3511·41)
101·62 (77·06 to 158·16)
25·88 (20·76 to 32·27)
0·00 (–0·03 to 0·03)
0·04 (0·01 to 0·06)
0·04 (–0·01 to 0·07)
East Asia 56·50
(41·02 to 77·70)
796·14 (591·71 to 1043·33)
42·74 (38·28 to 47·27)
17·90 (15·89 to 20·29)
–0·01 (–0·04 to 0·00)
0·04 (0·03 to 0·05)
0·08 (0·07 to 0·09)
China 55·20
(39·82 to 75·98)
779·48 (573·77 to 1024·76)
41·82 (37·43 to 46·26)
17·90 (15·84 to 20·33)
–0·01 (–0·04 to 0·00)
0·04 (0·03 to 0·05)
0·08 (0·07 to 0·09)
North Korea 0·91
(0·10 to 3·08)
11·16 (2·27 to 39·91)
0·62 (0·12 to 2·43)
17·20 (6·82 to 33·39)
0·01 (–0·14 to 0·11)
0·05 (–0·02 to 0·13)
0·08 (–0·01 to 0·17)
Taiwan 0·39
(0·12 to 0·84)
5·51 (2·23 to 11·10)
0·29 (0·21 to 0·38)
17·08 (11·69 to 23·37)
–0·02 (–0·11 to 0·03)
0·04 (0·01 to 0·07)
0·09 (0·06 to 0·11)
Southeast Asia 116·19 (66·38 to 204·40)
1510·91 (925·80 to 2625·43)
57·90 (34·09 to 115·40)
29·77 (21·90 to 38·69)
0·00 (–0·04 to 0·05)
0·03 (–0·01 to 0·06)
0·01 (–0·05 to 0·06)
Cambodia 7·83
(3·55 to 14·42)
82·97 (32·84 to 153·51)
2·60 (1·80 to 3·64)
29·52 (22·70 to 36·25)
0·04 (0·00 to 0·07)
0·01 (–0·00 to 0·03)
0·01 (–0·02 to 0·03)
Indonesia 43·39
(8·51 to 123·93)
440·51 (90·19 to 1391·78)
18·56 (3·60 to 68·98)
11·67 (8·08 to 15·97)
0·02 (–0·04 to 0·09)
0·10 (0·06 to 0·16)
0·17 (0·11 to 0·23)
Laos 0·51
(0·12 to 1·58)
6·93 (1·68 to 23·47)
0·18 (0·04 to 0·69)
32·94 (23·92 to 42·06)
–0·04 (–0·09 to 0·05)
0·06 (0·02 to 0·11)
0·08 (0·02 to 0·15)
Malaysia 2·04
(1·56 to 2·81)
39·53 (22·31 to 70·73)
2·29 (1·83 to 3·35)
29·22 (22·89 to 36·80)
–0·07 (–0·08 to –0·05)
–0·03 (–0·04 to –0·02)
–0·01 (–0·03 to 0·01)
Maldives 0·00
(0·00 to 0·00)
0·02 (0·01 to 0·03)
0·00 (0·00 to 0·00)
10·72 (7·60 to 15·10)
–0·01 (–0·03 to 0·01)
–0·02 (–0·04 to 0·00)
–0·03 (–0·05 to –0·02)
Mauritius 0·12
(0·08 to 0·19)
1·57 (0·94 to 2·56)
0·08 (0·07 to 0·09)
19·51 (15·45 to 23·79)
–0·00 (–0·03 to 0·02)
0·04 (0·03 to 0·06)
0·12 (0·11 to 0·14)
Myanmar 6·75
(1·35 to 18·92)
177·74 (39·79 to 645·94)
8·62 (1·68 to 36·64)
40·35 (30·88 to 51·89)
–0·07 (–0·13 to 0·00)
–0·01 (–0·07 to 0·05)
–0·04 (–0·12 to 0·02)
Philippines 33·31
(12·50 to 82·46)
273·65 (127·88 to 476·60)
3·55 (3·31 to 3·82)
32·57 (24·42 to 42·40)
0·09 (0·03 to 0·19)
0·09 (0·07 to 0·12)
–0·05 (–0·06 to –0·04)
Sri Lanka 0·21
(0·10 to 0·38)
2·21 (1·00 to 3·95)
0·05 (0·05 to 0·06)
25·91 (23·17 to 28·86)
0·07 (0·03 to 0·11)
0·03 (0·01 to 0·05)
–0·02 (–0·03 to –0·01)
Seychelles 0·01
(0·00 to 0·03)
0·14 (0·04 to 0·30)
0·01 (0·00 to 0·01)
29·89 (16·29 to 44·37)
–0·02 (–0·40 to 0·15)
0·02 (–0·04 to 0·10)
0·01 (–0·03 to 0·05)
Thailand 10·06
(2·85 to 21·66)
288·25 (139·33 to 514·46)
14·74 (10·34 to 21·49)
40·71 (34·54 to 51·96)
–0·07 (–0·20 to 0·01)
–0·01 (–0·03 to 0·00)
–0·01 (–0·03 to 0·01)
Timor-Leste 0·10
(0·00 to 0·44)
1·46 (0·03 to 6·86)
0·07 (0·00 to 0·37)
25·29 (9·12 to 49·66)
0·01 (–0·40 to 0·27)
0·05 (–0·07 to 0·20)
0·03 (–0·08 to 0·17)
Vietnam 11·73
(2·48 to 33·85)
193·97 (38·99 to 718·95)
7·05 (1·39 to 29·18)
33·48 (23·62 to 44·85)
–0·03 (–0·09 to 0·05)
0·03 (–0·01 to 0·08)
0·02 (–0·03 to 0·08)
Oceania 1·62
(1·13 to 2·28)
28·85 (24·68 to 33·04)
0·99 (0·78 to 1·27)
52·65 (46·71 to 59·02)
–0·05 (–0·08 to –0·01)
0·02 (–0·00 to 0·04)
–0·04 (–0·06 to –0·02)
American Samoa 0·00 (0·00 to 0·00)
0·02 (0·01 to 0·04)
0·00 (0·00 to 0·00)
28·49 (22·61 to 36·97)
0·04 (–0·06 to 0·09)
0·05 (0·01 to 0·08)
0·00 (–0·02 to 0·03)
Federated States of Micronesia
0·01 (0·00 to 0·03)
0·11 (0·02 to 0·42)
0·00 (0·00 to 0·02)
24·74 (14·47 to 45·45)
0·07 (–0·10 to 0·20)
0·07 (–0·03 to 0·18)
0·02 (–0·08 to 0·13)
Fiji 0·07
(0·04 to 0·13)
0·68 (0·32 to 1·24)
0·02 (0·02 to 0·03)
24·73 (21·67 to 28·32)
0·05 (0·03 to 0·07)
0·05 (0·04 to 0·06)
0·04 (0·02 to 0·06)
Guam 0·01
(0·00 to 0·03)
0·14 (0·06 to 0·28)
0·00 (0·00 to 0·01)
30·04 (22·88 to 40·09)
0·04 (–0·05 to 0·09)
0·05 (0·01 to 0·08)
–0·00 (–0·03 to 0·03)
Kiribati 0·00
(0·00 to 0·00)
0·02 (0·01 to 0·04)
0·00 (0·00 to 0·00)
29·00 (21·80 to 38·81)
0·03 (–0·06 to 0·08)
0·03 (–0·01 to 0·06)
–0·02 (–0·04 to 0·01)
New infections (in thousands)
People living with HIV (in thousands)
HIV/AIDS deaths (in thousands)
ART coverage per 100 people living with HIV (%)
Age-standardised incidence ARC from 2005 to 2015
Age-standardised prevalence ARC from 2005 to 2015
Age-standardised mortality ARC from 2005 to 2015
(Continued from previous page)
Marshall Islands 0·01 (0·00 to 0·02)
0·09 (0·01 to 0·39)
0·00 (0·00 to 0·02)
25·91 (15·20 to 47·44)
0·07 (–0·10 to 0·19)
0·07 (–0·05 to 0·19)
0·02 (–0·08 to 0·14)
Northern Mariana Islands
0·01 (0·00 to 0·01)
0·05 (0·02 to 0·10)
0·00 (0·00 to 0·00)
24·00 (19·14 to 32·23)
0·04 (–0·06 to 0·08)
0·05 (0·01 to 0·08)
0·02 (–0·01 to 0·04)
Papua New Guinea 1·31 (0·86 to 1·94)
24·57 (21·27 to 27·37)
0·84 (0·66 to 1·04)
54·46 (48·01 to 61·46)
–0·06 (–0·10 to –0·02)
0·02 (–0·01 to 0·03)
–0·05 (–0·07 to –0·02)
Samoa 0·02
(0·00 to 0·05)
0·21 (0·03 to 0·92)
0·01 (0·00 to 0·04)
27·11 (16·02 to 47·08)
0·07 (–0·10 to 0·20)
0·07 (–0·04 to 0·18)
0·02 (–0·07 to 0·13)
Solomon Islands 0·05 (0·01 to 0·16)
0·64 (0·08 to 2·87)
0·02 (0·00 to 0·15)
25·34 (15·33 to 44·47)
0·08 (–0·10 to 0·20)
0·07 (–0·04 to 0·18)
0·02 (–0·08 to 0·13)
Tonga 0·01
(0·00 to 0·02)
0·06 (0·02 to 0·11)
0·00 (0·00 to 0·00)
22·65 (18·24 to 30·85)
0·08 (–0·02 to 0·14)
0·10 (0·05 to 0·14)
0·06 (0·02 to 0·09)
Vanuatu 0·02
(0·00 to 0·08)
0·31 (0·04 to 1·28)
0·01 (0·00 to 0·07)
25·63 (15·26 to 45·39)
0·07 (–0·09 to 0·20)
0·07 (–0·05 to 0·19)
0·02 (–0·08 to 0·14)
North Africa and Middle East
12·39 (8·53 to 17·51)
137·94 (113·08 to 172·80)
7·54 (6·25 to 9·30)
19·07 (15·88 to 22·65)
–0·02 (–0·05 to 0·01)
0·02 (–0·01 to 0·03)
0·01 (–0·01 to 0·03)
Afghanistan 0·70
(0·14 to 2·04)
4·50 (0·92 to 13·98)
0·21 (0·04 to 0·73)
4·17 (3·08 to 5·86)
0·09 (0·01 to 0·17)
0·06 (–0·05 to 0·14)
0·02 (–0·11 to 0·12)
Algeria 0·31
(0·01 to 0·95)
6·47 (2·15 to 11·52)
0·23 (0·12 to 0·38)
61·55 (54·76 to 68·03)
–0·13 (–0·48 to 0·04)
0·04 (–0·02 to 0·06)
0·01 (–0·04 to 0·05)
Bahrain 0·06
(0·01 to 0·12)
0·53 (0·23 to 1·02)
0·02 (0·01 to 0·03)
17·69 (13·63 to 23·05)
0·04 (–0·08 to 0·11)
0·03 (–0·01 to 0·07)
–0·01 (–0·04 to 0·02)
Egypt 0·95
(0·48 to 1·65)
6·80 (3·37 to 11·62)
0·21 (0·17 to 0·26)
17·68 (15·09 to 20·70)
0·09 (0·06 to 0·13)
0·09 (0·07 to 0·11)
0·03 (0·02 to 0·05)
Iran 1·13
(0·62 to 2·06)
11·49 (5·78 to 21·26)
0·55 (0·43 to 0·76)
15·31 (13·65 to 17·17)
0·03 (–0·02 to 0·07)
0·03 (0·01 to 0·05)
0·04 (0·01 to 0·08)
Iraq 0·51
(0·13 to 1·05)
3·63 (1·66 to 6·87)
0·11 (0·08 to 0·15)
16·20 (12·70 to 21·54)
0·07 (–0·07 to 0·14)
0·09 (0·04 to 0·13)
0·06 (0·03 to 0·10)
Jordan 0·03
(0·01 to 0·06)
0·28 (0·12 to 0·56)
0·01 (0·01 to 0·02)
20·24 (15·73 to 26·00)
0·02 (–0·12 to 0·09)
0·02 (–0·01 to 0·06)
–0·00 (–0·03 to 0·03)
Kuwait 0·01
(0·00 to 0·03)
0·14 (0·06 to 0·28)
0·01 (0·01 to 0·01)
19·37 (15·23 to 25·32)
0·03 (–0·11 to 0·09)
0·01 (–0·03 to 0·04)
–0·10 (–0·11 to –0·08)
Lebanon 0·13
(0·02 to 0·38)
1·94 (0·41 to 7·96)
0·09 (0·02 to 0·45)
35·17 (22·65 to 62·67)
0·02 (–0·04 to 0·09)
0·01 (–0·06 to 0·08)
0·01 (–0·07 to 0·06)
Libya 0·23
(0·01 to 0·94)
2·43 (0·15 to 10·48)
0·11 (0·00 to 0·55)
19·73 (13·40 to 28·26)
0·04 (–0·14 to 0·16)
0·05 (–0·06 to 0·16)
0·02 (–0·09 to 0·13)
Morocco 0·67
(0·39 to 1·06)
8·62 (4·20 to 15·19)
0·36 (0·27 to 0·47)
24·58 (22·74 to 26·56)
–0·01 (–0·03 to 0·02)
0·04 (0·02 to 0·05)
0·08 (0·04 to 0·11)
Oman 0·14
(0·09 to 0·19)
1·83 (0·97 to 2·95)
0·07 (0·05 to 0·09)
33·16 (27·89 to 39·27)
–0·02 (–0·05 to 0·01)
0·01 (–0·01 to 0·02)
0·04 (–0·01 to 0·07)
Palestine 0·06
(0·02 to 0·12)
0·45 (0·21 to 0·90)
0·02 (0·01 to 0·02)
17·23 (13·38 to 22·07)
0·03 (–0·08 to 0·10)
0·06 (0·02 to 0·10)
0·04 (0·01 to 0·08)
Qatar 0·01
(0·00 to 0·03)
0·14 (0·06 to 0·27)
0·01 (0·00 to 0·01)
17·24 (13·30 to 22·43)
0·02 (–0·11 to 0·08)
–0·03 (–0·06 to 0·00)
–0·07 (–0·09 to –0·03)
Saudi Arabia 1·06
(0·50 to 2·04)
11·58 (5·82 to 25·18)
0·49 (0·25 to 1·34)
23·37 (19·48 to 28·20)
0·02 (–0·05 to 0·08)
0·03 (–0·03 to 0·07)
0·01 (–0·06 to 0·05)
Sudan 4·31
(1·25 to 8·66)
55·38 (41·64 to 70·69)
4·32 (3·20 to 5·31)
10·02 (7·44 to 13·08)
–0·09 (–0·20 to –0·02)
–0·01 (–0·05 to 0·02)
0·01 (–0·02 to 0·04)
Syria 0·04
(0·01 to 0·07)
0·66 (0·15 to 1·51)
0·03 (0·01 to 0·05)
18·22 (15·12 to 22·01)
0·10 (–0·02 to 0·14)
0·11 (0·01 to 0·17)
0·06 (–0·02 to 0·11)
Tunisia 0·28
(0·13 to 0·53)
2·62 (1·16 to 4·69)
0·09 (0·07 to 0·12)
23·64 (20·75 to 27·28)
0·05 (0·00 to 0·09)
0·07 (0·05 to 0·09)
0·10 (0·07 to 0·13)
Turkey 0·72
(0·28 to 1·28)
8·07 (3·64 to 13·75)
0·19 (0·14 to 0·24)
32·60 (26·92 to 39·90)
0·01 (–0·06 to 0·05)
0·08 (0·04 to 0·10)
0·02 (–0·01 to 0·05)
United Arab Emirates
0·54 (0·03 to 2·02)
5·69 (0·34 to 25·28)
0·27 (0·01 to 1·35)
16·98 (12·17 to 23·71)
0·04 (–0·15 to 0·16)
0·05 (–0·06 to 0·16)
0·02 (–0·09 to 0·13)
Yemen 0·51
(0·10 to 1·46)
4·52 (1·02 to 14·33)
0·16 (0·03 to 0·60)
35·75 (28·14 to 45·07)
0·04 (–0·04 to 0·12)
0·04 (–0·05 to 0·12)
–0·02 (–0·15 to 0·09)