Academic year
2018-2019
Faculty of the Behavioural, Management and Social sciences
M.Sc. thesis
Reducing the duration and variance of external repair lead times
Graduation committee members
First supervisor: Dr. ir. Petra Hoffmann Second supervisor: Dr. ir. Fredo Schotanus Daily supervisor: Klaas Stek, M.Sc.
Company supervisors
First supervisor: Company supervisor A Second supervisor: Company supervisor B De Nederlandse Spoorwegen
Author
Coen van Ommeren
Document: Master thesis Title:
Reducing the duration and variance of external repair lead times Author:
Coen van Ommeren Email address author:
Coen.vanommeren@gmail.com University:
University of Twente Faculty:
Faculty of Behavioural, Management and Social Sciences Programme:
Industrial Engineering and Management Specialization:
Production and Logistic Management Graduation date:
September 2019
University supervisors: Dr. ir. Petra Hoffmann Dr. ir. Fredo Schotanus Klaas Stek, M.Sc.
Glossary
Bounded rationality According this theory, the rationality of decision making is limited by the information the decision maker has due to the uncertainty of future contingencies. Page
10,11,12.1
Corrective maintenance unplanned maintenance as a result of unexpected failures. Page 8, 9, 13, 14.2
Ex works The buyer is responsible for the transport to and from the supplier. This places minimum responsibility on the supplier. Page 49.3
Facultative part A sub component which could be possibly the reason of repair. Page 13, 41, 45, 46, 47, 53.
Forecast error A measurement for the accuracy of the forecast. Page 44.
Incoterms Set of rules which define the responsibilities of the suppliers and buyers for the delivery of components by contracts. Page 27, 49, 50, 52, 54.
Logistic critical An article is said to be logistical critical if the system may not function without this article being built in. Page 22.
Obsolescence “the loss of, or in process of losing, the last known supply or availability of an item or component”. Page 41, 46, 47, 54.4
Opportunism Acting only according one’s own goals, regardless of what is morally desired. Page 10, 12, 59.5
Preventive maintenance Scheduled maintenance to prevent corrective maintenance. Page 8, 22.6
1 See Cox (2002), p.13
2 See Andrzejczak, Mlynczak & Selech (2018), p.1 3 See Van Wezel (2017-2018), p.6
4 See Meyer, Pretorius & Pretorius (2003),p.122 5 See Luo & Meyer (2016), p.528
Resource Based View In line with this theory four criteria are most relevant for a company’s resources to distinguish for sustainable competitive advantage in a business environment: Value, rareness, substitutability and imitability. Page 11.7
Saturation of salience This principle supports the idea of obtaining the most salient items rather than obtaining all possible items including the very rare with less impact. Page 26, 27, 29, 32.8 Strategic supply risk The risk of not being treated as a preferred customer. Page
System dynamics “technique used for modelling and simulating dynamically complex issues and analysing their resulting non-linear behaviours over time in order to develop and test effectiveness of complex systems”. Page 56. 9
Transaction Costs Economics In line with this theory, prices do typically not reflect all the various aspects which are relevant for making the make-or-buy decision. Page 10.10
Turn Around Time The Time it takes to fulfil a request. Page 48, 49, 52, 54.
Upstream the supply chain The supply network of suppliers and sub suppliers. Page 7, 9, 14, 44, 46, 53.
Returned Material Authorization The process of providing the supplier information regarding the reason of disassembling before sending the item. Depending on the capacity, subcomponents and expertise available, the supplier could communicate its preference for a specific production site the repair must be send to. Page 45, 46, 47, 52, 53.
7 See Barney (1991), p.99
8 See Weller, Vickers, Bernard, Blackburn, Borgatti, Gravlee & Johnson (2018), p.1 9 See Pruyt & Hamarat (2010), p.3
List of acronyms
CBM Condition Based Monitoring. Page 49.
ERP Enterprise Resource Planning. Page 8, 19, 35, 38, 48, 49, 50, 51, 54, 56. IP Intellectual Property. Page 52.
KPI Key Performance Indicator. Page 41, 48, 49, 50, 54. MRO Maintenance Repair and Overhaul. Page 3, 49.
Location X Central stock and repair shop Company X. Page 19, 20, 35, 37, 38, 49. Company X The Dutch segment X group.
OEM Original Equipment Manufacturer. Page 51. O&S Operation and Service. Page 1, 3.
RBV Resource Based View. Page 10, 11.
RMA Returned Material Authorization. Page 45, 46, 47, 53, 54.
SCO Supply Chain Operation. Page 1, 2, 4, 5, 6, 10, 20, 23, 31, 34, 35, 39, 41, 44, 48, 49, 51, 52, 53.
SQA Supplier Quality Assurance. Page 40. SD System Dynamics. Page 56.
Management samenvatting
Deze Master thesis Het reduceren van de variatie en duur van levertijden van de reparaties welke worden uitbesteed, beschrijft in eerste instantie het onderzoek naar de mogelijkheden om de variatie en duur van de huidige levertijden van uitbestede reparaties te reduceren voor Afdeling X.
This sentence has been removed fort his public version. De directe beschikbaarheid van gebruiksklare Xonderdelen zijn van essentieel belang voor Company X Onderhoud en Service om haar onderhoud effectief uit te voeren. Company X Operatie had over de afgelopen vier jaar gemiddeld een voorraad nodig van X euro om deze beschikbaarheid te garanderen. De variatie in de levertijden van de reparatie van deze Xonderdelen heeft een directe impact op de veiligheidsvoorraden welke benodigd zijn om de gewenste beschikbaarheid van Xonderdelen te garanderen. Het reduceren van de variatie en duur van deze levertijden kan voor een significante afname zorgen van de benodigde veiligheidsvoorraden zonder dat er moet worden ingeleverd op de effectiviteit van het onderhoud. Op deze manier kan Afdeling X bijdragen aan een efficiëntie slag voor Company X door het reduceren van haar uitbestede reparatielevertijden.
De hoofdvraag van dit onderzoek luidt: Hoe kan Company X de variatie en duur van haar levertijden reduceren betreffende de reparaties welke worden uitbesteed? Om deze vraag te kunnen beantwoorden, hebben wij eerst een literatuuronderzoek gedaan naar mogelijke relevante onderdelen of aspecten van de mogelijke oorzaken van een variatie in levertijd. Aanvullend is hiervoor ook de expertise binnen Afdeling X geraadpleegd. Deze bevindingen hebben geleid tot veelbelovende interview vragen voor de interviews welke gevoerd zijn met een relevante subset van leveranciers van Company X. Op basis van deze interviews kon geconcludeerd worden dat de aspecten ‘Forecasting’, ‘Onzekerheid tijdens het reparatieproces’ en ‘Focus on X’ de meeste potentie hebben voor Afdeling X om de variatie en duur van haar levertijden te reduceren. De volgende drie paragrafen zullen de betreffende methodes per aspect samenvatten. Deze methodes trachten gebruik te maken van het beschikbare potentieel per aspect om de variatie en duur van uitbestede reparatielevertijden naar beneden bij te stellen. Voor een detailoverzicht van deze methodes verwijzen wij u door naar paragraaf 4.3 van deze thesis.
om op tijd te anticiperen. Zakelijke overeenkomsten in combinatie met een forecast zijn nodig gebleken om de leverancier te motiveren om vooruit te bestellen en om vervolgafspraken te maken met zijn toeleveranciers. Wij adviseren om deze afspraken betreffende levertijden te relateren aan een zakelijk overeengekomen zekerheidsinterval van de forecast.
Zelfs in het geval Afdeling X een 100% accurate forecast af zou geven van het aantal te verwachte reparaties, zal de leverancier nog steeds een onzekerheid ondervinden betreffende de facultatieve delen welke benodigd zijn om het reparatieproces te vervullen. Een RMA (Return Material Authorization) proces waarbij de leverancier op voorhand informatie verschaft krijgt betreffende de reden van uitbouw is daarom onder andere geadviseerd. Een RMA-proces geeft de leverancier meer informatie over de sub componenten die waarschijnlijk benodigd zijn om de reparatie uit te voeren. Door formeel met de leverancier in te stemmen over een gemiddelde prijs en levertijd, zal de leverancier daarnaast gemotiveerd zijn om op basis van deze RMA-informatie sub componenten vooruit te bestellen. Niet alleen de onzekerheid aan de vraagzijde van deze sub componenten draagt bij aan een variatie in levertijd. Ook de onzekerheid aan de aanbodzijde van deze sub componenten bleek wezenlijk bij te dragen aan de variatie in levertijden. Wij adviseren Afdeling X daarom om met haar leveranciers formeel overeen te komen tot uiterste productie- en reparatiedata. Daarnaast zal de leverancier gemotiveerd en geïnstrueerd moeten worden om de forecast welke hij ontvangt van Afdeling X letterlijk te vertalen naar zijn toeleveranciers. De leverancier zal daarvoor een vertaling moeten maken naar het aantal sub componenten welke benodigd zijn om aan de forecast van Afdeling X te kunnen voldoen. Deze vertaling van de forecast blijkt een randvoorwaarde voor de leverancier om formele afspraken te kunnen maken met zijn toeleveranciers betreffende levertijden.
Management Summary
This Master graduation thesis Reducing the variance and duration of external repair lead times, is initially about researching the possibilities for reducing the variance and duration of lead times for the repairs which are being outsourced by Department X (Supply Chain Operations). Department X experiences pressure from the Dutch government to improve its efficiency in maintaining and operating its X. The availability of ready-for-use spare parts is essential for Company X Maintenance and Service to conduct its maintenance in an effective way. During the last four years Company X had on average a spare parts inventory equalling 125 million Euros per year in order to ensure its availability of spare parts. Variance in lead times corresponding to the supply of spare parts influences the safety stock needed to reach the desired availability of spare parts. Reducing the variance and duration can dramatically reduce the needed stock levels without harming the maintenance effectiveness. In this way, Department X can contribute to the goal of making Company X a more efficient organization by reducing the variance and duration of its outsourced repair lead times.
The main question for this research is therefore the following:How can Company X reduce the variance and duration of its external repair lead times? In order to answer this question first parts of or aspects related to the causes of a variance in these outsourced repair lead times have been obtained from literature and available expertise within Department X. These insights led to promising inquiry areas for the interviews which have been conducted with a subset of Company X’ suppliers. Based on the results of these interviews it could be stated that the aspects ‘Forecasting’, ‘Uncertainty in repair process’ and ‘Focus on X’ have most potential for Department X to reduce the variance and duration of its outsourced repair lead times. The next three paragraphs will concisely summarize the methods related to these aspects.
advise Department X to form these agreements with its suppliers in conjunction with a formally agreed confidence interval relating to the communicated forecast.
Even when Department X communicates a 100% reliable forecast regarding the number of repairs it will send, the supplier still faces uncertainty regarding the facultative parts needed to fulfil the corresponding repair processes. An RMA (Returned Material Authorization) process which informs the supplier in more detail about what could be possibly the reason of repair, already improves the knowledge upfront regarding the subcomponents needed. In combination with formally agreed standard delivery times and prices, the supplier will be more motivated to perform actions ahead in time. Not only the uncertainty on the demand side of subcomponents appeared to be contributing to a variance in repair lead times. Also, the uncertainty regarding the supply side of subcomponents appeared to be a significant cause of a variance in repair lead times. Therefore, we advise Department X to formally agree with its suppliers on obsolescence dates for each article or subcomponent they produce or repair. Besides, suppliers must be motivated to translate the Company X forecast into the subcomponents needed for repair and communicate this undistorted to their sub suppliers. This forms a precondition for these suppliers to make subsequently formal agreements with their sub suppliers regarding lead times.
Preface
There it is! My final thesis, which describes the result of the research I did in the field of supply chain operations. This research allowed me to gain valuable and practical insights in the world of lead times and spare parts from a logistic point of view. I believe that these insights will provide me a launch in my future career. Therefore, I am grateful for Department X for assigning me such a complex and extensive research.
For realizing the result of this research, I have been to places I did not expect to be. I made my first ever business trip, to Berlin. I additionally visited the Hutchison ports of Company C in Rotterdam and conducted in-depth interviews with Military D and Fokker. It was an astonishing discovery to see the similarities in maintenance and supply chain operations even though organizations like Military D and Fokker certainly do not maintain X.
I should like tobegin by thanking my girlfriend Nora, for always providing me coffee when I needed one and for reminding me not to stare too long at my thesis. I also would like to thank my parents and brother, for always supporting me during this study.
Then I also would like to thank Company supervisor A and Company supervisor B. First, I do like to thank Company supervisor A for his wise words during this study and showing me the ins and outs of Department X. Secondly, I would like to thank of course Company supervisor B for always bringing me positive energy, being there when I needed a second eye and last but not least for making the necessary jokes.
I certainly also would like to thank my supervisors Petra Hoffmann, Fredo Schotanus and Klaas Stek. I always felt welcome in the cosy office of Klaas Stek. I really appreciated your enthusiasm in providing me relevant literature, books and structure. Besides, I greatly valued your listening ear.
Contents
1. Introduction ... 1
1.1. Research context ... 1
1.2 Research problem ... 2
1.2.1 Focus on efficiency ... 2
1.2.2 Importance of lead times in relation to maintenance ... 3
1.2.3 Effect of lead times on inventory ... 4
1.3 Research Questions. ... 5
2. Theory ... 7
2.1 Potential root causes unpredictable lead times ... 7
2.1.1 Uncertainty in demand ... 7
2.1.2 Uncertainty in supply ... 9
2.1.3 Uncertainty in process... 10
2.2 Potential methods for decreasing unpredictability of lead times according to literature ... 12
2.2.1 potential methods for decreasing demand uncertainty ... 13
2.2.2 potential methods for decreasing supply uncertainty ... 14
2.2.3 potential methods for decreasing uncertainty in process ... 15
2.3 Classification for the approached suppliers ... 16
2.4 conclusion ... 17
3. Methodology ... 18
3.1 Approach for clarifying current situation and agreements regarding external repair lead times ... 18
3.1.1 Approach for gaining an insight in current agreements between Department X and its suppliers ... 19
3.1.2 Approach for clarifying definition of an external repair lead time within Department X and how these are being monitored ... 19
3.1.4 Considerations for a categorization of articles ... 22
3.1.5 Conclusion ... 23
3.2 Approach for determining a relevant subset of suppliers and clarifying what root causes are responsible for a variance in external repair lead times ... 24
3.2.1 Approach for determination of relevant subset of suppliers ... 24
3.2.2 Approach for setting up interviews with Company X’ suppliers ... 26
3.2.3 Method for processing propositions into interview questions ... 29
3.2.4 Conclusion ... 30
3.3 Approach for formulating effective methods ... 30
3.3.1 A scoring model for quantifying the potential ... 30
3.3.2 Approach for formulating methods to counteract a variance in external repair lead times .... 33
3.3.3 Benchmarking approach for gaining practical insight regarding implementation of methods . 34 3.3.4 Conclusion ... 35
3.4 Conclusion ... 35
4. Results ... 35
4.1 Current situation external repair lead times ... 36
4.1.1 Agreements between Department X and its suppliers regarding repair lead time performance ... 36
4.1.2 Definition of external repair lead time within Department X and broad segmentation of its variance ... 37
4.1.3 Current variance and duration of outsourced repair lead times ... 39
4.1.5 Conclusion ... 41
4.2 Root causes of a variance in external repair lead times for Department X ... 41
4.2.1 Subset of suppliers for conducting the interviews ... 41
4.2.2 Additional empirical evidence for propositions ... 42
4.2.4 Root causes ... 45
4.3 Methods for decreasing variance in external repair lead times ... 47
4.3.1 Methods corresponding to the forecasting aspect ... 47
4.3.2 Methods for counteracting uncertainty in the repair process ... 50
4.3.3 Methods for enhancing Focus on X on repair lead times ... 52
4.3.4 Implementation of methods ... 54
4.4 Conclusion ... 54
5. Discussion... 56
6. Academic contribution ... 58
7. Conclusion ... 60
8. Limitations and further research. ... 62
List of figures
Figure 1. 1: Organogram Company X ... 2
Figure 1. 2: Segmentation outsourced repair lead time ... 3
Figure 1. 3: Relation safety stock and variance in repair lead time ... 4
Figure 2. 1: Visualization of demand patterns (Erratic, Lumpy, intermittent and smooth) ... 8
Figure 3. 1: Schematic visualization methodology ... 18
Figure 3. 2: Approach sub question one ... 23
Figure 3. 3: Approach for retrieval of the most salient causes of variance ... 28
Figure 3. 4: Steps scoring model at a high level of abstraction ... 33
Figure 3. 5: Approach for formulating methods for reducing variance ... 34
Figure 4. 1: Segmentation of an external repair lead time ... 38
Figure 4. 2: Example data-analysis conducted per article ... 39
List of tables
Table 2. 1: Elements based on literature to characterize the interviewed suppliers ... 17
Table 3. 1: Drawbacks and remedies for defining relevant subset of suppliers ... 26
Table 3. 2: Consulted specialties within Company X for achieving an exhaustive interview... 27
Table 3. 3: Scores of potentials for improvement ... 31
Table 3. 4: Scores of relevance for improvement ... 32
Table 3. 5: Scores for potential of reducing variance and duration external repair lead times .... 32
Table 4. 1: Referring to figure 4.1, the portion in percentages per segment of external lead time as monitored by Department X for suppliers located in a foreign country ... 38
Table 4. 2: Referring to figure 4.1, the portion in percentages per segment of external lead time as monitored by Department X for domestic suppliers ... Fout! Bladwijzer niet gedefinieerd. Table 4. 3: Categorization per interviewed supplier ... 42
Table 4. 4 : Outline of the conducted interviews with Company X’ suppliers ... 43
Table 4. 5: per supplier its representation expressed in the number of repaired articles ... 45
Table 4. 6: Causes per aspect of an unpredictable repair lead time ... 46
Table 4. 7: Methods for decreasing the variance and duration in outsourced repair lead times relating to the forecasting aspect... 49
Table 4. 8: Methods for decreasing the variance and duration in outsourced repair lead times relating to the forecasting aspect... 52
1. Introduction
In order to give an understanding of the context in which this research is conducted first some background information will be provided. This chapter includes a company description, a problem description and the research questions. Since this research focuses on lead times corresponding to outsourced repairs, an emphasis will be made on the importance of lead times.
1.1. Research context
This paragraph has been removed for this public version
This research is conducted for the Supply Chain Operation (SCO) department of Department X. SCO is a division of the Maintenance and Service department (O&S) of Company X. O&S is responsible for the cleaning, maintaining and refurbishing of its X. An organization chart has been inserted in figure 1.1. SCO administers, manages and deals with all the contracts for the spare parts and equipment needed to keep the X of Department X operational. SCO has the specific task to look for an optimum balance between inventory holding cost, operational cost and stock-out costs. This department decides on which inventory levels to attain for which components at which locations.
Figure 1. 1: Organogram Company X11
As explained, SCO decides for each component which inventory levels to attain while ensuring the availability of its X. The next chapter will explain how this decision has a dependence on lead times corresponding to the (outsourced) repair of these X.
1.2 Research problem
This description of the research problem begins by explaining why Company X has recently increased its focus on efficiency. The next subsection explains how lead times have a direct impact on the extent to which Company X could keep its X operational in an efficient way. This efficiency potential of lead times will be clarified by explaining the effect of lead times on needed inventory. 1.2.1 Focus on efficiency
This paragraph has been removed for this public version
Currently Company X is on the right track towards achieving a sufficient score on all agreed performance levels for 202512. The current levels of performance have been partly a result of significant investments done by Company X. In order to ensure the possibility of doing these investments also in the future, Company X should actively search for possibilities for making its
operations more efficient13. In the next subsection it will be explained why the current fluctuation of the duration of outsourced repair lead times hinders an efficient maintenance strategy.
1.2.2 Importance of lead times in relation to maintenance
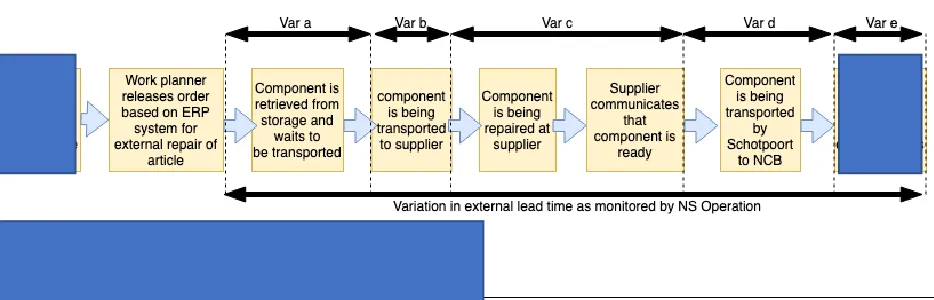
[image:20.612.80.547.421.571.2]Department X conducts its maintenance by applying a repair-by-replacement principle. This principle implies that the to be repaired article is demounted from the X and replaced by a ready-for-use article. To be able to adequately apply this principle, the availability of ready-ready-for-usespare parts at its maintenance locations is critical. During the last four years Company X had on average a spare parts inventory equalling X euros per year in order to ensure this availability of spare parts. If a spare part is being sent to an external supplier for MRO activities, there will be an external lead time. This external lead time differs however per supplier and per type of spare part. Beside this difference in lead times per supplier and per spare part, the duration of a lead time corresponding to a specific repair fluctuates. These lead times do fluctuate in such a manner that these lead times form an unpredictable factor for Department X. Multiple steps are included in an external repair lead time and could be the reason of this fluctuation. The demarcation of a variance in an outsourced repair lead time is being depicted in figure 1.2 at a high level of abstraction. Figure 1. 2: Segmentation outsourced repair lead time
The next subsection describes how reducing the current unpredictable fluctuation in outsourced repair lead times could directly contribute to the goal of Department X towards achieving more efficiency.
1.2.3 Effect of lead times on inventory
[image:21.612.74.528.264.426.2]As explained, the availability of ready-for-use spare parts is essential for Company X Maintenance and Service to conduct its maintenance. Variance of lead times corresponding to the spare part supply influences the safety stock needed to reach a certain availability of spare parts14 (see also figure 1.3). Reducing this variance can therefore dramatically reduce the needed levels of safety stock without harming the maintenance effectiveness. Besides, according queuing theories, shorter lead times require fewer spare parts needed solely for accommodating the duration of an outsourced repair lead time15.
Figure 1. 3: Relation safety stock and variance in repair lead time16
Department X wishes to contribute to the goal of making Company X an organization which remains able to invest in itself by reducing the level of spare part inventories needed. As explained above, Company X could realize this by reducing the variance and duration of its outsourced repair lead times.
Insight should be gained in the driving factors behind a variance in these lead times. Based on the complete picture of what drives a lead time to be shorter or longer for Department X, methods should be determined which counteract the effect of these causes of a variance in outsourced repair lead times. The next subsection describes which essential steps must be made to gather the essential information needed for realizing these methods. Research is needed to come to a set of methods which have the most potential for successfully decreasing the variance and duration of outsourced repair lead times.
14 See He & Jeang (2009), p. 1
1.3 Research Questions.
As explained above, Department X wishes to reduce the variance and duration of its outsourced repair lead times. This will directly contribute to the goal of making Company X an organization which remains able to invest in itself by being financially healthy. In this chapter it will be explained how this research will contribute in gathering sequentially the essential information. The main question for this research is the following:
“How can Company X reduce the variance and duration of its external repair lead times?”
In order to answer this main research question, three subsequent research questions have been formulated. The first research question must clarify the situation in which these external repair lead times prevail. Therefore, first there must be an understanding of what is currently being agreed upon between Company X and its suppliers regarding the condition of these lead times. It must be additionally addressed based on which information Department X evaluates these agreements. The first research question in this research is therefore an exploratory one and concerns:
1. Which agreements has Department X currently with its suppliers regarding the variance
and duration of outsourced repair lead times? Based upon which information is
Department X evaluating the accomplishment of these agreements?
The solution to the main research question will be in the form of one or multiple methods or approaches which realize a reduction of the variance and duration of outsourced repair lead times. The full potential of this desired set of methods or approaches could only be achieved based on a complete picture of the most salient causes of a variance in outsourced repair lead times. In order to ensure this full potential, the research should initially focus in obtaining the driving forces of a variance in these lead times for Department X. This brings us to the next sub-question:
2. Which root cause or set of root causes of a fluctuation in lead times are present and have
most potential for decreasing the variance and duration of external repair lead times?
or reducing the effect of these root causes found. Root causes will be linked to a set of methods which have potential to significantly reduce their effect. A well proven method is preferred by Department X. The following research question is therefore:
3. Which methods or approaches can significantly reduce the effects of the retrieved set of
root causes in a permanent way?
2. Theory
A theoretical framework for this research is provided in this chapter. Firstly, this literature study is intended to provide possible root causes of unpredictable lead times. Uncertainty is a direct consequence of the unpredictability of lead times. As expressed by Koh and Saad in 2002, uncertainty is defined as “Any unpredictable event in manufacturing environments that disturbs operations and performance of an enterprise” 17. Due to this inherent relation of unpredictability and uncertainty in manufacturing environments, causes of uncertainty in literature have been considered and, when reasonable, explained and treated here as potential (root) causes of a variance in lead times. These potential root causes contributed in forming promising inquiry areas for the interviews conducted with Company X’ suppliers during a later stage in this research.
This chapter also summarizes a literature study which provided a theoretical framework for formulating the available methods which have potential to reduce the variance in lead times for Department X.
2.1 Potential root causes unpredictable lead times
First a literature study has been done for obtaining what already has been written in academic papers about potential root causes. The sources of a variance in lead time obtained by literature study were rather general and include, uncertainty in demand, uncertainty in supply and uncertainty in process. As noticed by Angkiriwang, Pujawan & Santosa, this supply chain uncertainty could be categorized according downstream-, upstream- and process- uncertainty18. This categorization will also be used here to describe the potential root causes of unpredictable lead times described by literature.
2.1.1 Uncertainty in demand
The first class of supply chain uncertainty which could be distinguished in literature relates to uncertainty in demand. Andrzejczak, Mlynczak & Selech (2018) have studied the occurrence of random failures for technical complex objects which must fulfil high requirements regarding cost-consumption, safety, ecology, availability and functionality.According to this research random
failures for these complex technical objects are as good as unavoidable during its operation.19 These random failures result in corrective maintenance. Corrective maintenance concerns all the maintenance which is not included in scheduled or preventive maintenance. Due to the random nature of corrective maintenance, knowledge of stochastic processes is of value when trying to keep the material efficient and safe during operation. This requires extensive and detailed knowledge concerning forecasting the frequency of failures during their operation.
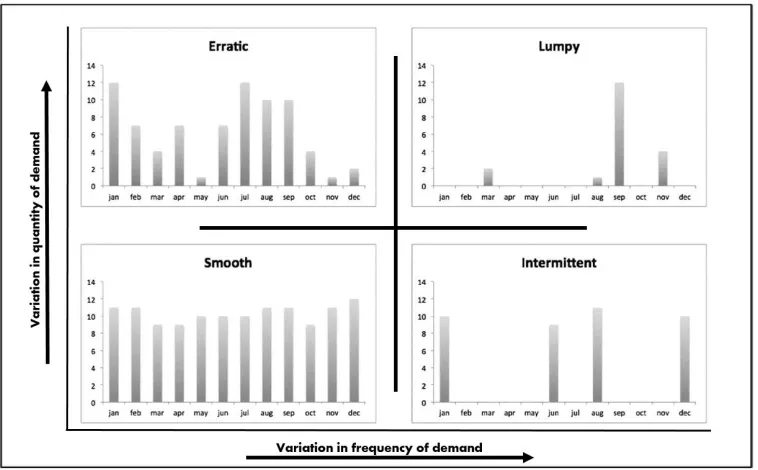
Syntetos, Boylan & Croston, (2004) suggest a model for the classification of demand patterns for this corrective maintenance20. This model is based on the variances in frequency and quantity of historic demand. As indicated in figure 2.1, the following classes could be distinguished based on this model:
• Smooth demand: Regular intervals of demand with a limited variance in the quantities • Intermittent demand: Sporadic demand with no significant variance in the quantities • Erratic demand: Regular intervals of demand with a significant variance in the quantities • Lumpy demand: Great number of intervals with no demand in combination with a
[image:25.612.91.470.409.644.2]significant variance in the quantities
Figure 2. 1: Visualization of demand patterns (Erratic, Lumpy, intermittent and smooth)
The more uncertain the moments are at which demand occurs and the more uncertain the corresponding quantities are, the more unpredictable the demand will be. The Lumpy category gives therefore the most uncertainty21.
Above, categorizations of randomness inherent to the demand for repairs corresponding to corrective maintenance has been described. There is a danger of amplification of this randomness if we go upstream in the supply chain. This is phenomenon is caused by the well-known Bull whip effect. This danger is inevitable if companies across the supply chain operate as autonomous firms even though they form a part of the supply chain. This reduces the effective information flow across the supply chain. Ineffective information sharing, in combination with the fact that each manufacturer has different views of interpreting customer information, ultimately results in the Bull whip effect22.
In this section the uncertainty related to the often lumpy and intermittent demand of spare parts for corrective maintenance has been discussed. We argued based on this literature that this uncertainty and therefore unpredictable demand influences the variance of repair lead times. There is a danger of amplification of this uncertainty if we go upstream in the supply chain. This danger is caused by the well-known Bull whip effect.
2.1.2 Uncertainty in supply
The next class of supply chain uncertainty which could be distinguished in literature relates to uncertainty in supply. This paragraph will first discuss the relevance of material availability for lead times based on the Total Cost of Ownership (TCO) principle. According to Heijmann, TCO includes all benefits and costs over the whole lifetime of the services or goods. Opportunity costs are also included in the TCO.23 When a component needed for a repair appears to be out of stock, the supplier must place a backorder. In case of no formal arrangements regarding lead times, the main costs of a backorder for the supplier is a loss of goodwill and customer satisfaction due to a longer repair lead time. For Company X however, the same backorder and the resulting shortcoming in supply could result in lost revenue by leaving a X not capable for being in operation. This is for example the case for logistical critical articles. An article is said to be
21 See Hautaniemi & Pirrtilä (1999), p. 89
logistical critical if the system may not function without this article being built in. Hence, TCO costs corresponding to a backorder are significant higher for Company X than for the supplier. Therefore, it is argued that the supplier has less incentive to put components needed for repair on stock. Especially if these components are slow movers and relatively expensive. This assumption will be tested by asking the supplier for its driving forces for putting components on stock. As explained by Tang (2005) and by Mohebbi & Choobineh (2004), material availability and supply lead times form the major factors for determining supply uncertainty24. Based on this explanation we propose a proposition which states a positive correlation between uncertainty in supply at the supplier and the variance of external lead times of Department X.
2.1.3 Uncertainty in process
The next class of supply chain uncertainty which could be distinguished in literature relates to uncertainty in process. This uncertainty relates to the internal operations of a manufacturing process. Based on the theoretical considerations for sourcing activities in or out, additional potential root causes will be formulated. According Cousins et al.and Hansen & Schütter the two main theories for these make or buy decisions concern the Resource-Based View (RBV) and Transaction Cost Economics (TCE)25.
This paragraph discusses the presence of uncertainty in process as a result of transactional difficulties described by the Transaction Cost Economics (TCE) Theory. Christopher and Lee describe that, as a consequence of outsourcing activities, uncertainty could arise as a result of low visibility or no confidence across the supply chain26. This low visibility and no confidence across the supply chain seems to correspond to the transactional difficulties which arise when outsourcing27. These difficulties are the prominent risk of opportunism and bounded rationality28. According the Transaction Cost Economics (TCE) theory, prices typically do not reflect all the various aspects which are relevant for making the make-or-buy decision. Opportunism is defined by Luo and Meyer as distorting information and misleading the other party by making use of an asymmetry in relevant knowledge in order to achieve one’s goals29. As
24 See Tang (2005), p.458 and Mohebbi & Choobineh (2004), p.1
25 See Cousins, Lamming, Lawson & Squire (2008), p.27 and Hansen & Schütter (2009), p.1 26 See Christopher & Lee (2004), p.6
27 See Teece (1976), p.2
described by Selten, the bounds of rationality are a result of the limitations corresponding to what human beings are able perceive30. As a consequence of this bounded rationality, human beings are susceptible for non-optimal decision behaviour. For example, while they are trying to optimize their profits in a business environment. Due to bounded rationality a contract could be based on possibly opportunistic information and promises given by the contractor. As a result, incomplete contracts are not an exception in complex market transactions31. Besides, according to Hoffmann, bounded rationality can be become a problem in uncertain business environments32. This could for example lead to capacity or material availability problems at an Company X’ supplier when Company X is not able to estimate future demands.
By using the Resource Based View (RBV) theory, this paragraph discusses potential causes of uncertainty in process due to the presence of the preferred customer status principle. In line with its RBV theory, Barney states in 1991 that four criteria are most relevant for a company’s resources to distinguish for sustainable competitive advantage in a business environment: Value, rareness, substitutability and imitability33. Madhani summarizes these criteria in his paper in 2010 as resource heterogeneity and immobility34. If a firm is in the possession of resources which are to a significant extent imperfect in mobility, substitutability and imitability, it will achieve advantage which is not available in market forms of transactions. According to Company X a typical trend in Company X procurement and after-sales market can be seen in which an increase in property rights is noticed35. According Lazzari et al. property rights, information asymmetry, asset specificity and
contracts also contribute to the heterogeneity of resources36. As a result, not all companies are to the same extent capable of producing and/or repairing certain products and/or services. This scenario could have resulted for Company X in being to a certain extent dependent on certain suppliers. This especially holds in a market of supplier scarcity. According to Company X (2019a), a trend in their X market could be seen in which the suppliers merge and acquire. In these resulting oligopolistic market structures, the suppliers may be highly selective to what extent they allocate
30 See Selten (1999), p.4 31 See Williamson (2002), p.8 32 See Hoffman (2011), p.76 33 See Barney (1991), p.99 34 Madhani (2010), p.3
resources and capabilities to their customers37. The supplier might apply privileged treatment if a bottleneck occurs due to expertise or capacity availability38. This could in its turn lead to lower delivery performance which corresponds to longer and less predictable lead times39. Based on the latter we formed a proposition which states a positive relationship between the preferred customer status of Company X at its suppliers and the variance of the corresponding repair lead times. According to Voortman (2016) customer attractiveness is strongly related to the amount of profit which the customer generates at the supplier40.
Beside set-up times and batching, additional detailed reasons have not been found regarding the process which are directly related to a variance in lead times. This could be seen as a shortcoming in literature. According to Kuik and Tielemans, applying batching for minimization of processing time of repairs, will certainly not lead to a minimization of the lead-time variance41. The presence of set-up times for certain repairs could be the reason at the supplier for applying a batching technique.
In this section it has been argued based on literature that preferred customer status, bounded rationality and opportunism can have a potential effect on repair lead time variability too. These theoretical root causes will be tested for their presence during a later stage of this research. Bounded rationality brings a danger of distortion or misleading information by opportunistic suppliers regarding for example the duration of lead times. It appeared to be relevant to know if batching is applied at the supplier and if so, which batching-technique is being used. The next section will summarize the set of methods described by literature to eliminate or decrease the effect of these causes of uncertainty.
2.2 Potential methods for decreasing unpredictability of lead times according to literature
This section summarizes the methods which are suggested by literature to decrease the unpredictability of lead times. Methods for counteracting the uncertainty across the supply chain
37 See Schiele, Calvi & Gibbert. (2012), p.2 38 See Steinle & Schiele (2008), p.11 39 See Ulaga (2003), p.684
40 See Voortman (2016), p.3
have been considered and, where reasonable, explained and treated here as potential methods for Department X for decreasing the variance of outsourced repair lead times.
2.2.1 potential methods for decreasing demand uncertainty
The first class of supply chain uncertainty which could be distinguished in literature relates to uncertainty in demand. In this section methods obtained from literature are being included which relate to the downstream part of the supply chain. Especially methods for counteracting the uncertainty of demand caused by corrective maintenance gets significant attention in literature. As explained in section 2.1.1 this corrective maintenance is characterized by stochastic demand patterns.
Forecasting techniques could be used to counteract the uncertainty of the demand patterns of repairs caused by corrective maintenance. However, according to Hemeimat et al. companies face difficulties in setting up a proper forecast which is adequately in giving a proper reflection of the often lumpy and intermittent demand of spare parts42. Besides, as explained by Chen et al., any forecasting technique can cause the Bull whip effect43. The next paragraph will discuss how a contribution to the Bull whip effect by forecasting can be avoided.
Centralized demand information reduces information distortion across the supply chain. By applying this remedy each stage of the supply chain is provided with complete information on the actual customer demand. In this way, applying centralized demand information by communicating the forecast of the customer directly to all stages in the supply chain could significantly reduce the well-known effect of the Bull whip44. In this way the actual customer demand data can be used, rather than relying on the orders received from downstream stages in the supply chain.
The risk pooling method makes use of the principle that high demand of one customer can be offset by the low demand of another customer. Risk pooling effect can be achieved by centralizing stocks or reducing facilities across the supply chain. In this way the demand is being aggregated. As explained by Nadeem, an aggregation of demand forecast increases accuracy45. This theory of risk
42 See Hemeimat, AL-Qatawneh, Arafeh & Masoud (2016), p. 1 43 See Chen, Drezner, Ryan & Simchi-Levi (1999), p.421 44 See Chen et al. (1999), p.431
pooling implies that demand uncertainty can possibly be reduced by forming a consortium of segment X companies which allocate a certain type of repair to one specific supplier.
In this section methods have been summarized which can decrease the uncertainty inherent to the stochastic demand caused by repairs corresponding to corrective maintenance. Forecasting is an effective remedy to counteract this uncertainty. Therefore, according literature, it appeared to be relevant to know if a forecast is currently being shared by Company X or set up by the suppliers. Due to the Bull whip effect, it is important to know which subsequent action the supplier undertakes based on this forecast and if this forecast adequately reflects future customer demand. 2.2.2 potential methods for decreasing supply uncertainty
The second class of supply chain uncertainty which could be distinguished in literature relates to uncertainty in supply. In this section methods obtained from literature are being included which relate to the upstream part of the supply chain.
This paragraph will discuss the importance of alternative sourcing availability based on literature. As stated by Pujawan in 2004 alternative sourcing has an impact on the uncertainty in supply46. However, according Najafi et al., the most appropriate multiple sourcing strategy is not always evident and depends on the importance of the component, the structure of the supply market and how the suppliers are related to each other47.
Multiple sourcing can also be used to induce the supplier to provide high performance because the buyer has the possibility to switch between suppliers. When applying this strategy, this is referred to as competitive sourcing. According to Richardson & Roumasset (1995) the proportion of business awarded to suppliers has to be varied over time to ensure their awareness of a prevailing competitive environment48. Switching costs must be taken into account when considering this competitive sourcing strategy.
Not all literature recommends multiple or competitive sourcing. W. Edwards Deming advocates for example forming closer relationships with fewer suppliers49. The rationale behind this is that substantial specific investments in a single supplier will raise quality and improve co-ordination.
46 See Pujawan (2004), p.88
47 See Najafi, Holmen, Lind & Pedersen (2014) 48 See Richardson & Roumasset (1995), p.72
Besides, as explained in section 2.1.3, customer attractiveness is strongly related to the amount of profit which the customer generates at the supplier. According this theory, varying the proportion of business awarded per supplier is not in favour of creating a status of preferred customer at the supplier.
Multilevel cooperation across the supply chain by setting up contractual agreements with suppliers, is suggested by Miller in 1992 as an effective method to reduce the supply uncertainty50. These contracts induce an interdependence between the corresponding firms. As a result, the firms will collaborate more and act less as autonomous firms. Contracting increases supply chain confidence. Without confidence throughout the supply chain, supply chain managers are liable to decision risks and feel themselves obliged to buffer against uncertainties51.
In this section different methods have been discussed which could counteract the uncertainty inherent to supply. Pros and cons have been given for the method of competitive sourcing. Besides, the importance of multilevel cooperation by contracting for inducing an integrated supply chain has been discussed.
2.2.3 potential methods for decreasing uncertainty in process
The third class of supply chain uncertainty which could be distinguished in literature relates to uncertainty in process. In this section methods obtained from literature are being included which relate to the process part of the supply chain.
Component commonality among products is strongly advised by Mohebbi and Choobineh in a situation in which both demand- and lead time- variability prevail. Component commonality is an attribute of product design decisions52. When possible, component commonality enables and benefits the risk pooling effect. Component commonality has a positive effect on the on-time order delivery and with that responsiveness of the supplier. Besides commonality enables the postponement principle in the production process. The next paragraph will explain and discuss this postponement principle.
50 See Miller (1992), p.323
Postponement is a strategy where the identity of the product is being formed at the latest possible point in time in the manufacturing process or in the supply chain. In this way the product will be completed after the receiving of a customer order. This is opposed to the strategy of performing these activities of completion in anticipation of future orders. Postponement reduces the risk of performing these completion activities beforehand, since the delay of completion leads to the availability of more information. The availability of more information reduces the risk which is inherent to the uncertainty in demand53.
According to Kumar & Aouam in 2018, systematic investments in setup time reduction can decrease the variability in the duration of manufacturing lead times54. They studied the impact of set up times on manufacturing lead times. Setup times can often be reduced by modifying
fixtures and tools, making investments in revising setup procedures, or introducing robotic equipment. Shorter setup times often results in shorter lead times which supports smaller batch sizes which directly impacts needed levels of safety stock.
In this section different methods have been discussed which could counteract the uncertainty in process. Component commonality has been discussed as an enabler for the postponement and risk pooling strategies. Component commonality in combination with postponement and risk pooling, reduces the risk which is inherent to the uncertainty of demand. Decreasing setup times and batch sizes can decrease the variability in manufacturing lead times.
2.3 Classification for the approached suppliers
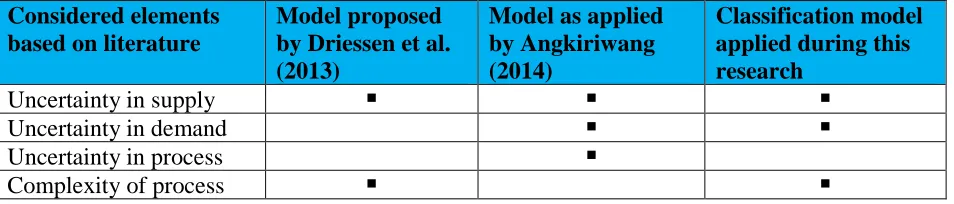
In this section literature is summarized based on which the interviewed Company X’ suppliers have been categorized. Each supplier will be categorized based on its experienced uncertainty in demand, uncertainty in supply and complexity of its process. This categorization is a mixed version of the typology of suppliers applied by Angkiriwang and the proposed model of Driessen et al.55. Angkiriwang et al. used this typology for evaluating the degree of uncertainty for its set of examined suppliers while researching possibilities for supply chain flexibility. The model for a
53 See Xiaxun & Jiajun (2016), p.58 54 See Kumar & Aouam (2018), p.1
typology of repair shops proposed by Driessen et al. was originally intended for determining which control principles should be applied for which type of repair shop.
[image:34.612.74.551.336.438.2]The categorization used for this research uses elements of the above-mentioned models. The elements regarding the uncertainty in demand and supply are according the model of Angkiriwang et al. However, the uncertainty in process element of this model has been replaced by the complexity element of the model of Driessen et al. Uncertainty in process is expressed by Angkiriwang et al. in terms of variability in processing time, cycle time, yield and availability. This research has however an interest in the causes of these variabilities. The choice has therefore been made to include the complexity of the repair process and to exclude this uncertainty in process element. Table 2.1 summarizes which elements of the considered models has been used in this research to characterize the suppliers.
Table 2. 1: Elements based on literature to characterize the interviewed suppliers
Considered elements based on literature
Model proposed by Driessen et al. (2013)
Model as applied by Angkiriwang (2014)
Classification model applied during this research
Uncertainty in supply ■ ■ ■
Uncertainty in demand ■ ■
Uncertainty in process ■
Complexity of process ■ ■
In this section, a categorization of Company X’ suppliers has been proposed. This categorization consists of elements for which it is argued based on literature that they have possibly an effect on the variance of repair lead times. These elements concern the complexity of the repair process and the experienced uncertainty in supply and demand by the supplier. In section 2.1.3 it has been explained how a status of preferred customer status is also possibly positive correlated with the variance in lead times for Company X. Section 3.2.3 clarifies what propositions are made in conjunction of these elements and how these propositions has contributed in revealing causes of a variance in external repair lead times.
2.4 conclusion
it is explained how this literature has been used during the research to discover causes of the variance in outsourced repair lead times. In section 3.3 it is subsequently explained how this literature study contributed in formulating methods to counteract the variance in lead times.
3. Methodology
[image:35.612.79.527.348.439.2]The goal of this research is to reduce for Department X the duration and variance of their outsourced repair lead times. First the root causes of this variance have been obtained. Knowledge of these causes created an understanding of the dynamics of lead times. The complete picture of what drives a lead time to be longer or shorter, created also an insight in how to reduce its duration. Based on this knowledge we formulated methods which have most potential for decreasing the variance and duration of outsourced repair lead times. Figure 3.1 summarizes this methodology. The subsequent sections in this chapter explain for each sub question its applied methodology. Figure 3. 1: Schematic visualization methodology
3.1 Approach for clarifying current situation and agreements regarding external repair lead
times
3.1.1 Approach for gaining an insight in current agreements between Department X and its
suppliers
This section describes the attempt which has been done for revealing the agreements which are operational between Department X and its suppliers regarding external repair lead times. Since no subsequent methods are being formulated based on these findings, it has been chosen not to obtain a level of saturation. Therefore, instead of conducting extensive interviews, explorative conversations have been held with Company X’ employees (see next paragraph). These explorative conversations gained an initial understanding in the type of agreements Department X has with its suppliers. This initial insight helped in formulating promising interview questions regarding the effect of these agreements at the suppliers. These structured interviews with a relevant subset of Company X’ suppliers are held during a later stage in this research.
The explorative conversations are held with five contract-managers spare parts (see appendixes M, N, O, P), an administrative employee and a buyer spare parts and equipment. The contract managers spare parts have been chosen because they are actively involved in managing the possible formal arrangements which have been made with specific suppliers. The buyer spare parts has been chosen because they have specific knowledge of how arrangements are documented in the ERP system Baan. The administrative employee has been chosen because this employee in question undertakes the first action when a supplier is not delivering in compliance with the existing agreements.
The seven mentioned employees have been asked based on which prevailing agreements they evaluate and contact a supplier regarding its lead time performance. These conversations gave us an insight in what currently drives Department X to contact a supplier regarding its lead time performance. This insight is described in section 4.1.
3.1.2 Approach for clarifying definition of an external repair lead time within Department X and
how these are being monitored
receiving the goods ordered56. It will be verified if Department X monitors its lead times according this prominent definition of a lead time and if this definition is desired for Department X.
To clarify the process steps which are performed during the monitored lead time of Department X, first a generic process flow has been set up which comprises all the basic process-steps performed internally at the supplier during a general outsourced repair. This global description of an overall repair process serves also as a framework for going into more detail per supplier during the interviews conducted with Company X’ suppliers. The resulted initial overall process description is verified by a literature study, a visit at a supplier and an observation at the internal repair process of Department X in the Location X. This description shows the repair process in a stepwise manner in the form of a flow chart. This technological flow chart has been drawn in accordance with EN ISO 5807. See appendix Afor this flow chart.
Finally, we completed the insight in the process steps which are additionally included the monitored lead times of Department X. This has been done by gaining insight in the process steps which are being performed internally at Department X during an external lead time. To accomplish this, effort has also been put in place to clarify in detail the process from the moment a component is being demounted from a X at a maintenance location until the moment of shipping this component to the supplier. Also, effort has been put in place to clarify in detail the process of receiving the repair back from the supplier at Company X and the process of processing this receiving in the Company X’ ERP system. To accomplish this, 12 employees who support and control these processes within Department X have been asked about their tasks which they perform to realize this process. These employees include two storage managers, two material managers, two storage employees, three mechanics, one administrative employee and one work planner (see appendix R). These managers and employees have been asked because they are daily actively involved in realizing and controlling these internal processes.
Section 4.1.2 explains and visualizes how Department X defines and monitors its external repair lead times. A comparison of this definition is made with the definition according literature. It is additionally explained which process steps of an external lead time are included and excluded in
the definition of a lead time Department X applies. This created an understanding in how Department X currently evaluates its suppliers regarding lead time performance.
3.1.3 Approach for data-analysis current variance and duration of external repair lead times
A systematic data analysis has been done in order to understand the current situation of prevailing lead times corresponding to outsourced repairs. This data has been retrieved from the Company X ERP-system Baan on 02-01-2019 by head support office of the Location X and covers the period from January 2014 till January 2018 (see next paragraph for motivation). According the scope of this research, this data contains the external lead times corresponding to the repair of X components which have been outsourced via the Location X. Per article we determined the variance in repair lead times and visualized these by Box plots (See appendix B). To gain insight as to which articles show the most variance in lead time, these articles have been sorted in a decreasing manner according their variance by the Bubble sort algorithm. This Bubble sort algorithm has been chosen because its code is relatively easy to program in Excel VBA57. Since the algorithm running time of Bubble sort is bounded from above by O(n^2) operations and based on an assumption that each exchange operation will not take longer than 0.10 seconds, this algorithm has been chosen and effectively applied58. Per exchange operation two articles are switched from position in order to obtain a decreasing order of variances.
For this data-analysis a reference period from January 2014 till January 2018 has been taken. A time period of minimal four years is assumed to give a plausible representation of current lead times. This time span of four years is also based on the interval Company X Supply Chain Operations updates its procurement strategy59. Based on the update interval of SCO strategy it is assumed that a time span of four years takes into account the dynamics of the market in which Company X sources out its repairs for X components. A time span longer than four years is assumed to reflect a time span which comprises lead times which have arisen in a no longer relevant market situation.
Given the variances in lead times per article and per supplier per article, the variance has been determined for each supplier in total. For each supplier its corresponding articles could be viewed
57 See Bharadwaj & Mishra (2013), p. 1
as separate groups. This enables it to apply mean square within groups. This has been done by applying the following formula’s in Excel VBA:
𝑆𝑢𝑚 𝑜𝑓 𝑆𝑞𝑢𝑎𝑟𝑒𝑠 𝑊𝑖𝑡ℎ𝑖𝑛 𝑔𝑟𝑜𝑢𝑝𝑠 𝑓𝑜𝑟 𝑎 𝑠𝑝𝑒𝑐𝑖𝑓𝑖𝑐 𝑠𝑢𝑝𝑝𝑙𝑖𝑒𝑟 = ∑ ∑(𝑋𝑖𝑗− 𝑋̅𝑗)2 𝑛𝑗
𝑖=1 𝑐
𝑗=1 Where:
𝑋𝑖𝑗= 𝑇ℎ𝑒 𝑖𝑡ℎ 𝑙𝑒𝑎𝑑 𝑡𝑖𝑚𝑒 𝑓𝑜𝑟 𝑎𝑟𝑡𝑖𝑐𝑙𝑒 𝑔𝑟𝑜𝑢𝑝 𝑗 [days] 𝑋̅𝑗 = 𝑇ℎ𝑒 𝑠𝑎𝑚𝑝𝑙𝑒 𝑚𝑒𝑎𝑛 𝑓𝑜𝑟 𝑎𝑟𝑡𝑖𝑐𝑙𝑒 𝑔𝑟𝑜𝑢𝑝 𝑗 [days]
𝑐 = 𝑁𝑢𝑚𝑏𝑒𝑟 𝑜𝑓 𝑎𝑟𝑡𝑖𝑐𝑙𝑒 𝑔𝑟𝑜𝑢𝑝𝑠 𝑤ℎ𝑖𝑐ℎ ℎ𝑎𝑠 𝑏𝑒𝑒𝑛 𝑟𝑒𝑝𝑎𝑖𝑟𝑒𝑑 𝑎𝑡 𝑡ℎ𝑖𝑠 𝑠𝑝𝑒𝑐𝑖𝑓𝑖𝑐 𝑠𝑢𝑝𝑝𝑙𝑖𝑒𝑟 𝑛𝑗= 𝑁𝑢𝑚𝑏𝑒𝑟 𝑜𝑓 𝑟𝑒𝑝𝑎𝑖𝑟 𝑙𝑒𝑎𝑑 𝑡𝑖𝑚𝑒𝑠 𝑟𝑒𝑎𝑙𝑖𝑧𝑒𝑑 𝑓𝑜𝑟 𝑎 𝑠𝑝𝑒𝑐𝑖𝑓𝑖𝑐 𝑎𝑟𝑡𝑖𝑐𝑙𝑒 𝑔𝑟𝑜𝑢𝑝
Having these SSW’s per supplier makes it possible to calculate the total variance in repair lead time per supplier. This has been done according the following formula:
𝑀𝑒𝑎𝑛 𝑜𝑓 𝑆𝑞𝑢𝑎𝑟𝑒𝑠 𝑊𝑖𝑡ℎ𝑖𝑛 𝑔𝑟𝑜𝑢𝑝𝑠 𝑓𝑜𝑟 𝑠𝑝𝑒𝑐𝑖𝑓𝑖𝑐 𝑠𝑢𝑝𝑝𝑙𝑖𝑒𝑟 = SSW 𝑛 − 𝑐
Where:
n= Total number of lead times for all article groups j c= Number of article groups j
The resulting within-group variance has been summarized per supplier (See appendix B). Due to the way Department X currently monitors its lead times, these variances are not only due to transport and the processes at the supplier itself but also due to processes at Company X internally. However, these variances per supplier formed a first step towards determining the variance which is actually due to processes at the supplier itself. In a later stage during this research effort has been put in place to give a further insight in the extent to which the variance in lead times, as monitored by Company X, is due to transport and processes at Company X internally (see section 4.1.2). 3.1.4 Considerations for a categorization of articles
in repair lead times are prominent. It is then up to the supplier to indicate that these causes of variance are inherent to a certain type of article, progress step or repair.
Based on the findings of this research, an advice will go out to Company X. Therefore, a choice has been made during this research to have focus on the articles which are logistic critical. For Department X articles should be of more importance when the availability of the X depends on it.
This paragraph has been removed for this public version
3.1.5 Conclusion
[image:40.612.80.546.572.669.2]In this section first the methodology for answering sub question one has been explained. It has been clarified based on which information action is being undertaken against suppliers regarding its repair lead time performance. Then an insight has been gained in the way Company X defines and monitors its external repair lead times. A technical process description has been set up for gaining an understanding of what activities are actually being performed at the supplier internally when conducting a repair. Next a data analysis has been done in order to understand the current situation of prevailing lead times corresponding to outsourced repairs. This analysis obtained the variance in lead times per article and per supplier per article. A choice has been made during this research to have a focus on the articles which are logistical critical. Besides, a choice has been made not to exclude possible root causes of a variance in lead time by focussing on a certain class of articles for which the variance appears to be the most prominent. Figure 3.1.1 schematically summarizes this approach for sub question one. In the next section we describe how the results of the data-analysis are used in formulating a relevant subset of suppliers.
Figure 3. 2: Approach sub question one
3.2 Approach for determining a relevant subset of suppliers and clarifying what root causes
are responsible for a variance in external repair lead times
This section explains by which method the first and second sub-question have been answered. A qualitative research has been conducted for retrieving the root causes of a variance in external repair lead times. The first sub section explains how the subset of suppliers has been determined for conducting the interviews. The goal of interviewing these suppliers was to retrieve the most salient causes of a variance in lead times. Therefore, for this subset it was desired that it had the most potential for revealing causes of a variance in external repair lead times. The second sub section explains how sample efficiency is guaranteed. It is explained which efforts are being done to retrieve the most salient causes of a variance in external repair lead times.
3.2.1 Approach for determination of relevant subset of suppliers
This paragraph discusses why a not yet existing subset of suppliers had to be defined for conducting the interviews and which method has been used for achieving this relevant subset. Department X has currently allocated a valuable team of contract-managers to a self-established top 20 of suppliers. According the social exchange theory in marketing described by Bagozzi the cost of having an intense social contact with a supplier should not outweigh the gained benefits of having this kind of relationship with the supplier60. Therefore, since repair lead times are not the only important aspect of a supplier for Department X, this top 20 has not been set up solely based on the supplier performance regarding repair lead times. In order to come to a top 20 suppliers which is however solely based on historic and current lead time performance, an additional analysis has been performed. The goal of this analysis was to create a subset of suppliers which have the most potential for revealing salient causes of a variance in external repair lead times. This analysis implies a systematic examination and evaluation of the already realized dataset (see appendix B) which comprises the variance in repair lead times per article. For this analysis it has been chosen to apply an approach which creates a subset of suppliers which correspond to the articles which show the most variance in duration of their repair lead times. The approach is based on the common sense that articles which show the most variance in lead times have theoretically
the most potential for revealing explanations in how a difference in lead time could arise. The approach consists of the following steps:
1. Step 1: Take an initial number of n suppliers. For this research this number has been initially set to six (see section 3.2.2 for note on sample efficiency and how a low number of interviewees could already result in a level of saturation).
2. Step 2: Determine the article which shows the most variance and has not been encountered yet by this approach.
3. Step 3: Keep adding articles in a manner of decreasing variance in repair lead time. Keep a record of the articles with corresponding suppliers. Multiple articles could be encountered belonging to the same supplier.
4. Step 4: When a subset of n different suppliers has been realized and interviewed, evaluate if a level of saturation has been achieved.
5. Step 5: In case a saturation level has not been attained, increase n by one (n+1) and return to step one. Otherwise, stop.