http://wrap.warwick.ac.uk/
Original citation:Lamley, Jonathan M., Iuga, Dinu, Öster, Carl, Sass, Hans-Juergen, Rogowski, Marco, Oss, Andres, Past, Jaan, Reinhold, Andres, Grzesiek, Stephan, Samoson, Ago and Lewandowski, Józef R.. (2014) Solid-state NMR of a protein in a precipitated complex with a full-length antibody. Journal of the American Chemical Society, Volume 136 (Number 48). pp. 16800-16806.
Permanent WRAP url:
http://wrap.warwick.ac.uk/66503
Copyright and reuse:
The Warwick Research Archive Portal (WRAP) makes this work of researchers of the University of Warwick available open access under the following conditions.
This article is made available under the Creative Commons Attribution- 3.0 Unported (CC BY 3.0) license and may be reused according to the conditions of the license. For more details seehttp://creativecommons.org/licenses/by/3.0/
A note on versions:
The version presented in WRAP is the published version, or, version of record, and may be cited as it appears here.
Solid-State NMR of a Protein in a Precipitated Complex with a
Full-Length Antibody
Jonathan M. Lamley,
†Dinu Iuga,
‡Carl O
̈
ster,
†Hans-Juergen Sass,
§Marco Rogowski,
§Andres Oss,
∥Jaan Past,
∥Andres Reinhold,
∥Stephan Grzesiek,
*
,§Ago Samoson,
*
,∥and Jo
́
zef R. Lewandowski
*
,††Department of Chemistry, University of Warwick, Gibbet Hill Road, Coventry CV4 7AL, U.K. ‡Department of Physics, University of Warwick, Gibbet Hill Road, Coventry CV4 7AL, U.K. §Biozentrum, University of Basel, 4056 Basel, Switzerland
∥NMR Institute and Tehnomeedikum, Tallinn University of Technology, Akadeemia tee 15a, 19086 Tallinn, Estonia
*
S Supporting InformationABSTRACT: NMR spectroscopy is a prime technique for character-izing atomic-resolution structures and dynamics of biomolecular complexes but for such systems faces challenges of sensitivity and spectral resolution. We demonstrate that the application of 1 H-detected experiments at magic-angle spinning frequencies of >50 kHz enables the recording, in a matter of minutes to hours, of solid-state NMR spectra suitable for quantitative analysis of protein complexes present in quantities as small as a few nanomoles (tens of micrograms
for the observed component). This approach enables direct structure determination and quantitative dynamics measurements in domains of protein complexes with masses of hundreds of kilodaltons. Protein−protein interaction interfaces can be mapped out by comparison of the chemical shifts of proteins within solid-state complexes with those of the same constituent proteins free in solution. We employed this methodology to characterize a >300 kDa complex of GB1 with full-length human immunoglobulin, where we found that sample preparation by simple precipitation yields spectra of exceptional quality, a feature that is likely to be shared with some other precipitating complexes. Finally, we investigated extensions of our methodology to spinning frequencies of up to 100 kHz.
■
INTRODUCTIONUnderstanding of biological processes at the molecular level requires the determination of structures and dynamics of biomolecular complexes. Such studies are usually undertaken using either X-ray crystallography1−3 or solution NMR spectroscopy.4,5 Unfortunately, solution NMR studies of commonly large biomolecular assemblies are limited by the broadening of lines that stems from slower tumbling at higher molecular weights. In contrast, the line widths of biomolecules in the solid state are, in principle, independent of the size of the molecule. Thus, provided that solid-state-specific line broad-ening and sensitivity challenges are addressed, solid-state NMR spectroscopy has the potential to become a viable alternative for obtaining atomic-resolution structural and dynamic information on large protein complexes and supramolecular assemblies.6,7
To address the primary challenges of spectral resolution and sensitivity for the general case of a protein complex without a high level of symmetry, we have studied here a complex of a small protein with an antibody. Protein−antibody interactions are of great interest in molecular medicine and biology and underlie diverse applications ranging from therapeutic (anti-bodies are the fastest-growing class of protein therapeutics8) or diagnostic antibodies to immunoprecipitation. In the latter context, protein G is widely used because it is able to
specifically bind to a wide range of antibodies and the involved interactions are well-characterized. Protein G was shown to bind strongly to the Fc fragment and weakly to the Fab fragment of human immunoglobulin G (IgG).9While protein− protein interactions of various protein G domains with isolated fragments of IgG have been studied by both solution NMR spectroscopy and X-ray crystallography,10−12 structures of protein G domains with full-length IgG are currently not available. However, as we will show below, protein−protein interactions in the full-length complex can be characterized by solid-state NMR spectroscopy.
An important contribution to inherent solid-state line widths comes from inhomogeneous broadening due to chemical shift disorder and differences in magnetic susceptibility in different parts of the sample. Broadening of this type can be minimized through appropriate sample preparation, e.g., recently FROSTY/sedimentation13−15 was applied to 0.36−1.1 MDa soluble multimeric protein complexes.13,16,17 We demonstrate that spectra with quality comparable to that for crystalline preparations may also be obtained for precipitated complexes. Because of the small number of molecules per unit mass for large biomolecular complexes, it is challenging to obtain the
Received: July 10, 2014
Published: November 10, 2014
Article
pubs.acs.org/JACS
sensitivity required for detailed studies of their structure and dynamics. Most of the studied cases involve large multimeric assemblies of NMR-identical monomers that multiply the effective concentration of the observed domains (typically >70 nmol of monomer protein).13,14,16,17 However, adequate sensitivity is more difficult to obtain for complexes lacking high levels of symmetry.4 This challenge could be partially addressed with approaches such as dynamic nuclear polar-ization (DNP). For example, recently DNP enabled, in∼44 h, the recording of a 2D13C−13C spectrum of 30 nmol of IF1 (8.2 kDa) in an 800 kDa complex with small ribosomal subunit (E30S).18Currently, however, biomolecular DNP performed at cryogenic temperatures faces the challenge of large inhomoge-neous broadening that necessitates the use of specifically labeled samples. In addition, freezing of motions under these conditions impedes studies of functional dynamics.19
Here we assess proton-detected (also known as inverse-detected)20solid-state NMR spectroscopy of proteins with high concentrations of protons at magic-angle spinning (MAS) frequencies of 60−100 kHz, in the absence and presence of paramagnetic doping to speed up the acquisition, as a general alternative for quantitative structural and dynamics studies of large protein complexes in small quantities. To this end, we prepared and investigated a complex of the B1 domain of protein G (GB1; ∼6 kDa) and full-length human IgG (∼150 kDa), which precipitates from solution in several seconds after combination of the components. Precipitation of samples often occurs as a result of nonspecific interactions, resulting in NMR spectra of poor quality with broad lines due to variation in molecular environments and thus chemical shifts. On the other hand, when precipitation is driven by specific interactions, leading to the formation of a homogeneous protein−protein complex, narrow and well-defined resonances can be expected. This is the case for the precipitated GB1−IgG complex, which yields spectra with a single set of narrow resonances (see below). While it is not likely that precipitation will lead to high-quality spectra for every protein complex, the fact that it does for this system suggests that it is likely to also work for many others. In this study, we used two types of samples: a complex of natural-abundance IgG with fully protonated13C- and15 N-labeled GB1 and a complex of natural-abundance IgG with deuterated 13C- and 15N-labeled GB1 that was fully reprotonated at exchangeable sites. For convenience, we call these samples the protonated and deuterated GB1 complexes, respectively.
To effectively take advantage of 1H detection in the solid
state, the homogeneous1H line broadening due to the presence of the strong1H−1H dipolar network must be minimized. This
can be achieved by diluting this network by replacing the majority of protons with deuterons,21by employing very high MAS frequencies (νr),22 by manipulating spin states using radiofrequency (rf) pulses,23or by using a combination of these approaches.24−26 For an optimal compromise between sensitivity and 1H resolution, the dilution of the 1H−1H network needs to be adjusted for applications at different spinning frequencies. For example, the optimal (i.e., leading to the best compromise between resolution and sensitivity) protonation at exchangeable sites was found to be 30−40% forνr< 30 kHz17,27 and 100% atνr≥ 50 kHz.25In favorable cases,νr= 40−60 kHz and high magneticfields are sufficient to obtain amide1H resolution for fully protonated proteins that is good enough for practical applications22,25,28 though still inferior to that for samples with partial deuteration under the
same conditions.25Spinning frequencies above 50 kHz are also often required for measurements of relaxation to quantify protein motions29−31 and even higher spinning frequencies improve the resolution of spectra for dense networks of proton spins. In this study, we used 1.3 mm Bruker rotors (with a sample volume of 1.7μL with glued caps and∼1.0 μL when used with silicon spacers to prevent sample dehydration) for experiments with 55−60 kHz MAS. In the final part of this article, we also show results obtained using 0.8 mm (0.7 μL sample volume) MAS instrumentation recently developed in the Samoson laboratory to reach spinning frequencies of up to 100 kHz and optimized for1H detection.32
■
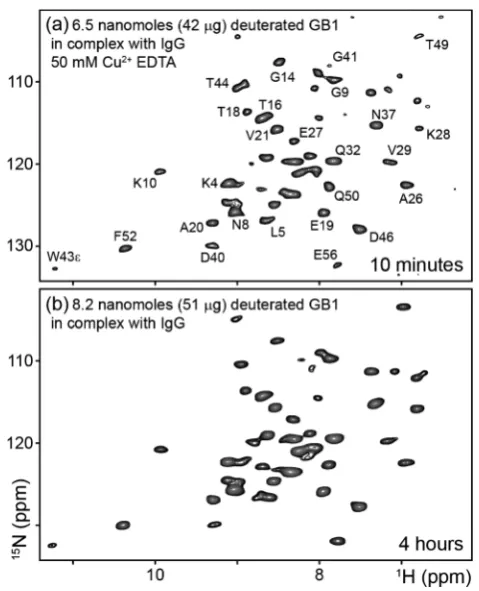
RESULTS AND DISCUSSION [image:3.625.324.564.353.649.2]We begin our investigation by considering a case where we maximized the sample volume by using a 1.3 mm rotor and employed paramagnetic doping to accelerate acquisition33and perdeuteration with 100% proton back-exchange. Spectral crowding was minimized by leaving the IgG unlabeled and observing only the 15N-labeled GB1. Despite the nanomolar-range quantity of sample in the 1.3 mm rotor, the combination of the above approaches enabled good-quality spectra for the deuterated GB1 complex to be obtained in a matter of minutes. Figure 1a shows a 1H-detected 15N−1H 2D correlation spectrum obtained on ∼1 mg of complex (containing ∼6.5
Figure 1.15N−1H 2D correlation spectra of perdeuterated 100% back-exchanged labeled GB1 in a complex with full-length unlabeled immunoglobulin G (IgG). The samples in (a) and (b) contained∼6.5 nmol (∼42 μg) and ∼8.2 nmol (∼51 μg) of GB1, respectively. Spectrum (a) was obtained in 10 min using fast recycling enabled by the addition of 50 mM CuII−EDTA. Spectrum (b) was obtained in 4 h without a paramagnetic dopant. Experiments were performed at MAS frequencies (νr) of (a) 55 and (b) 60 kHz at a1H Larmor frequency of 850 MHz and a sample temperature of 27 ± 1 °C. Selected assignments are indicated. Full assignments are provided in the SI.
Journal of the American Chemical Society Article
dx.doi.org/10.1021/ja5069992|J. Am. Chem. Soc.2014, 136, 16800−16806
nmol (∼42μg) of GB1, which is roughly an order of magnitude less than the amounts of protein used in typical solid-state NMR studies of protein complexes in the literature) in ∼10 min with fast recycling enabled by the addition of 50 mM CuII−EDTA. The 1H resonance line widths in this spectrum are in the 70−110 Hz (0.08−0.13 ppm) range, and the average signal-to-noise ratio (SNR) is 8±3 (where 3 is the standard deviation of the peak intensities). Critically, this resulting level of sensitivity places within practical reach the majority of methods in the arsenal of solid-state NMR spectroscopy for characterizing the structures and dynamics of proteins. For example, one can record≥3D spectra for de novo assignment of domains in large complexes in cases where the usual“divide and conquer” approaches4 fail to yield satisfactory results (which, as we will show below, is the case for GB1 in complex with full-length IgG). It should be noted that the approaches presented here will be applicable to many other protein complexes whose precipitates yield well-resolved spectra in addition to those that can be prepared by other means such as sedimentation or crystallization.
[image:4.625.324.565.56.386.2]Because of extensive changes in the local nuclear environ-ments, the assignments could not have been obtained by simply adjusting GB1 chemical shifts from solution or crystal data (see Figure S3 in the Supporting Information (SI)). Initial assignments were obtained using a 3D H(H)NH experiment with dipolar 1H−1H mixing, which yielded correlations for protons in close proximity. However, a significant fraction of the assignments obtained this way were ambiguous. Subsequent refinement of the assignments was achieved by carrying out a
“backbone walk” using CONH and CO(CA)NH 3D experi-ments that relied on dipolar couplings for polarization transfers. A CANH 3D spectrum was also recorded, and Cαassignments were obtained. Each 3D spectrum was obtained in 1−3 days. Example strips, 2D planes, and 1D slices from the 3D spectra are shown in Figures S7−S9 in the SI.
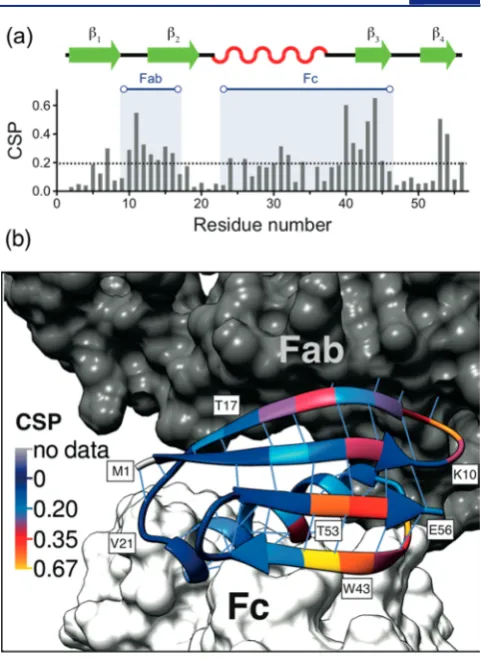
In general, at the same temperature and pH the protein chemical shifts may be altered as a result of conformational changes or direct intermolecular interactions. Insights into the nature of GB1 interactions with the full-length IgG may hence be gained by comparison of the chemical shifts of GB1 in the GB1−IgG complex with the chemical shifts of isolated GB1 in solution. Figure 2 shows the chemical shift perturbations (CSPs, calculated as [1/
2(δH2+ (δN/5)2]1/2, whereδHand δN
are the changes in chemical shift for1H and15N, respectively) between isolated GB1 in solution (i.e., in the absence of intermolecular interactions with IgG) and GB1 in a precipitated complex with IgG. The largest CSPs are observed for residues L5, L7, K10−T16, A24−Y45 (except E27, Y33, and N37), and T53−V54.
To determine whether the observed CSPs are due directly to interactions with IgG or to conformational changes induced by these interactions, it is useful to compare our results to those from studies of protein G domains in complexes with IgG fragments, for which the chemical shift changes were dominated by the effect of direct intermolecular interactions. The interactions of excised domains from protein G and fragments of (but not full-length) human and animal IgG have been investigated by both solution NMR spectroscopy and X-ray crystallography.10−12,34,35 Mapping of CSPs upon complex formation was used to identify the interaction interface of GB1 with the isolated Fc fragment of IgG (62 kDa)11and of GB2 with the isolated Fab fragment of IgG (54 kDa).12According to the cited studies, the interactions of protein G domains involve
(1) primarily the helix, theβ3strand, and the loop connecting them (corresponding to residues 23−46 in our GB1 construct; no significant CSP was observed for residues 37−38 in the cited study) for the Fc fragment and (2) the loop between theβ1and
β2 strands as well as about two-thirds of the β2 strand (corresponding to residues 9−17 in our GB1 construct; notably, in the cited study CSPs were observed for some residues outside the direct interaction interface, including residues 7, 38, and 53) for the Fab fragment. A comparison to the CSPs in Figure 2 shows that these two binding interfaces correspond to the two longest stretches of residues with the largest CSPs observed for the complex of GB1 with full-length IgG. In addition, as shown in Figures S4−S6 in the SI, in spite of being recorded under relatively different conditions, the chemical shifts for the sites involved in binding to the Fc and Fab fragments are very similar for GB1 in the complex with IgG and with its appropriate fragments. These remarkable similarities suggest that the changes in chemical shifts between isolated GB1 and GB1 in complex with IgG are primarily due to direct interactions of GB1 with Fc and Fab of IgG, analogous to those observed for the complexes with the fragments in solution. Notably, resonances from the Fab-binding interface are not shifted in the spectra of GB1 in complex with the Fc fragment, and resonances from the Fc-binding interface are not
shifted in the spectra of GB2 in complex with Fab (see Figure S6 in the SI). On the other hand, both the Fab-binding and Fc-binding sites are shifted in the GB1 complex with full-length IgG, suggesting that the observed changes are likely due to multiple-site binding rather than conformational changes at one interface induced by a direct interaction at another. Further evidence of the lack of substantial conformational change taking place upon formation of the GB1−IgG complex comes from the similarities of the Cα secondary chemical shifts between isolated GB1 and GB1 in the complex with IgG (see Figure S10 in the SI).
The cross-peaks for residues G9−T18 and A26−T44 in the GB1−IgG complex are generally also significantly attenuated compared with the peaks having the smallest CSPs (see Figure S11 in the SI), which is consistent with these residues being in direct contact with the fully protonated IgG, causing increased dipolar broadening. Moreover, the attenuation may indicate the presence of slow motions for the interacting residues, which are also suggested by the spinning-frequency dependence of a number of the cross-peak intensities (see below).
There is, however, some indication of the presence of small, localized conformational changes outside of the interaction interfaces. In particular, L5, L7, T53, and V54 are residues that are outside of the contiguous interaction interfaces but have large CSPs. Since similar CSPs are observed in the solution spectra of GB2 in complex with the Fab fragment,12we can identify this particular interaction as the cause for the slight conformational change. We suggest that the large CSPs may be associated with modulation of the hydrogen bonds between strandsβ1 andβ4 near the C-terminus, which occurs on a long time scale and is also present in crystalline GB1 (as indicated by elevated 15N R
1ρ measurements30). Such an interpretation is
consistent with these residues being involved in thefinal steps of the GB1 folding pathway.36
The presence of a single set of relatively narrow resonances, with chemical shift changes for both GB1 binding interfaces, suggests that the most abundant species in the sample involves each molecule of GB1 interacting simultaneously through its Fc- and Fab-binding interfaces. In the case of one set of GB1 molecules binding to Fc and another set binding to Fab, one would expect to observe, for each binding interface, two sets of resonances for GB1: one set for those resonances involved in a direct interaction with IgG and one set for those not involved. A similar principle was used, for example, to identify supramolecular structures in amyloid fibrils.37,38 Crude modeling using crystal structures of GB1-like molecules in complexes with IgG fragments and the crystal structure of full-length IgG suggests that it is sterically possible for GB1 to interact simultaneously with one molecule of IgG through the Fc interface and another molecule of IgG through the Fab interface (see Figure S11 in the SI).10,35,39 Alternatively, the Fab-binding interface could be involved in hydrogen bonding with another molecule of GB1 as in crystals of the C2−Fc complex,35 though neither the absence of a E15−K13 cross-peak in the 3D H(H)NH spectrum nor the similarity of the CSPs for the GB2−Fab complex in solution12supports this. In either case, the resulting complex would be at least 300 kDa. The concentration of GB1 remaining in the supernatant after precipitation of the complex suggests that the complex is formed in a 1:1 or lower ratio of GB1 to IgG. In all of our calculations, we have assumed a 1:1 ratio.
The abovefindings suggest that changes in chemical shifts in complexes in the solid state compared with those in constituent
proteins free in solution may be used to identify interacting protein−protein interfaces, in analogy to chemical shift mapping during titration experiments in solution. This approach should be particularly valuable for mapping out interactions in complexes with low solubility.
The exceptionally reasonable durations of the experiments presented so far were largely possible because of the acceleration of acquisition by paramagnetic doping. While this strategy is suitable for structural applications (and some dynamics applications, e.g., measurements of dipolar order parameters40), paramagnetic relaxation, which is dependent primarily on the distance of a given site from the paramagnetic center and on the electron relaxation, may mask the contributions of local motions to NMR relaxation. Experiments aiming to characterize protein dynamics using NMR relaxation therefore often require measurements in the absence of paramagnetic dopants. Figure 1b illustrates that even without dopants, spectra with SNR suitable for quantitative measure-ments (average SNR = 30±12) can be obtained in a few hours for the perdeuterated GB1 complex (4 h). This indicates that it is practically feasible to obtain a full series of spectra for quantification of protein dynamics by relaxation with experi-ment times on the order of a few days in the case of15NR
1ρ
measurements30 or a few weeks in the case of 15N R1
measurements.41
In thefinal part of this article, we consider extensions of the presented experimental approach to more challenging cases of even smaller samples and fully protonated systems. First, we consider the possibility of employing similar experiments at higher spinning frequencies of up to 100 kHz. Because smaller-diameter rotors are required to achieve these higher spinning frequencies, the available sample volumes also tend to be smaller (e.g., 0.7μL for a 0.8 mm rotor vs 1.7μL for a 1.3 mm rotor). However, there are several potential advantages that render the≥70 kHz spinning regime attractive, including, for example, improved suppression of spin diffusion effects,31 improved coherence lifetimes,25and benefits for applications to paramagnetic systems.42 Above all, 1H detection in fully protonated systems should be aided by more effective removal of strong dipolar1H−1H couplings under such conditions.
Since the sensitivity depends on factors other than just sample volume,43 it is useful to compare the sensitivities of actual experiments. In particular, smaller receiver coils usually lead to better SNR per unit mass,44 which could potentially make smaller rotors at higher spinning frequencies more desirable for sample-size-limited applications.
Figure 3a shows a spectrum obtained at 97.5 kHz MAS on perdeuterated GB1 in complex with IgG, containing∼3.1 nmol (∼20μg) of GB1 and 100 mM CuII−EDTA. Figure 3b shows a spectrum of a similar sample without paramagnetic doping. The experimental durations for these spectra were (a) ∼1.7 h and (b)∼12 h (with average cross-peak SNRs of 13±4 and 9±3 respectively), indicating that with a 0.8 mm rotor at∼100 kHz MAS, one can use the same approach as with the larger 1.3 mm rotor. Interestingly, some of the cross-peaks for the residues at and near the interacting interfaces (e.g., K10 and T18) appear attenuated at∼100 kHz MAS (∼10μs rotor period) compared with 60 kHz MAS (16.7 μs rotor period), suggesting the presence of slow (submicrosecond) motions that interfere more effectively with the averaging at faster MAS. On the other hand, the intensities of other cross-peaks (e.g., G41) are enhanced at∼100 kHz compared with 60 kHz.
Journal of the American Chemical Society Article
dx.doi.org/10.1021/ja5069992|J. Am. Chem. Soc.2014, 136, 16800−16806
Throughout all of the above experiments, we made use of sample deuteration as a means to dilute the dense proton network within the protein and hence narrow the proton line widths. Ideally, however, because of simplicity and cost considerations, one would like to be able to perform measurements on fully protonated proteins. As was previously demonstrated, 1H resolution improves as a function of both
spinning frequency and magnetic field.22,25 To explore the potential improvements in 1H resolution for fully protonated
samples that can be achieved by combining the effects of faster spinning, higher magnetic field, and appropriate labeling, we
first performed experiments on fully protonated crystalline GB1, which is often used as a“best-case scenario” benchmark for the resolution and sensitivity available in solid-state NMR experiments. Figure 4 compares expansions from 1H-detected 1H−13C 2D spectra of (a) [U-13C,15N]GB1 atνr= 60 kHz on a
600 MHz spectrometer and (b) [1,3-13C,15N]GB1 atνr = 100 kHz on a 850 MHz spectrometer. A clear improvement in resolution at the higher field and spinning frequency can be
seen. The average aliphatic 1H line width for the improved spectrum in Figure 4b is 155±42 Hz (0.18±0.05 ppm) (the peak overlap in Figure 4a prohibited reliable measurement of the average1H line width).
Encouraged by the results in Figure 4, we applied a similar approach to the complex of GB1 with IgG. Figure 3c shows a
15N−1H 2D correlation spectrum of fully protonated GB1
complex with IgG obtained at 100 kHz MAS. This spectrum contains most of the cross-peaks present in the spectrum of the deuterated GB1 complex but with additional 30−50 Hz broadening for the visible 1H resonances. A few cross-peaks
in the spectrum of fully protonated GB1 complex are broadened beyond detection. The observation of narrow 1H
resonances in crystalline GB1 under the same conditions as well as in the perdeuterated complex suggests that this additional broadening may be homogeneous in nature and related to incoherent effects of molecular motions rather than coherent effects from incompletely averaged 1H−1H dipolar couplings. In a fully protonated sample and in the presence of sufficiently slow motions, even small-amplitude fluctuations of 1H−1H dipolar couplings between amide and aliphatic protons can result in a non-negligible contribution to 1H T2 and
consequently a broader1H line width. In a deuterated sample, the main1H−1H dipolar relaxation comes from the modulation
of weaker amide−amide couplings, resulting in a significant attenuation of this effect. The presence of more prominent slow motions in the complex compared with our model crystalline sample of GB1 is corroborated by the∼4 times larger bulk15N
R1ρ rates30 measured, under the same conditions, in the complex compared with the crystal. Consequently, not only coherent averaging of1H−1H dipolar couplings but also system
[image:6.625.327.564.62.266.2]dynamics are factors that should be taken into account when the feasibility of 1H-detected experiments in proteins is considered. Obviously, this factor will be strongly system-dependent.
Figure 3. 15N−1H 2D correlation spectra of labeled (a, b) perdeuterated and (c) fully protonated GB1 in complexes with unlabeled full-length IgG obtained using a 0.8 mm rotor. Conditions:
(a)∼3.1 nmol (20μg) of GB1 atνr= 97.5 kHz; (b)∼3.1 nmol (20
μg) of GB1 atνr= 95 kHz; (c)∼2 nmol (13μg) of GB1 atνr= 100 kHz. The sample in (a) also contained 100 mM CuII−EDTA to enable faster recycling. Total experimental times for (a−c) were∼1.7,∼12,
and∼40 h, respectively. All of the experiments were performed at a1H
[image:6.625.77.282.68.427.2]Larmor frequency of 850 MHz and a sample temperature of 27±1 °C.
Figure 4.Expansions from 13C−1H 2D correlation spectra obtained on (a) fully protonated [U-13C,15N]GB1 atν
r= 60 kHz with a 600 MHz spectrometer and (b) [1,3-13C,15N]GB1 atν
■
CONCLUSIONSWe have shown that1H detection at 50−100 kHz magic-angle spinning enables site-specific characterization of domains in >300 kDa complexes in sample quantities as small as 2 nmol with experimental time scales on the order of minutes to hours for 2D experiments. In the case of the GB1−IgG complex, the resolution of spectra of the precipitated complex rivals that of microcrystalline proteins. While 100 kHz MAS facilitates studies on fully protonated proteins, deuterated (fully reprotonated at exchangeable sites) samples can be used already at 50−60 kHz MAS. Comparison of the chemical shifts for constituent proteins in solution to the chemical shifts for the proteins in complexes in the solid state allows the protein− protein interaction interfaces to be mapped out, in analogy to solution-state chemical shift mapping experiments. The presented approach enables quantitative structural and dynamics measurements to be performed on sample-size-limited systems such as proteins in large complexes or membrane proteins in lipid bilayers, which are often beyond the reach of other structural biology methods.
■
EXPERIMENTAL SECTION[13C,15N]-labeled GB1 (T2Q) was produced as described previously.45 Deuterated [13C,15N]-labeled GB1 (T2Q) was expressed inEscherichia coli BL21(DE3) after one cycle of adaptation to D2O in a 50 mL preculture. The production was carried out in a 3.6 L fermenter using 1 L of D2O M9 minimal medium with 6 g of13C-glucose and 1.5 g of 15NH
4Cl. Thefinal yield after cell rupture by heating to 75°C and HPLC purification (reversed-phase HPLC column, Jupiter 10 mm C4 300 Å) was 152 mg. The level of deuteration was about 87%, as estimated from solution-state 1D NMR spectra. After lyophilization, thefinal buffer (10 mL) was adjusted by dialysis against 4×1 L 50 mM sodium phosphate (pH 5.5). Lyophilized IgG from human serum was purchased from Sigma-Aldrich. Complex samples were prepared for solid-state NMR experiments by mixing 0.3 mM GB1 and 0.15 mM IgG solutions (2:1 molar ratio) and centrifuging the resultant precipitate into NMR rotors.
All of the solid-state NMR spectra shown were recorded at a 1H Larmor frequency of 850 MHz with a Bruker Avance III spectrometer (except for the spectrum in Figure 4a, which was recorded using a Bruker Avance II+ spectrometer running at a1H Larmor frequency of 600 MHz) with either a Bruker 1.3 mm triple-resonance probe (for experiments at 60 kHz MAS) or a 0.8 mm double-resonance probe developed in the Samoson laboratory (for experiments at 95−100 kHz MAS). Either the 1.3 mm rotors were sealed with silicone spacers (Bruker) or the rotor caps were sealed with a silicone-based glue to eliminate water leakage, and a Bruker BCU-X cooling unit was used to regulate the internal sample temperature to 27±1°C (measured from the chemical shift of water with respect to DSS; a Bruker macro for calibrating the sample temperature can be downloaded from the authors’ Web site: http://www2.warwick.ac.uk/fac/sci/chemistry/ research/lewandowski/lewandowskigroup/goodies/). For the 1.3 mm probe at 600 MHz, these conditions were achieved by using a nitrogen gasflow of 670−800 L/h with a target temperature of−7 to −9 °C. For the 1.3 mm probe at 850 MHz, these conditions were achieved by using aflow of 935−1470 L/h with a target temperature of−5 to−7°C. For the 0.8 mm probe at 850 MHz, these conditions were achieved with 670−1070 L/h flow. The required flow was ultimately dependent on the precise pressures required to spin the rotors (which varied slightly from sample to sample) and the quality of seal that could be achieved between the VT gas transfer line and the probe.
15N−1H and13C−1H 2D correlation spectra were recorded using a
proton-detected heteronuclear correlation sequence. The double-quantum cross-polarization (CP) contact times were 1 ms (1H−15N) and 0.4 ms (15N−1H) and 1 ms (1H−13C) and 0.2 ms (13C−1H). The total durations of these experiments were 10 min (Figure 1a; 60t1
increments, recycle delay of 0.4 s),∼4 h (Figure 1b; 74t1increments, recycle delay of 2 s),∼1.7 h (Figure 2a; 72t1increments, recycle delay of 0.5 s),∼12 h (Figure 3b; 60t1increments, recycle delay of 1.5 s), and∼40 h (Figure 3c; 30t1increments, recycle delay of 2 s).
GB1 resonances were assigned on the basis of 3D H(H)NH, CONH, CO(CA)NH, and CANH experiments recorded on the sample whose15N−1H spectrum is shown in Figure 1a at1H Larmor frequencies of 600 and 850 MHz and at 60 kHz MAS. For each of these 3D experiments, the CP contact times were 1.4−1.8 ms for initial 1H−15N/1H−13C transfers and 700 μs for final 15N−1H transfers. In the H(H)NH experiment, 2.7 ms of 100 kHz RFDR46 1H−1H mixing was used to establish inter-residue contacts between
neighboring HN protons via dipolar couplings. In the triple-channel experiments, transfers from 13C′/13Cα to15N were achieved by CP with a contact time of 10 ms. In the CO(CA)NH experiment, polarization was transferred from13C′to13Cαby dipolar couplings with a 10 ms DREAM step (30 kHz nutation frequency).47For all of the 3D experiments, the recycle delay was set to 0.4 s, leading to total experiment times of ∼36 h (H(H)NH), ∼23 h (CONH), ∼65 h (CO(CA)NH), and∼13 h (CANH).
In all of the solid-state experiments, hard pulses were applied at nutation frequencies of 100 kHz (1H and13C) and 83.3 kHz (15N). WALTZ-16 heteronuclear decoupling at 10 kHz was applied to1H during 15N/13C evolution and to 15N during direct 1H acquisition, while quadrature detection was achieved using the States-TPPI method. Suppression of the water signal was achieved by saturation with 200 ms of slpTPPM1H decoupling31applied at an amplitude of one-fourth of the MAS frequency on resonance with the water signal. slpTPPM involves a sweep through a low-power TPPM condition48 with the lengths of the pulses changed from 120% to 80% of the referenceπpulse, alternating the phases of the pulses between 0°and 41°. The Bruker cpd program for slpTPPM can be downloaded from the authors’Web site.
A solution 15N HSQC spectrum of [2H,13C,15N]GB1 in 50 mM sodium phosphate buffer (pH 5.5) was recorded at a 1H Larmor frequency of 600 MHz and a sample temperature of 30°C.
All of the spectra were processed using TopSpin 3.2 or NMRPipe and subsequently assigned in Sparky.
■
ASSOCIATED CONTENT*
S Supporting Information1H and 15N assignments of GB1 in a complex with IgG.
Solution 2D 15N HSQC spectrum. Comparisons of the
chemical shifts for GB1 in the precipitated complex with IgG to those for GB1 free in solution and crystalline GB1 and protein G domains in complexes with Fc and Fab fragments in solution. Example strips, 2D planes, and 1D slices from 3D spectra used for assignment. Comparison of Cα secondary chemical shifts for GB1 free in solution and in the complex with IgG. SNR as a function of residue. Simple modeling of the GB1−IgG complex based on the existing crystal structures of fragments. This material is available free of charge via the Internet at http://pubs.acs.org.
■
AUTHOR INFORMATIONCorresponding Authors
[email protected] [email protected] [email protected]
Notes
The authors declare no competingfinancial interest.
■
ACKNOWLEDGMENTSWe thank David Osen and Frank Engelke from Bruker Biospin for providing spacers for 1.3 mm rotors. This work was supported by Royal Society Grant RG130022 and EPSRC
Journal of the American Chemical Society Article
dx.doi.org/10.1021/ja5069992|J. Am. Chem. Soc.2014, 136, 16800−16806
Grant EP/L025906/1 (to J.R.L.), an Estonian Science Foundation and Agency grant (to A.S.), and Swiss National Science Foundation Grants 31-109712 and 31-132857 (to S.G.). The UK 850 MHz Solid-State NMR Facility used in this research was funded by EPSRC and BBSRC as well as the University of Warwick, including via partial funding through Birmingham Science City Advanced Materials Projects 1 and 2 supported by Advantage West Midlands (AWM) and the European Regional Development Fund (ERDF).
■
REFERENCES(1) Ban, N.; Nissen, P.; Hansen, J.; Moore, P. B.; Steitz, T. A.Science
2000,289, 905.
(2) Garman, E. F.Science2014,343, 1102.
(3) Leibundgut, M.; Maier, T.; Jenni, S.; Ban, N.Curr. Opin. Struct. Biol.2008,18, 714.
(4) Frueh, D. P.; Goodrich, A. C.; Mishra, S. H.; Nichols, S. R.Curr. Opin. Struct. Biol.2013,23, 734.
(5) Zuiderweg, E. R.Biochemistry2002,41, 1.
(6) Han, Y.; Ahn, J.; Concel, J.; Byeon, I.-J. L.; Gronenborn, A. M.; Yang, J.; Polenova, T.J. Am. Chem. Soc.2010,132, 1976.
(7) Loquet, A.; Sgourakis, N. G.; Gupta, R.; Giller, K.; Riedel, D.; Goosmann, C.; Griesinger, C.; Kolbe, M.; Baker, D.; Becker, S.; Lange, A.Nature2012,486, 276.
(8) Carter, P. J.Exp. Cell Res.2011,317, 1261.
(9) Stone, G. C.; Sjöbring, U.; Björck, L.; Sjöquist, J.; Barber, C. V.; Nardella, F. A.J. Immunol.1989,143, 565.
(10) Derrick, J. P.; Wigley, D.Nature1992,359, 752.
(11) Gronenborn, A. M.; Clore, G. M.J. Mol. Biol.1993,233, 331. (12) Lian, L.-Y.; Barsukov, I. L.; Derrick, J. P.; Roberts, G. C.Nat. Struct. Mol. Biol.1994,1, 355.
(13) Bertini, I.; Luchinat, C.; Parigi, G.; Ravera, E.; Reif, B.; Turano, P.Proc. Natl. Acad. Sci. U.S.A.2011,108, 10396.
(14) Mainz, A.; Bardiaux, B.; Kuppler, F.; Multhaup, G.; Felli, I. C.; Pierattelli, R.; Reif, B.J. Biol. Chem.2012,287, 1128.
(15) Mainz, A.; Jehle, S.; van Rossum, B. J.; Oschkinat, H.; Reif, B.J. Am. Chem. Soc.2009,131, 15968.
(16) Gardiennet, C.; Schütz, A. K.; Hunkeler, A.; Kunert, B.; Terradot, L.; Böckmann, A.; Meier, B. H.Angew. Chem., Int. Ed.2012,
51, 7855.
(17) Mainz, A.; Religa, T. L.; Sprangers, R.; Linser, R.; Kay, L. E.; Reif, B.Angew. Chem., Int. Ed.2013,52, 8746.
(18) Gelis, I.; Vitzthum, V.; Dhimole, N.; Caporini, M. A.; Schedlbauer, A.; Carnevale, D.; Connell, S. R.; Fucini, P.; Bodenhausen, G.J. Biomol. NMR2013,56, 85.
(19) Lewandowski, J. R.; Halse, M. H.; Blackledge, M.; Emsley, L. Submitted 2014.
(20) Ishii, Y.; Tycko, R.J. Magn. Reson.2000,142, 199.
(21) Hologne, M.; Chevelkov, V.; Reif, B.Prog. Nucl. Magn. Reson. Spectrosc.2006,48, 211.
(22) Zhou, D. H.; Shah, G.; Cormos, M.; Mullen, C.; Sandoz, D.; Rienstra, C. M.J. Am. Chem. Soc.2007,129, 11791.
(23) Paul, S.; Madhu, P.J. Indian Inst. Sci.2010,90, 69.
(24) Asami, S.; Szekely, K.; Schanda, P.; Meier, B. H.; Reif, B.J. Biomol. NMR2012,54, 155.
(25) Lewandowski, J. R.; Dumez, J. N.; Akbey, U.; Lange, S.; Emsley, L.; Oschkinat, H.J. Chem. Phys. Lett.2011,2, 2205.
(26) Ward, M. E.; Wang, S. L.; Krishnamurthy, S.; Hutchins, H.; Fey, M.; Brown, L. S.; Ladizhansky, V.J. Biomol. NMR2014,58, 37.
(27) Akbey, U.; Lange, S.; Franks, W. T.; Linser, R.; Rehbein, K.; Diehl, A.; van Rossum, B. J.; Reif, B.; Oschkinat, H.J. Biomol. NMR
2010,46, 67.
(28) Marchetti, A.; Jehle, S.; Felletti, M.; Knight, M. J.; Wang, Y.; Xu, Z. Q.; Park, A. Y.; Otting, G.; Lesage, A.; Emsley, L.; Dixon, N. E.; Pintacuda, G.Angew. Chem., Int. Ed.2012,51, 10756.
(29) Lewandowski, J. R.Acc. Chem. Res.2013,46, 2018.
(30) Lewandowski, J. R.; Sass, H. J.; Grzesiek, S.; Blackledge, M.; Emsley, L.J. Am. Chem. Soc.2011,133, 16762.
(31) Lewandowski, J. R.; Sein, J.; Sass, H. J.; Grzesiek, S.; Blackledge, M.; Emsley, L.J. Am. Chem. Soc.2010,132, 8252.
(32) Samoson, A. Presented at EUROMAR 2012, Dublin, Ireland, July 1−5, 2012.
(33) Wickramasinghe, N. P.; Parthasarathy, S.; Jones, C. R.; Bhardwaj, C.; Long, F.; Kotecha, M.; Mehboob, S.; Fung, L. W. M.; Past, J.; Samoson, A.; Ishii, Y.Nat. Methods2009,6, 215.
(34) Kato, K.; Lian, L.; Barsukov, I.; Derrick, J. P.Structure1995,3, 79.
(35) Sauereriksson, A. E.; Kleywegt, G. J.; Uhl, M.; Jones, T. A.
Structure1995,3, 265.
(36) Kmiecik, S.; Kolinski, A.Biophys. J.2008,94, 726.
(37) Lewandowski, J. R.; van der Wel, P. C. A.; Rigney, M.; Grigorieff, N.; Griffin, R. G.J. Am. Chem. Soc.2011,133, 14686.
(38) Nielsen, J. T.; Bjerring, M.; Jeppesen, M. D.; Pedersen, R. O.; Pedersen, J. M.; Hein, K. L.; Vosegaard, T.; Skrydstrup, T.; Otzen, D. E.; Nielsen, N. C.Angew. Chem., Int. Ed.2009,48, 2118.
(39) Harris, L. J.; Skaletsky, E.; McPherson, A.J. Mol. Biol.1998,275, 861.
(40) Chevelkov, V.; Fink, U.; Reif, B.J. Am. Chem. Soc.2009,131, 14018.
(41) Giraud, N.; Blackledge, M.; Goldman, M.; Bockmann, A.; Lesage, A.; Penin, F.; Emsley, L.J. Am. Chem. Soc.2005,127, 18190. (42) Bertini, I.; Emsley, L.; Lelli, M.; Luchinat, C.; Mao, J.; Pintacuda, G.J. Am. Chem. Soc.2010,132, 5558.
(43) Demers, J.-P.; Chevelkov, V.; Lange, A.Solid State Nucl. Magn. Reson.2011,40, 101.
(44) Sakellariou, D.; Le Goff, G.; Jacquinot, J.-F.Nature2007,447, 694.
(45) Franks, W. T.; Zhou, D. H.; Wylie, B. J.; Money, B. G.; Graesser, D. T.; Frericks, H. L.; Sahota, G.; Rienstra, C. M.J. Am. Chem. Soc.
2005,127, 12291.
(46) Gullion, T.; Schaefer, J.J. Magn. Reson.1989,81, 196. (47) Verel, R.; Baldus, M.; Ernst, M.; Meier, B. H.Chem. Phys. Lett.
1998,287, 421.
![Figure 4. Expansions fromon (a) fully protonated [U-850 MHz spectrometer. The spectrum in (b) was obtained in 2.6 h on∼ 13C−1H 2D correlation spectra obtained13C,15N]GB1 at νr = 60 kHz with a 600MHz spectrometer and (b) [1,3-13C,15N]GB1 at νr = 100 kHz wit](https://thumb-us.123doks.com/thumbv2/123dok_us/9542412.459129/6.625.77.282.68.427/expansions-protonated-spectrometer-spectrum-obtained-correlation-obtained-spectrometer.webp)
