Abstract— The spatio-temporal modelling and forecasting of incidences of crimes have now become a routine part of crime prevention operations. However, obtaining reliable forecasts for cases of changing spatial boundaries using models which take the influences of exogenous factors on the spatial and temporal dynamics of crime into account remains a challenge. The proposed Dynamic Spatial Distribution Approach (DSDA) is a modelling approach that provides spatio-temporal forecasts that incorporate the influences of salient weather conditions that have a bearing on crime dynamics at both the temporal and spatial levels. The DSDA starts with modelling and forecasting the dataset of the entire area of interest as a whole. Given reliable forecasts, the DSDA spatially disaggregates them by extrapolating the spatial patterns identified from the historic data. This is carried out by firstly identifying the spatial pattern and then defining a set of weights, one for each of the clusters making up this pattern. A number of methods to determining these weights, including a benchmark, univariate and causal approaches are proposed. The DSDA was developed within a GIS and classical statistics environment. Applied to the daily number of criminal damage incidences in the City of Cardiff, UK, the DSDA yielded a city-wide forecast error of 3.51 crimes per day. The spatial disaggregation using weights identified using Least Squares estimates of expected crime percentages in each cluster yielded an average of 1.1240 crimes per day per cluster. The model used incorporated the influences of weekdays and ambient conditions on the spatial distribution of crime
Index Terms— Geographical Information System (GIS), Spatial disaggregation, Spatio-Temporal forecasting model.
I. INTRODUCTION
The main purpose of the implementation of the Dynamic Spatial Disaggregation Approach (DSDA) is to provide the Police Crime Prevention Unit of South Wales Police with an elaborate spatio-temporal crime forecasting model to aid in optimising the use of their resources. In comparison with established approaches in spatio-temporal forecasting (see, for example, [1-3]), DSDA incorporates exogenous information both at the temporal and spatial level of its implementation. In addition, with DSDA, the temporal forecast of crime was
1 Faculty of Advanced Technology, University of Glamorgan, UK, CF37
1DL.E-mail: [email protected]
2 Senior Lecturer in the Faculty of Advanced Technology, University of Glamorgan, UK, CF37 1DL. E-mail: [email protected]
3 Professor in the Faculty of Advanced Technology, University of
Glamorgan, UK, CF37 1DL.E-mail: [email protected]
4 Professor in the Faculty of Advanced Technology, University of
Glamorgan, UK, CF37 1DL.E-mail: [email protected]
produced using the entire city as opposed to modelling each set of identified cluster independently, as demonstrated in [4] for example. DSDA therefore offers major improvements on existing approaches since modelling the clusters independently ignores the evolution in the spatial distribution of the data over time and it is liable to produce datasets in which the scales and variability are too limited for reliable forecasts to be produced. The forecasting method used in this project was the Hierarchical Profiling Approach (HPA) which was demonstrated to provide superior forecasting results in time series, and in crime specifically, compared to traditional approaches as discussed in [5]. The crime data utilised in this paper enclose the criminal damage incidences in the City of Cardiff, with spatial (x, y) coordinates and time of occurrence of the assaults.
DSDA is a generalisation of the Simple Spatial Disaggregation Approach (SSDA) which was developed in [6]. SSDA is constructed within a GIS environment, and uses STAC as the cluster detection routine technique. STAC, using an ellipsoid-shaped cluster algorithm, offers the main advantage of calculating clusters without being restricted to any set boundaries. This way, whilst SSDA is only concerned with spatial patterns purely based upon calendar events, DSDA also includes weather parameters in its spatio-temporal implementation.
In this paper, SSDA will be briefly introduced in Section III to provide the grounds for understanding the basis of this approach. Then DSDA is detailed in Section IV, followed by Conclusion and Future Work in Section V.
The next section gives an overview of the HPA and its application in modelling the Criminal Damage time series.
II.CRIME MODELLING OF CARDIFF
A.An Overview of HPA
Profiling, which identifies and models the change of behaviour of a times series during distinct periodic and aperiodic events, matches the observed level shifts in the data to events salient to the time series. HPA decomposes variability in time series data into three components: deterministic, stochastic and noise. Based on this, the general form of the HPA model is
( )
t t
y
=
f t
+
Z
, (1)where
f t
( )
is the deterministic profile function and Zt is theThe Dynamic Spatial Disaggregation Approach:
A Spatio-Temporal Modelling of Crime
stochastic component, containing the noise, to be modelled. The HPA combines different profiling levels hierarchically in its application. For the Criminal Damage data, this was carried out as follows: Level 1: This level modelled level shifts and salient profiled events that occur within the year, as displayed in Table 1, and Level 2 was used to model the general shape of the series all year round, including trend, seasonality and other periodic disturbances.
B.Concluding Model
The stochastic Zt series was modelled using ARIMA
(2,0,2)(2,0,0) as follows
(
)(
)
(
)
7 14 2
2
1 0.146 0.108 1 1.488 0.812
1 1.420 0.803 , (2)
t
t
B B B B Z
B B e
− − − + =
− +
Hence, the one step-ahead forecasts, yt(1)were obtained by aggregating the profiles back into the stochastic forecasts as
1
(1)
( )
1(1)
t t
y
−=
f t
+
Z
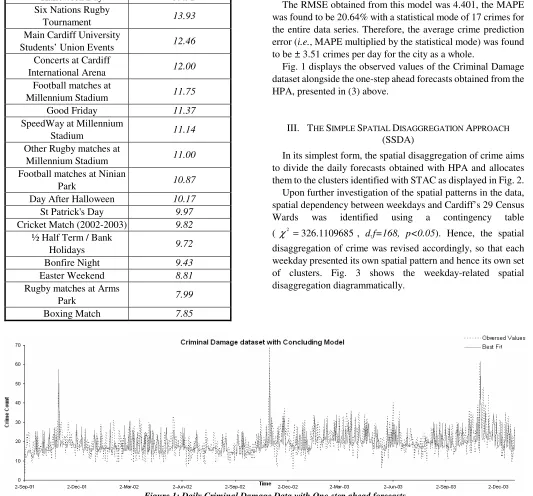
− (3) [image:2.612.41.574.233.729.2]The RMSE obtained from this model was 4.401, the MAPE was found to be 20.64% with a statistical mode of 17 crimes for the entire data series. Therefore, the average crime prediction error (i.e., MAPE multiplied by the statistical mode) was found to be ± 3.51 crimes per day for the city as a whole.
Fig. 1 displays the observed values of the Criminal Damage dataset alongside the one-step ahead forecasts obtained from the HPA, presented in (3) above.
III. THE SIMPLE SPATIAL DISAGGREGATION APPROACH (SSDA)
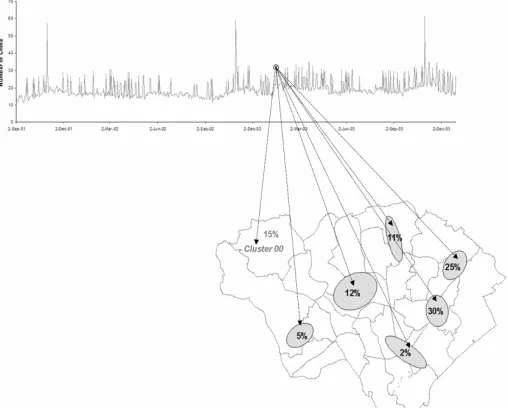
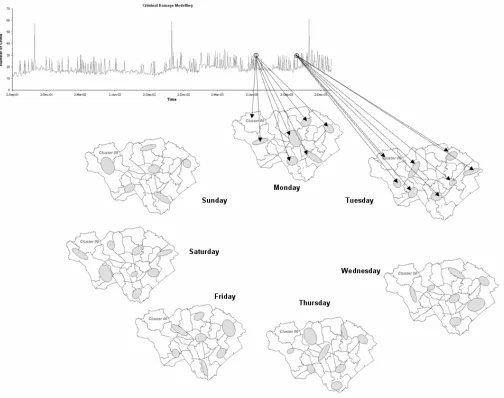
In its simplest form, the spatial disaggregation of crime aims to divide the daily forecasts obtained with HPA and allocates them to the clusters identified with STAC as displayed in Fig. 2. Upon further investigation of the spatial patterns in the data, spatial dependency between weekdays and Cardiff’s 29 Census Wards was identified using a contingency table
( χ =2 326.1109685, d.f=168, p<0.05). Hence, the spatial disaggregation of crime was revised accordingly, so that each weekday presented its own spatial pattern and hence its own set of clusters. Fig. 3 shows the weekday-related spatial disaggregation diagrammatically.
Events Criminal Damage Profiles
Halloween Day 39.92
Six Nations Rugby
Tournament 13.93
Main Cardiff University
Students’ Union Events 12.46
Concerts at Cardiff
International Arena 12.00
Football matches at
Millennium Stadium 11.75
Good Friday 11.37
SpeedWay at Millennium
Stadium 11.14
Other Rugby matches at
Millennium Stadium 11.00
Football matches at Ninian
Park 10.87
Day After Halloween 10.17
St Patrick's Day 9.97
Cricket Match (2002-2003) 9.82
½ Half Term / Bank
Holidays 9.72
Bonfire Night 9.43
Easter Weekend 8.81
Rugby matches at Arms
Park 7.99
Boxing Match 7.85
Figure 2: Illustration of Spatial Disaggregation on Cardiff City
Table 2: STMRSE for SSDA
In order to incorporate the spatial dimension into forecast evaluations, the novel Spatio-Temporal Mean Root Square Estimate (STMRSE) was developed to evaluate the spatio-temporal forecast errors. The STMRSE is written as follows
( )
(
)
2
1 t t j t j
t j t
m
n O O
STMRSE n m ε − =
∑ ∑
, (4)
with n being the total number of days ∀t,
O
t j being the crime forecast for cluster j at day t and mt the total number of clusters at day t.In order to calculate the proportions of the forecast to be allocated to each cluster, a set of weights was defined so that the forecast for each cluster,
O
t j, is obtained from1(1)
, 1
t
t j t j t j
j t
y
O with
m
β − β
∀
= ∗
∑
= , (5)where β are the Spatial Disaggregation Forecast (SDF) weights.
Four methods to identify suitable SDF weights were implemented to obtain the crime forecasts
O
t j. These are:The Naïve Forecasting Method (NFM)
NFM uses past values to predict future weekday-related values, so that the SDF weights of, say, Monday of week (n+1) will be those of Monday of the week before (i.e., week n). The
NFM is non trivial and provides a benchmark for the other methods inspected in this work.
The Ordinary Least Square method on Number of Incidences (OLS-NI)
Regression analysis was performed on the Number of Incidences per cluster per weekday so that the number of incidences per cluster on a, say, Monday was treated as a series within each cluster. Therefore, each cluster, per weekday, was allocated with a Least Square Fit from which an estimate of expected number of future crimes is obtained. With the sum of the estimates set to 100%, the SDF weight for each cluster is set to be equal to the percentage of the cluster’s least squares estimate to the total.
The Arithmetic Mean (AM)
In this method, the SDF weights were set to be equal to the AM of the Percentages of the overall Incidences per cluster per weekday
The Ordinary Least Square method on Percentages of Crime (OLS-PC)
[image:3.612.79.296.404.449.2]OLS was used on the daily percentages of crime occurrences per cluster. Regression analysis allowed the implementation of Least Square Fits for all clusters per weekday as previously introduced in the OLS-NI measure with the SDF weights set to be equal to the estimates of the percentages of crimes obtained from the OLS fit of the regression line.
Table 2 displays the STMRSE results calculated using (4) for the four SDF weights estimation methods used in disaggregating the forecasts within SSDA.
It can be seen from Table 2 that OLS-NI was superior, with STMRSE of 1.131 crimes per weekday per cluster followed closely by OLS-PC and AM.
IV. THE DYNAMIC SPATIAL DISAGGREGATION APPROACH (DSDA)
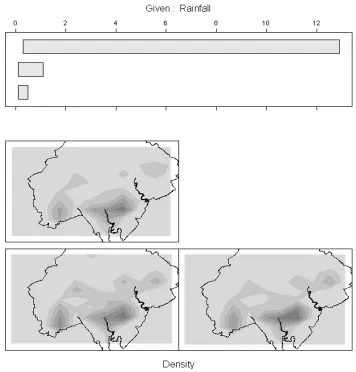
DSDA generalises the idea of SSDA to the inclusion of exogenous variables in the disaggregation of forecasts so that spatial patterns can be allowed to vary in response of exogenous salient variables. The exploratory data analysis revealed that Rainfall influences the spatial dynamics of crime in such a way that shifts of clusters, emergence of new clusters and diminution of criminal activities within identified clusters would be observed. Comap, introduced by [7], was utilized to identify the extent of the influence of ambient conditions on Cardiff City. Comap is based on conditional plotting (i.e., Coplot) and Kernel Density Estimation procedures (i.e., Kernmap). Fig. 4 displays NFM OLS-NI AM OLS-PC
the conditional distribution of crime at different levels of Rainfall, with the same sampling size in each drawn panel.
In this simple case, no evidence of changes in the spatial dynamics was observed. However, further detailed
investigations revealed that a relationship between Rainfall and the distribution of crime does exist. These investigations led to the implementation of the Revelatory Index (RI) on Rainfall.
A.Revelatory Index (RI) on Rainfall
The Revelatory Index (RI) generally aims to reveal the varying spatial dynamics of crime in relation to ambient conditions by eliminating values and/or observations which mask the relationships between the datasets. This allows for trends and concealed crime dynamics, which would otherwise be hidden, to be studied.
[image:4.612.48.552.45.443.2]In Cardiff City’s Rainfall dataset, 493 observations out of 850 (i.e., around 58 %) had a value of 0.00 mm. This clearly biases the dataset towards these values and complicates investigations into the non-zero values. The implementation of RI on Rainfall was therefore to only consider the non-zero values in the Rainfall data. The data hence varies from 0.013 mm to 3.160 mm. Fig. 5 displays the RI on Rainfall Comap plot onto which changes in spatial crime dynamics in response to different levels of rainfall can now be observed.
[image:4.612.64.279.539.725.2]Figure 4: Comap Plot of All Rainfall Data
It can be seen from Fig. 5 that changes in the spatial dynamics of crime occurred when Rainfall ≥ 0.01 mm, hence 2 sets of
Rainfall conditions were considered in the implementation of DSDA. These were {Rainfall} = [0.00, 0.01[ and {Rainfall} = [0.01, 3.160]. In the execution of DSDA, the four above-mentioned cluster forecast approximation methods (i.e., NFM, OLS-NI, AM and OLS-PC) were individually calculated for each Rainfall set and was then combined within each method to maintain the integrity of the crime data.
B.Results
Fig. 6 illustrates the spatio-temporal implementation of DSDA with any weather parameters and weekly patterns integrated in the algorithm.
The results from applying the DSDA using the four different sets of weights discussed in Section III are given in Table 3.
NFM OLS-NI AM OLS-PC
1.5892 1.3701 1.1296 1.1240
[image:5.612.92.270.53.239.2]Figure 5: Revelatory Index on Rainfall Comap Plot
Figure 6: Illustration of DSDA on Cardiff City
[image:5.612.45.575.302.733.2]It can be seen that the forecasts obtained using OLS-PC were superior, with STMRSE of 1.1240 crimes per weekday per cluster followed closely by the AM method.
V.CONCLUSION AND FUTURE WORK
The results obtained using DSDA are superior to those obtained by SSDA, with a STMRSE of 1.124 crimes per weekday per cluster compared to a STMRSE of 1.131. Both these spatio-temporal forecasting models are easy to implement and can be extended to other fields of study such as pathological and environmental modelling and forecasting.
Future work will be looking at other significant weather parameters to crime distribution in order to improve the forecast accuracy of DSDA. Future work can also include the optimisation of the SDF weightβt j by utilizing optimisation procedures such as the Kalman Filter.
REFERENCES
[1] Ackerman, W.V. and A.T. Murray, Assessing spatial patterns of crime in Lima, Ohio. Cities, 2004. 21(5): p. 423-437.
[2] Brown, D.E. and H. Liu, Criminal incident prediction using a point-pattern-based density model. International Journal of Forecasting, 2003. 19(4): p. 603-622.
[3] Rossmo, D.K., Geographic profiling. 1999, Boca Raton, Fl: CRC Press. [4] Xue, Y. and D.E. Brown, Spatial analysis with preference specification of latent decision makers for criminal event prediction. Decision Support Systems, 2006. 41(3): p. 560-573.
[5] Al-Madfai, H. Hierarchical Profiling of daily Crime Time Series Data as a Precursor to Modelling. in ISF. 2005. San Antonio, Texas. [6] Ivaha, C., et al., The Simple Spatial Disaggregation Approach to
Spatio-Temporal Crime Forecasting. International Journal of Innovative Computing, Information and Control (IJICIC), 2007. 3(3): p. 1-15.