Proceedings of the Third Conference on Machine Translation (WMT), Volume 2: Shared Task Papers, pages 710–725
Findings of the WMT 2018 Shared Task on Automatic Post-Editing
Rajen Chatterjee(1), Matteo Negri(1), Raphael Rubino(2), Marco Turchi(1) (1)Fondazione Bruno Kessler, Trento, Italy
(2)Universit¨at des Saarlandes & DFKI, Saarbr¨ucken, Germany
{chatterjee,negri,turchi}@fbk.eu
{raphael.rubino}@dfki.de
Abstract
We present the results from the fourth round of the WMT shared task on MT Automatic Post-Editing. The task con-sists in automatically correcting the out-put of a “black-box” machine translation system by learning from human correc-tions. Keeping the same general evalua-tion setting of the three previous rounds, this year we focused on one language pair (English-German) and on domain-specific data (Information Technology), with MT outputs produced by two dif-ferent paradigms: phrase-based (PBSMT) and neural (NMT). Five teams submit-ted respectively 11 runs for the PBSMT subtask and 10 runs for the NMT sub-task. In the former subtask, characterized by original translations of lower quality, top results achieved impressive improve-ments, up to -6.24 TER and +9.53 BLEU points over the baseline “do-nothing” sys-tem. The NMT subtask proved to be more challenging due to the higher quality of the original translations and the availabil-ity of less training data. In this case, top results show smaller improvements up to -0.38 TER and +0.8 BLEU points. 1 Introduction
The WMT shared task on MT Automatic Post-Editing (APE), this year at its fourth round, aims to evaluate systems for the automatic correction of errors in a machine-translated text. As pointed out by (Chatterjee et al., 2015), from the application point of view the task is motivated by its possible uses to:
• Improve MT output by exploiting informa-tion unavailable to the decoder, or by
per-forming deeper text analysis that is too ex-pensive at the decoding stage;
• Cope with systematic errors of an MT system
whose decoding process is not accessible;
• Provide professional translators with im-proved MT output quality to reduce (human) post-editing effort;
• Adapt the output of a general-purpose MT system to the lexicon/style requested in a spe-cific application domain.
The 2018 round of the task proposed partici-pants with the same evaluation setting of the three previous editions (Bojar et al., 2015; Bojar et al., 2016; Bojar et al., 2017), in which the output of an unknown “black box” MT engine has to be auto-matically corrected by learning from human revi-sions of translations produced by the same engine. This year, the task focused on one language pair1(English-German) and, in continuity with the 2016 and 2017 rounds, on data coming from the Information Technology domain. The main nov-elty was represented by the use of training/test data including, for the same source sentences, transla-tions produced by two different MT technologies: phrase-based (in continuity with 2016 and 2017) and neural (for the first time). On one side, keep-ing language and domain unchanged was meant to measure the technology progress over the past. On the other side, extending the evaluation to NMT-derived data was meant to explore the effective-ness of APE techniques, which now migrated to the neural paradigm, to correct data obtained with the same paradigm.
In terms of participants and submitted runs, 5 teams produced respectively 11 runs for the PB-SMT subtask and 10 runs for the NMT subtask. 1As opposed to the 2017 round, in which both
English-German and English-German-English data were considered.
All submissions were produced by neural APE systems. All the teams experimented with the Transformer architecture (Vaswani et al., 2017), either directly or by adapting it to the task (see Section 2.1). The two synthetic corpora provided as additional training material (see Section 2.1) were also extensively used.
In terms of results, on PBSMT data, the last year’s trend is confirmed: the migration to the neural approach to APE yielded significant quality gains to the output of phrase-based MT systems. However, while in 2017 the largest improvements with respect to the baseline were respectively -4.9 TER and +7.6 BLEU, this year the distance is even larger: -6.24 TER and +9.53. On NMT data, the gains are less evident, with the largest improve-ments over the baseline of -0.38 TER and +0.8 BLEU.
The large difference in terms of quality gains yield by APE can be explained in several ways. One is the different amount of in-domain training data available: in the PBSMT subtask, they com-prise 28,000 instances while, in the NMT subtask, they are less than 14,000.2 Another reason is the different MT output quality in the two datasets. In-deed, TER and BLEU scores for the PBSMT test set are respectively 24.24 and 62.99 while, in the NMT test set, they reach considerably better val-ues of 16.84 and 74.73. Altogether, these differ-ences contributed to make the NMT subtask more challenging, participants’ scores concentrated in small TER/BLEU ranges close to the baseline and the overall results harder to interpret.
2 Task description
Similar to previous years, participants were pro-vided with training and development data consist-ing of (source, target, human post-edit) triplets, and were asked to return automatic post-edits for a test set of unseen (source,target) pairs.
2.1 Data
For this year’s round, the APE task focused on one language pair, English-German, and on data coming from theInformation Technology
(IT) domain. As emerged from the previous eval-uations, the selected target domain is specific and repetitive enough to allow supervised systems to 2In addition to these small in-domain training sets, which
were released by the organizers over the years, participants were also provided with large synthetic corpora described in Section 2.1.
learn from the training set useful correction pat-terns that are also re-applicable to the test set.
Training and development sets consist of (source,target,human post-edit) triplets in which:
• The source (SRC) is a tokenized English
sen-tence with length between 3 and 30 tokens;
• The target (TGT) is a tokenized German
translation of the source, which is produced by a black-box system unknown to partici-pants. Translations were produced with two different technologies, so to obtain two dif-ferent subtasks and evaluation scenarios. The first subtask, in continuity with the past, fo-cused on handling translations produced by a domain-adapted phrase-based system (PB-SMT subtask).3 The second subtask (NMT subtask) focused on handling translations produced by a domain-adapted neural sys-tem.4
• The human post-edit (PE) is a
manually-revised version of the target, which was pro-duced by professional translators.
Test data consists of (source,target) pairs hav-ing similar characteristics of those in the trainhav-ing set. Human post-edits of the test target instances are left apart to measure system performance.
For the PBSMT subtask, the training data available include: i)all the 15,000 triplets (train-ing, development and test) released for the 2016 round of the APE task andii)the 13,000 training and test triplets released for the 2017 round, for a total of 28,000 instances. Thetest set consists of 2,000 newly-released instances.
For the NMT subtask, the training and de-velopment set respectively consist of 13,442 and 1,000 triplets, while the test set comprises 1,023 instances.
3We used a phrase-based MT system trained with
generic and in-domain parallel training data, leveraging pre-reordering techniques (Herrmann et al., 2013), and taking ad-vantage of POS and word class-based language models.
4The NMT system was trained with generic and
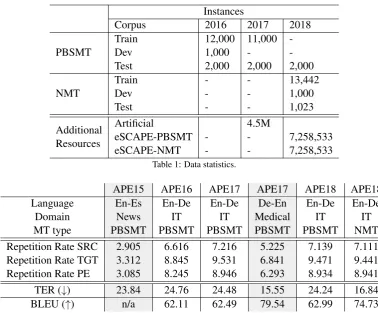
Instances
Corpus 2016 2017 2018
PBSMT TrainDev 12,000 11,000 -1,000 -
-Test 2,000 2,000 2,000
NMT TrainDev -- -- 13,4421,000
Test - - 1,023
Additional Resources
Artificial 4.5M
eSCAPE-PBSMT - - 7,258,533
[image:3.595.104.483.58.371.2]eSCAPE-NMT - - 7,258,533
Table 1: Data statistics.
APE15 APE16 APE17 APE17 APE18 APE18 Language En-Es En-De En-De De-En En-De En-De
Domain News IT IT Medical IT IT
MT type PBSMT PBSMT PBSMT PBSMT PBSMT NMT Repetition Rate SRC 2.905 6.616 7.216 5.225 7.139 7.111 Repetition Rate TGT 3.312 8.845 9.531 6.841 9.471 9.441 Repetition Rate PE 3.085 8.245 8.946 6.293 8.934 8.941 TER (↓) 23.84 24.76 24.48 15.55 24.24 16.84 BLEU (↑) n/a 62.11 62.49 79.54 62.99 74.73
Table 2: Repetition Rate and translation quality (TER/BLEU of TGT) of the WMT15, WMT16, WMT17 and WMT18 APE task data. Grey columns refer to data covering different language pairs and domains with respect to this year’s evaluation round.
Participants were also provided with additional training material for both the subtasks. One resource (called “Artificial” in Table 1) is the corpus of 4.5 million artificially-generated post-editing triplets used by the 2016 winning sys-tem (Junczys-Dowmunt and Grundkiewicz, 2016). This corpus was widely used by participants in the 2017 round of the APE task. The other resource is the English-German section of the eSCAPE cor-pus (Negri et al., 2018). It comprises 14.5 million instances, which were artificially generated both via phrase-based and neural translation (7.25 mil-lions each) of the same source sentences.
Table 1 provides basic statistics about the data, which was released by the European Project QT21 (Specia et al., 2017).
In addition, Table 2 provides a view of the data from a task difficulty standpoint. For each dataset released in the four rounds of the APE task, we report the repetition rate of SRC, TGT and PE ele-ments, as well as the TER (Snover et al., 2006) and the BLEU score (Papineni et al., 2002) of the TGT elements (i.e. the original target translations).
The repetition rate measures the repetitiveness inside a text by looking at the rate of non-singleton n-gram types (n=1...4) and combining them
us-ing the geometric mean. Larger values indicate a higher text repetitiveness and, as discussed in (Bojar et al., 2016; Bojar et al., 2017), suggest a higher chance of learning from the training set correction patterns that are applicable also to the test set. In the previous rounds of the task, we considered the large differences in repetitiveness across the datasets as a possible explanation for the variable gains over the baseline obtained by par-ticipants. In this perspective, the low system per-formance observed in the APE15 task and in the APE17 German-English subtask was in part as-cribed to the low repetition rate in the data. In con-trast, much higher repetition rates in the data likely contributed to facilitate the problem in the APE16 task and in the APE17 English-German subtask, in which most of the participants achieved signif-icant gains over the baseline. For this year’s data, values are in line with these two previous rounds.
The TER (↓) and BLEU (↑) scores reported in
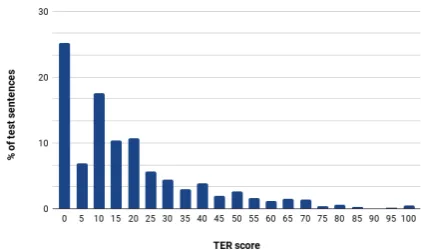
cor-Figure 1: TER distribution in thePBSMTtest set Figure 2: TER distribution in theNMTtest set
rect at test stage). On one side, indeed, train-ing on good (or near-perfect) automatic transla-tions can drastically reduce the number of learned correction patterns. On the other side, testing on similarly good translations can drastically reduce the number of corrections required and the appli-cability of the learned patterns, thus making the task more difficult. As observed in the previ-ous APE evaluation rounds, there is a noticeable correlation between translation quality and sys-tems’ performance. In 2016 and 2017, on English-German data featuring a similar level of quality (24.76/24.48 TER, 62.11/62.49 BLEU), the top neural systems achieved significant improvements over the baseline (-3.24 TER and +5.54 BLEU in 2016, -4.88 TER and +7.58 BLEU in 2017). In 2017, on higher quality German-English data (15.55 TER, 79.54 BLEU), the observed gains were much smaller (-0.26 TER, +0.28 BLEU). These numbers are not directly comparable since the higher quality 2017 data cover a different lan-guage pair and belong to a different domain. Nev-ertheless, as discussed in Section 4, this year’s re-sults confirm the correlation between the quality of the initial translations and the actual potential of APE.
Further indications about the difficulty of the two subtasks are provided by Figures 1 and 2, which plot the TER distribution for the items in the two test sets. As can be seen, the PBSMT test data are more distributed in terms of quality, with 50% of the items in the first five TER bins. Similar to last year, what makes a big difference between the two test sets is the proportion of “per-fect” test instances having TER=0 (i.e. items that should not be modified by the APE systems). For the PBSMT subtask they are 15.0% of the total, a value similar to the APE17 English-German task in which participants achieved large baseline
im-provements. For the NMT subtask, they are 25.2% of the total: much less than the proportion of the challenging APE17 German-English data (45.0%) but still a considerably higher value compared to the PBSMT subtask. For these test items, any cor-rection made by the APE systems will be treated as unnecessary and penalized by automatic evalu-ation metrics. This problem calls for conservative and precise systems able to properly fix errors only in the remaining test items, leaving the “perfect” ones unmodified.
2.2 Evaluation metrics
System performance was evaluated both by means of automatic metrics and manually. Automatic metrics were used to compute the distance be-tween automatic and human post-edits of the machine-translated sentences present in the test sets (i.e. for each of the target sentences in the PBSMT and NMT test sets). To this aim, TER and BLEU (case-sensitive) were respectively used as primary and secondary evaluation metrics. Sys-tems were ranked based on the average TER cal-culated on the test set by using the TERcom5 software: lower average TER scores correspond to higher ranks. BLEU was computed using the multi-bleu.perl package6available in MOSES.
Manual evaluation was conducted via direct hu-man assessment (Graham et al., 2016) performed by professional translators and proficient transla-tion students, as discussed in Sectransla-tion 6.
2.3 Baseline
In continuity with the previous rounds, the official baseline results were the TER and BLEU scores 5http://www.cs.umd.edu/˜snover/tercom/ 6https://github.com/moses-smt/
[image:4.595.78.288.66.194.2] [image:4.595.311.522.67.192.2]ID Participating team
DFKI-MLT German Research Center for Artificial Intelligence, Germany (Pylypenko and Rubino, 2018) FBK Fondazione Bruno Kessler, Italy (Tebbifakhr et al., 2018)
MS UEdin Microsoft, USA & University of Edinburgh, Poland (Junczys-Dowmunt and Grundkiewicz, 2018) POSTECH Pohang University of Science and Technology, South Korea (Shin and Lee, 2018)
USAAR DFKI Saarland University & German Research Center for Artificial Intelligence, Germany (Pal et al., 2018) Table 3: Participants in the WMT18 Automatic Post-Editing task.
calculated by comparing the raw MT output with the human post-edits. In practice, the baseline APE system is a “do-nothing” system that leaves all the test targets unmodified. Baseline results, the same shown in Table 2, are also reported in Tables 4 and 5 for comparison with participants’ submissions.7
For each submitted run, the statistical signif-icance of performance differences with respect to the baseline was calculated with the bootstrap test (Koehn, 2004).
3 Participants
Five participating teams submitted a total of 11 runs for the PBSMT subtask and 10 runs for the NMT subtask. Participants are listed in Table 3, and a short description of their systems is provided in the following.
German Research Center for Artificial Intelli-gence - MLT group. The DFKI-MLT’s partic-ipation is based on a single APE model that is jointly trained to handle PBNMT and NMT out-puts. This was achieved by adding, at the begin-ning of every MT segment to be corrected, a spe-cific token indicating which type of MT system was used to produce it and from which training corpus the segment pair was extracted. (i.e. the WMT training data, the artificial training data pre-sented in (Junczys-Dowmunt and Grundkiewicz, 2016), or the eSCAPE corpus (Negri et al., 2018)). The submitted runs were obtained with two neu-ral architectures. One (“LSTM”) is an attentional RNN with gated units based on (Bahdanau et al., 2014) and implemented in OpenNMT (Klein et al., 2017). The other is the multi-head attention-only network (Vaswani et al., 2017) implemented in 7In addition to the do-nothing baseline, in previous
rounds we also compared systems’ performance with a re-implementation of the phrase-based approach firstly pro-posed by Simard et al. (2007), which represented the common backbone of APE systems before the spread of neural solu-tions. As shown in (Bojar et al., 2016; Bojar et al., 2017), the steady progress of neural APE technology has made the phrase-based solution not competitive with current methods reducing the importance of having it as an additional term of comparison.
the Marian NMT toolkit (Junczys-Dowmunt et al., 2018). For the attention-only approach, two mod-els (i.e. “Transf.base” and “Transf.large”) were trained with different configurations in terms of parallel attention layers (4 and 8 respectively).
Fondazione Bruno Kessler. FBK’s system im-proves the multi-source neural approach adopted in (Chatterjee et al., 2017). The improvements target lower complexity of the architecture and, in turn, higher efficiency without loss in perfor-mance. To this aim, the proposed solution relies on the Transformer architecture (Vaswani et al., 2017), which was modified to incorporate multi-ple encoders, thereby leveraging information also from the source sentences. In addition, similar to (Hokamp, 2017), the system exploits minimum-risk training for fine-tuning (Shen et al., 2016) to avoid exposure bias and to be consistent with the automatic evaluation metrics used for the task. Fi-nally, in order to reduce the vocabulary size, the system appliesad hocpre-processing for the Ger-man language by re-implementing the pipeline de-veloped by the best system at the WMT‘17 Trans-lation task (Huck et al., 2017). In addition to the data released for the task, training is per-formed by taking advantage of both the artificial data provided by (Junczys-Dowmunt and Grund-kiewicz, 2016) and the eSCAPE corpus (Negri et al., 2018). The submitted runs, which rely on the same multi-source architecture and pre-processing step, differ in the loss function used, which is ei-ther minimum-risk training alone (“MRT”), or its linear combination with maximum likelihood esti-mation (“MRT+MLE”).
previ-ous multi-head component, one for each encoder. Each multi-head attention block is followed by a skip connection from the previous input and layer normalization. Each encoder corresponds exactly to the implementation from (Vaswani et al., 2017), but with common parameters. The decoder consists of a self-attention block, a target-to-source attention block, another target-target-to-source attention block and a feed-forward network. Apart from this modification, the system follows the transformer-base configuration from (Vaswani et al., 2017). The synthetic data provided by Junczys-Dowmunt and Grundkiewicz (2016) and the eSCAPE corpus (Negri et al., 2018) were both used during training, the latter being splitted into subsets by means of domain selection algorithms aimed to isolate useful portions for the APE target domain (IT). Final submissions were produced with an ensemble of models trained on the different subsets.
Pohang University of Science and Technology. POSTECH’s system is a multi-encoder model that extends the Transformer implementation in the Tensor2tensor library in order to model the rela-tion between the original translarela-tion produced by the MT system and the ideal translation produced by the human. System training was performed by taking advantage of the synthetic data released by Junczys-Dowmunt and Grundkiewicz (2016), which were divided into a smaller (526,368 in-stances) and a larger sub-portion (4,391,180) and used in a training process based on step-wise data reductions. The final submissions were obtained from the best single models (top-1), as well as their combination with different ensembling tech-niques (“fix5” – the top-5 models in a fixed check-point frequency and “var5” – five top-1 models for various checkpoint frequencies).
Saarland University & German Research Cen-ter for Artificial Intelligence. USAAR DFKI’s APE system extends the transformer-based NMT architecture by using two encoders, a joint en-coder, and a single decoder. The presented model concatenates two separate self-attention-based en-coders (encsrc and encmt) and passes this
se-quence through another self-attended joint en-coder (encsrc,mt) to ensure capturing
dependen-cies between srcand mt. Finally, this joint
en-coder is fed to the deen-coder which follows a similar architecture as described in (Vaswani et al., 2017).
A comparison between this multi-source architec-ture (i.e, {src, mt} → pe), a monolingual
trans-former model (i.e., mt → pe) and an ensemble
of the multi-source {src, mt} → peand single-source mt → pe models showed better results
from the ensemble model (both in the PBSMT and the NMT subtasks), which was hence used for the final submission.
4 Results
Participants’ results are shown in Tables 4 (PB-SMT subtask) and 5 (NMT subtask). The sub-mitted runs are ranked based on the average TER (case-sensitive) computed using human post-edits of the MT segments as reference, which is the APE task primary evaluation metric (“TER (pe)”). The two tables also report the BLEU score com-puted using human post-edits (“BLEU (pe)” col-umn), which represents our secondary evaluation metric. These results are commented in Section 4.1.
The last four columns of both tables report the TER/BLEU scores computed using external references (“TER (ref)” and “BLEU (ref)”) and the multi-reference TER/BLEU scores computed using human post-edits and external references (“TER (pe+ref)” and “BLEU (pe+ref)”). These re-sults are commented in Section 4.2.
As a general remark about the two subtasks, we observe that in the NMT subtask, with all the met-rics considered, the performance differences be-tween the submitted runs are smaller (and more of-ten not significant) compared to the PBSMT sub-task. As discussed in the next sections, this makes it difficult to draw firm conclusions from the anal-ysis of Table 5.
4.1 Automatic metrics computed using human post-edits
In terms of systems’ ranking, the primary (“TER (pe)”) and secondary evaluation metric (“BLEU (pe)”) produce similar results.8 On both the sub-tasks, the small differences in the TER-based and BLEU-based ranking concern a different ordering of the runs submitted by specific teams: one for the PBSMT subtask (in which FBK’s primary sub-mission is slightly better than the contrastive one in terms of BLEU) and two for the NMT sub-task (in which POSTECH’s and DFKI-MLT’s best 8The correlation between the ranks obtained by the two
TER BLEU TER BLEU TER BLEU
ID (pe) (pe) (ref) (ref) (pe+ref) (pe+ref)
MS UEdin Primary 18.0 72.52 42.66 42.93 17.03 76.7 FBK Contrastive (MRT+MLE) 18.62 71.04 43.29 41.99 17.79 75.19 FBK Primary (MRT) 18.94 71.22 43.74 41.67 18.18 74.96 POSTECH Contrastive (fix5) 19.63 69.87 43.91 41.46 18.82 74.02
POSTECH Primary 19.72 69.8 43.95 41.45 18.9 73.94
POSTECH Contrastive (var5) 19.74 69.7 43.98 41.35 18.9 73.93 USAAR DFKI Primary 22.69 66.16 46.08 39.26 21.98 69.73
USAAR DFKI* 22.88 66.05 46.09 39.27 22.13 69.68
DFKI-MLT Primary (Transf.large) 24.19† 63.4 47.98 36.81 23.68† 66.66
Baseline 24.24 62.99 48.33 36.42 23.76 66.21
DFKI-MLT Contrastive (Transf.base) 24.5† 62.78† 48.27† 36.61† 24.04† 66.11†
DFKI-MLT Contrastive (LSTM) 25.3 62.1 48.55† 36.19† 24.74 65.33
Table 4: Results for the WMT18 APEPBSMT subtask– average TER (↓), BLEU score (↑). The symbol “†” indicates a difference from the MT baseline that is not statistically significant. The symbol “*” indicates a late submission by the USAAR DFKI team.
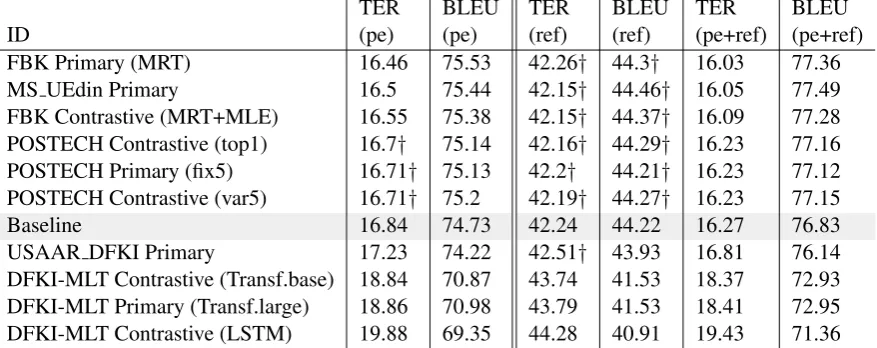
TER BLEU TER BLEU TER BLEU
ID (pe) (pe) (ref) (ref) (pe+ref) (pe+ref)
FBK Primary (MRT) 16.46 75.53 42.26† 44.3† 16.03 77.36
MS UEdin Primary 16.5 75.44 42.15† 44.46† 16.05 77.49 FBK Contrastive (MRT+MLE) 16.55 75.38 42.15† 44.37† 16.09 77.28
POSTECH Contrastive (top1) 16.7† 75.14 42.16† 44.29† 16.23 77.16
POSTECH Primary (fix5) 16.71† 75.13 42.2† 44.21† 16.23 77.12 POSTECH Contrastive (var5) 16.71† 75.2 42.19† 44.27† 16.23 77.15
Baseline 16.84 74.73 42.24 44.22 16.27 76.83
USAAR DFKI Primary 17.23 74.22 42.51† 43.93 16.81 76.14 DFKI-MLT Contrastive (Transf.base) 18.84 70.87 43.74 41.53 18.37 72.93 DFKI-MLT Primary (Transf.large) 18.86 70.98 43.79 41.53 18.41 72.95 DFKI-MLT Contrastive (LSTM) 19.88 69.35 44.28 40.91 19.43 71.36 Table 5: Results for the WMT18 APE NMT subtask– average TER (↓), BLEU score (↑). The symbol “†” indicates a difference from the MT baseline that is not statistically significant.
runs in terms of BLEU are different from those produced by the TER-based ranking). In both subtasks, however, the performance differences between the submitted runs are in general quite small: in a TER interval of less than one point we have the three top submissions to the PBSMT task and up to six submissions to the NMT sub-task. In this situation, slightly different rankings produced by the two metrics are not surprising. PBSMT subtask. This subtask has similar char-acteristics to the previous APE rounds. As shown by the results of the do-nothing baseline (24.24 TER, 62.99 BLEU), the original translations in the test set have a similar quality to those of the APE16 and APE17 En-De test sets (see Table 2). In spite of this, we observe further improvements compared to last year, in which the winning sys-tem was able to beat the baseline by -4.9 TER
and +7.6 BLEU points. Also this year, all par-ticipants managed to beat the MT baseline at least with their primary submission but the top-ranked submission (MS UEdin Primary) achieved larger improvements up to -6.24 TER and +9.53 BLEU points. Moreover, three submissions out of eleven outperformed the baseline by at least -5.0 TER and +8.0 BLEU points, which suggests a positive trend in terms of technology advancements. This can also be due to the availability of new additional training data (the eSCAPE corpus). However, ver-ifying this hypothesis would require additional ab-lation tests since only one team (POSTECH) did not use all the available resources.
[image:7.595.79.530.63.252.2] [image:7.595.81.520.299.473.2]train-ing set (less than half of the PBSMT subtask data) is confirmed. Results, even in the best case (FBK Primary), improve the baseline with a much smaller margin compared to the PBSMT subtask (-0.38 TER and +0.8 BLEU). Although they are obtained with the same neural technology success-fully deployed for the PBSMT subtask, the ma-jority of the scores fall in a range of less than one TER/BLEU point improvement over the base-line. Although not directly comparable, these re-sults are in line with those of the APE17 evalu-ation, which was carried out on German-English phrase-based translations featuring a similar level of quality (15.55 TER, 79.54 BLEU, see Table 2). The fact that current neural APE technology per-forms similarly on phrase-based and neural out-puts of comparable quality suggests that the qual-ity of the machine-translated text to be corrected plays a more important role than the MT paradigm itself.
4.2 Automatic metrics computed using external references
By learning from (SRC, TGT, PE) triplets, APE systems’ goal is to perform a “monolingual trans-lation” from raw MT output into its correct ver-sion. In this translation process, the same sentence can be corrected in many possible ways that make the space of possible valid outputs potentially very large. Ideally, from this space, APE systems should select solutions that reflect as much as pos-sible the post-editing style of the training data (in real-use settings, this can be the style/lexicon of specific users, companies, etc.). However, noth-ing prevents to end up with outputs that partially satisfy this constraint. In light of these consid-erations, TER and BLEU scores computed using human post-edits as reference represent a reliable measure of quality but:
1. They provide us with partial information on how systems’ output reflects the post-editing style of the training data;
2. They are not informative at all about the amount of valid corrections that are not present in the human post-edits.
4.2.1 Output style
To gain further insights on point 1., the “TER (ref)” and “BLEU (ref)” columns in Tables 4 and 5 show the TER and BLEU scores computed against independent reference translations. The rational
behind their computation is that differences in “TER/BLEU (pe)” and “TER/BLEU (ref)” can be used as indicators of the “direction” taken by the trained models (i.e. either towards humans’ post-editing style or towards a generic improvement of the MT output). Since independent references are usually very different from conservative hu-man post-edits of the same TGT sentences, all the TER/BLEU scores measured using indepen-dent references are expected to be worse. How-ever, if our hypothesis holds true, visible differ-ences in the baseline improvements measured with “TER/BLEU (pe)” and “TER/BLEU (ref)” should indicate system’s ability to model the post-editing style of the training data. In particular, larger gains measured with “TER/BLEU (pe)” will be associ-ated to this desired ability.
PBSMT subtask. As can be seen in Table 4, the PBSMT subtask results show this tendency. Looking at the improvements over the baseline, those measured by computing TER and BLEU scores against human post-edits are often larger than those computed against independent refer-ences. In terms of TER, this holds true for the top six submitted runs, with the best system that shows a difference of 0.57 TER points in the gains over the baseline computed with “TER (pe)” (-6.24) and those computed with “TER (ref)” (-5.67). In terms of BLEU, the differences are more visible. For the top nine submissions, the base-line improvements are larger when computed with “BLEU (pe)”. The best system improves over the baseline by 9.53 points with “BLEU (pe)” and 6.51 points with “BLEU (ref)”, with a difference of 3.02 points that can be explained by its tendency to re-flect the post-editing style of the training data.
4.2.2 Over-corrections
To shed light on point 2., the “TER (pe+ref)” and “BLEU (pe+ref)” columns in Tables 4 and 5 show the multi-reference TER and BLEU scores computed against post-edits and independent ref-erences. The rational behind their computa-tion is that differences in “TER/BLEU (pe)” and “TER/BLEU (pe+ref)” can be used to analyze the quality of the unnecessary corrections per-formed by the systems (or, in other words, to study the impact of systems’ tendency towards “over-correction”). APE corrections of a given MT out-put can indeed be of different types, namely: i)
correct edits of a wrong passage, ii)wrong edits of a wrong passage,iii) correct edits of a correct passage andiv)wrong edits of a correct passage. TER/BLEU scores computed against human post-edits work reasonably well in capturing cases i)
-ii)by matching APE systems’ output with human post-edits: for wrong MT output passages (i.e. those changed by the post-editor), they inform us about the general quality of automatic corrections (i.e. how close they are to the post-editor’s ac-tions). Cases iii)-iv), in contrast, are more prob-lematic since any change performed by the sys-tem to a correct passage (i.e. those that were not changed by the post-editor) will always be penal-ized by automatic comparisons with human post-edits. Although discriminating between the two types of unnecessary corrections is hard, we hy-pothesize that a comparison between “TER/BLEU (pe)” and “TER/BLEU (pe+ref)” can be used as a proxy to quantify those belonging to type iii). In general, due to the possibility to match more and longer n-grams in a multi-reference setting, “TER/BLEU (pe+ref)” scores are expected to be higher than “TER/BLEU (pe)” scores. However, if our hypothesis holds true, visible differences in the increase observed for the baseline and for the sys-tems should indicate system’s tendency to produce acceptable over-corrections (typeiii)). In particu-lar, larger gains observed for the APE systems will be associated to their over-correction tendency to-wards potentially acceptable edits that should not be penalized by automatic evaluation metrics. PBSMT subtask. As can be seen in Table 4, the multi-reference results computed with “TER/BLEU (pe+ref)” are unsurprisingly better than those computed with “TER/BLEU (pe)”. The variations of the do-nothing baseline are 0.48 TER points (from 24.24 with “TER (pe)” to 23.76 with
“TER (pe+ref)”) and 3.22 BLEU points (from 62.99 to 66.21). Interestingly, except for one sys-tem, all the results show larger variations when computed with “BLEU (pe+ref)”, with a differ-ence of 0.97 TER points (from 18.0 to 17.3) and 4.18 BLEU points (from 72.52 to 76.7) for the best system. Such variations are about 0.5 TER and 1.0 BLEU points larger than those measured for the baseline. This difference suggests that, though pe-nalized by the comparison with human post-edits, a good amount of corrections made by the sys-tem still represent acceptable modifications of the original translations. Further analysis, which we leave for future work, should focus on understand-ing whether these corrections represent a problem (i.e. an unwanted deviation from the desired target style) or acceptable paraphrases of the input.
NMT subtask. Also in this case, as shown in Ta-ble 5, the multi-reference results computed with “TER/BLEU (pe+ref)” are better than those com-puted with “TER/BLEU (pe)”. Apart from this, however, the performance variations for the base-line and the systems are not systematic nor partic-ularly informative.
5 System/performance analysis
As a complement to global TER/BLEU scores, also this year we performed a more fine-grained analysis of the changes made by each system to the test instances.
5.1 Macro indicators: modified, improved and deteriorated sentences
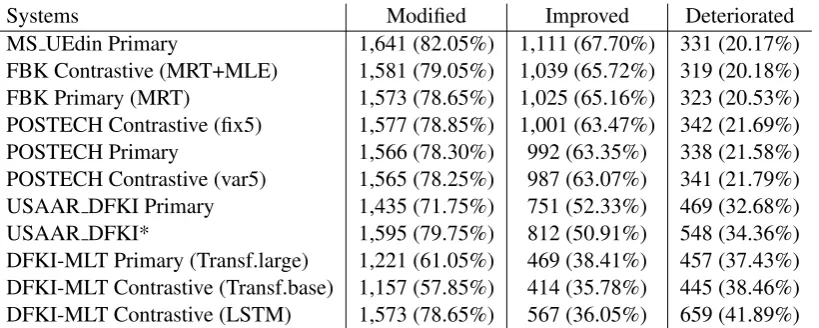
Tables 6 and 7 show the number of modified, im-proved and deteriorated sentences, respectively for the PBSMT and the NMT subtasks. It’s worth not-ing that, as in the previous rounds and in both the settings, the number of sentences modified by each system is higher than the sum of the improved and the deteriorated ones. This difference is repre-sented by modified sentences for which the cor-rections do not yield TER variations. This grey area, for which quality improvement/degradation can not be automatically assessed, contributes to motivate the human evaluation discussed in Sec-tion 6.
sys-Systems Modified Improved Deteriorated MS UEdin Primary 1,641 (82.05%) 1,111 (67.70%) 331 (20.17%) FBK Contrastive (MRT+MLE) 1,581 (79.05%) 1,039 (65.72%) 319 (20.18%) FBK Primary (MRT) 1,573 (78.65%) 1,025 (65.16%) 323 (20.53%) POSTECH Contrastive (fix5) 1,577 (78.85%) 1,001 (63.47%) 342 (21.69%) POSTECH Primary 1,566 (78.30%) 992 (63.35%) 338 (21.58%) POSTECH Contrastive (var5) 1,565 (78.25%) 987 (63.07%) 341 (21.79%) USAAR DFKI Primary 1,435 (71.75%) 751 (52.33%) 469 (32.68%) USAAR DFKI* 1,595 (79.75%) 812 (50.91%) 548 (34.36%) DFKI-MLT Primary (Transf.large) 1,221 (61.05%) 469 (38.41%) 457 (37.43%) DFKI-MLT Contrastive (Transf.base) 1,157 (57.85%) 414 (35.78%) 445 (38.46%) DFKI-MLT Contrastive (LSTM) 1,573 (78.65%) 567 (36.05%) 659 (41.89%) Table 6: Number of test sentences modified, improved and deteriorated by each run submitted to thePBSMT subtask.
Systems Modified Improved Deteriorated
FBK Primary (MRT) 276 (26.98%) 131 (47.46%) 77 (27.90%) MS UEdin Primary 316 (30.89%) 150 (47.47%) 107 (33.86%) FBK Contrastive (MRT+MLE) 298 (29.13%) 134 (44.97%) 88 (29.53%) POSTECH Contrastive (top1) 230 (22.48%) 105 (45.65%) 87 (37.83%) POSTECH Primary (fix5) 224 (21.90%) 103 (45.98%) 85 (37.95%) POSTECH Contrastive (var5) 220 (21.51%) 101 (45.91%) 85 (38.64%) USAAR DFKI Primary 304 (29.72%) 99 (32.57%) 138 (45.39%) DFKI-MLT Contrastive (Transf.base) 468 (45.75%) 60 (12.82%) 351 (75.00%) DFKI-MLT Primary (Transf.large) 448 (43.79%) 50 (11.16%) 342 (76.34%) DFKI-MLT Contrastive (LSTM) 565 (55.23%) 51 (9.03%) 430 (76.11%) Table 7: Number of test sentences modified, improved and deteriorated by each run submitted to theNMT subtask.
tems modified about 75.0% of the sentences, with values ranging from 57.85% to 82.05%. In line with last year’s round, the top-performing ones are more aggressive (the best systems peaks at 82.05% modified sentences) than those in lower-ranked positions. Since about 15.0% (i.e. 300) of the test instances are to be considered as “perfect” (see Figure1), the percentage of modifications is not too far to the expected value (85%). However, in terms of precision (i.e. the proportion of im-proved sentences out of the total amount of modi-fied test items), the average is only 54.7%. While the three top submissions are able to improve more than 65.0% of the test items (with the best sys-tem peaking at 67.7%), the lower-ranked ones do not exceed 53.0%. The deteriorated sentences are on average 28.2%, with only three systems that are able to limit this proportion to about 20.0%. These results indicate that, although systems are able to change the expected number of sentences in the test set (with overall MT quality improve-ments, as shown in Table 4), their precision is still crucial. From this point of view, the room for im-provement (more than 30 points in precision for
[image:10.595.104.498.251.400.2]Figure 3: System behaviour (primary submissions)
for thePBSMT subtask– TER(MT, APE) Figure 4: System behaviour (primary submissions)for theNMT subtask– TER(MT, APE)
one side, as we observed in the PBSMT subtask, systems’ low precision is an evident limitation. On the other side, and in addition to that, neural trans-lations might be particularly difficult to improve, even for neural APE models. Since NMT is known to produce considerably less reordering errors than PBSMT (Bentivogli et al., 2016), one possible ex-planation is that the margins of improvement to the input sentences are reduced to types of errors (e.g. lexical) on which APE systems are less reli-able. The analysis proposed in Section 5.2 aims to explore also this aspect.
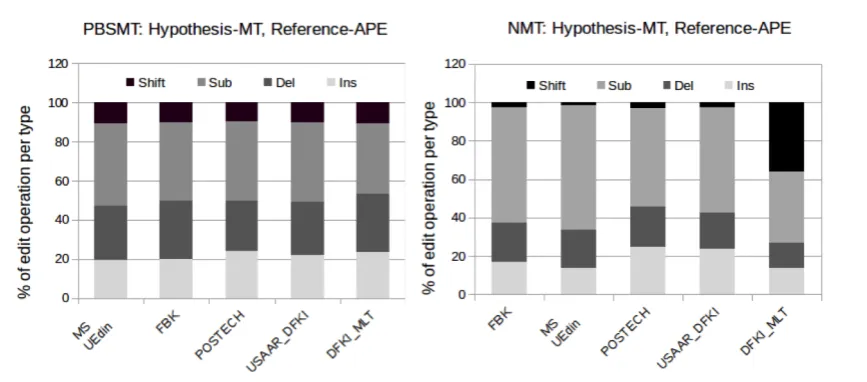
5.2 Micro indicators: edit operations
We now turn to analyze the possible differences in the way systems corrected the test set instances. To this aim, we looked at the distribution of the edit operations done by each system (insertions, deletions, substitutions and shifts) by computing the TER between the original MT output and the output of each system taken as reference (only for the primary submissions). The outcomes of this analysis are shown in Figures 3 (PBSMT subtask) and 4 (NMT subtask).
PBSMT subtask. As it is evident from Figure 3, little can be said about the small differences in sys-tem’s behaviour. Indeed, the plot does not show noticeable differences between neural-based sub-missions that, in most of the cases, implement sim-ilar solutions (multi-source, Transformer-based models trained with the same in-domain and ar-tificial corpora). All of them are characterized by a rather homogeneous distribution of the types of correction patterns applied, with a large number
[image:11.595.107.541.63.254.2]Figure 5: Screenshot of the direct assessment user interface.
the PBSMT subtask.
6 Human evaluation
In order to complement the automatic evaluation of APE submissions, a manual evaluation of the primary systems submitted (five in total) was ducted. Similarly to the manual evaluation con-ducted for last year APE shared task, it was car-ried out following the direct assessment (DA) ap-proach (Graham et al., 2013; Graham et al., 2016). In this Section, we present the evaluation proce-dure as well as the results obtained.
6.1 Evaluation procedure
The manual evaluation carried out this year in-volved 12 native German speakers with full
pro-fessional proficiency in English in the IT domain, with a third of the evaluators being students in translation technologies from Saarland University and the remaining ones researchers and engineers from DFKI. Each evaluator was introduced to the evaluation task through a set of slides and a test-ing phase of the evaluation platform in order to be familiar with the user interface and its functional-ities. A screenshot of the evaluation interface is presented in Figure 5.
A single assessment consists in assigning a score to a German sentence indicating how much of the meaning from a source sentence in English is expressed. In other words, the adequacy of a translation is directly evaluated on a scale from
0 to 100 given the source. The evaluators are
free to conduct as many assessments as they want and free to schedule their own evaluation sessions. In addition, there was no requirement regarding a minimum amount of assessments to perform. The evaluation took place over a period of a month and
Subtask PBSMT NMT
# Systems 7 7
[image:12.595.80.289.62.220.2]# Source segs 2,000 1,023 # Total Pairs 14,000 7,161 # Unique Pairs 8,749 2,916 Reduction 37.5% 59.3% Table 8: Data statistics per subtask with the total number of assessments prior to and after combination of identical target segments for each source.
was conducted in two sessions: a first one focus-ing on the PBSMT subtask and a second one on the NMT subtask.
For each subtask, the submitted post-edited test sets from the participants were presented to the evaluators one sentence at a time along with the corresponding source sentence. In order to de-fine a baseline and an upperbound for this man-ual evaluation, the baseline (no post-edits) and the human post-edited MT output were added to the pool of submissions to evaluate, leading to a total of14,000and7,161pairs of segments to evaluate
for the PBSMT and NMT subtasks respectively. However, it was possible to take advantage of the fact that multiple systems can produce identical outputs, allowing us to combine them and reduce the total number of source–target pairs to evalu-ate. Table 8 contains the statistics relative to the numbers of translations in total for all systems, as well as savings in terms of assessment effort that was gained by combining identical system outputs prior to running the evaluation.
Based on the direct assessment scores provided by the evaluators, two scores were computed for each system. A first score is the average of the segments direct assessment scores (noted ”Avg %”). For the second score (noted ”Avgz”), human
assessments for translations were first standard-ized according to each individual human asses-sor’s overall mean and standard deviation score. Average standardized scores for individual seg-ments belonging to a given system are then com-puted, before the final overall DA score for that system is computed as the average of its segment scores.
6.2 Human Evaluation results
The twelve human evaluators spent a total of 64
hours on the DA task with an average of17.2and 17.5seconds per assessment for the NMT and
# Assessments Avg. Duration (sec.)
ID PBSMT NMT PBSMT NMT
1 672 660 19.87 16.52
2 420 93 19.56 24.79
3 2,000 0 19.69
-4 1,153 228 20.57 23.38
5 751 20 23.62 27.71
6 1,500 200 16.58 15.60
7 60 0 24.66
-8 2,401 300 10.90 5.59
9 276 660 23.92 19.43
10 0 668 - 20.67
11 0 1,020 - 13.73
[image:13.595.322.509.60.171.2]12 0 100 - 30.27
Table 9: Direct assessments statistics indicating the number of assessments carried out per subtask and the average dura-tion in seconds per assessment for the twelve evaluators in-volved in the manual evaluation.
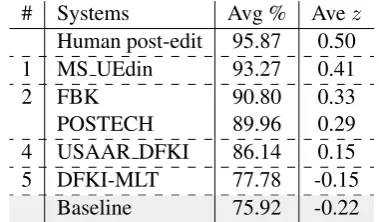
# Systems Avg % Avez
Human post-edit 95.87 0.50 1 MS UEdin 93.27 0.41
2 FBK 90.80 0.33
POSTECH 89.96 0.29 4 USAAR DFKI 86.14 0.15 5 DFKI-MLT 77.78 -0.15
[image:13.595.77.285.62.254.2]Baseline 75.92 -0.22 Table 10: DA Human evaluation results for thePBSMT sub-taskin terms of average raw DA (Ave %) and average stan-dardized scores (Avez). Dashed lines between systems
in-dicate clusters according to Wilcoxon signed-rank test at p-levelp≤0.05.
assessments done per evaluator, as well as the av-erage duration per assessment, are presented in Ta-ble 9.
PBSMT Subtask. The results of DA for the PBSMT subtask are presented in Table 10. Six clusters are defined, grouping systems together according to which systems significantly outper-form all others in lower ranking clusters based on the Wilcoxon signed-rank test. The human post-edited MT output reaches an averaged DA score of
95.87%, followed by the first system (MS UEdin), single in a cluster and significantly better than the other systems, with an averaged DA score of 93.27%. A second cluster contains two sys-tems which are non significantly different reach-ing90.9%and89.96%averaged DA scores.
All submitted systems are ranked significantly higher than the baseline (MT output without post-editing) but the top system remains below the
hu-# Systems Ave % Avez
Human post-edit 96.13 0.43 1 MS UEdin 91.11 0.24 POSTECH 90.41 0.22
FBK 90.41 0.20
[image:13.595.85.275.313.424.2]Baseline 90.18 0.20 USAAR DFKI 89.97 0.19 DFKI-MLT 89.53 0.18 Table 11: DA Human evaluation results for theNMT sub-taskin terms of average raw DA (Ave %) and average stan-dardized scores (Avez). Dashed lines between systems in-dicate clusters according to Wilcoxon signed-rank test at p-levelp≤0.05.
man post-edits with a difference of 2.6%. The
ranking of primary submissions for the PBSMT subtask is similar to the one obtained with the automatic metrics evaluation, where all primary systems were ranked above the baseline. For the DFKI-MLT system, TER indicates a non-significant difference with the baseline while DA scores leads to this system being significantly higher than the baseline.
NMT Subtask. The results of DA for the NMT subtask are presented in Table 11. Similarly to the results obtained with automatic metrics, the base-line is ranked above two and below three primary submissions. However, none of the submissions are ranked significantly higher or lower than the baseline according to DA scores and all five sub-missions are placed in the same cluster. The hu-man post-edited MT output reaches an averaged DA score of96.13%, ranked above the first
sys-tem (MS UEdin) with an averaged DA score of
91.11%.
The range of averaged DA scores for the NMT subtask is smaller ([89.53; 96.13]) compared to
the PBSMT subtask ([75.92; 95.87]), which is
obser-vation.
7 Conclusion
We presented the results from the fourth shared task on Automatic Post-Editing. This year, we proposed two subtasks in which the MT output to be corrected was respectively generated by a phrase system (PBSMT subtask) and by a neural system (NMT subtask). Both the subtasks dealt with English-German data drawn from the infor-mation technology domain. This evaluation round attracted submissions from five groups, who sub-mitted eleven runs for the PBSMT subtask and ten runs for the NMT one. Participants’ systems have a lot in common: they are all neural mod-els based on the Transformer architecture, some of them are based on multi-source methods and they all took advantage of the synthetic corpora released as additional training material. Evalua-tion results reflect such similarities and the effec-tiveness of the proposed solutions: top submis-sions have very close performance which, on both subtasks, shows significant improvements over the baseline.
In short, the main findings of this year’s round are the following:
• Besides the amount of training data (the train-ing corpora for the two subtasks have differ-ent size), the task difficulty is proportional to the quality of the initial translations. In line with previous years, learning from (and test-ing on) lower quality data leaves more room for improvement.
• The output of PBSMT systems is easier to improve (gains are up to -6.24 TER and +9.53 BLEU points). Such gains reflect a tendency to model the post-editors’ style learned from training data.
• The output of NMT systems is harder to
improve by current neural APE technology (gains are up to -0.38 TER and +0.8 BLEU points). A general explanations is that NMT translations are of higher quality. More specifically, looking the corrections done by the systems, the small number of reordering issues calls for effective methods to handle other types of errors (e.g. lexical choice) on which current APE technology can still be improved.
• Synthetic data help in improving perfor-mance. In the PBSMT subtask, similar to the APE17 English-German task from a task dif-ficulty standpoint, the synthetic data provided as additional training material contributed to further improvements over the baseline.
Acknowledgments
The manual evaluation conducted during the au-tomatic post-editing task has been partially sup-ported by the German Federal Ministry of Edu-cation and Research (BMBF) under the funding code 01IW17001 (Deeplee) and by the German Research Foundation (DFG) as part of SFB 1102 “Information Density and Linguistic Encoding”. We would like to thank the evaluators who partici-pated in the manual evaluation and Christian Fed-ermann for helping in data preparation and results extraction (Federmann, 2012).
References
Dzmitry Bahdanau, Kyunghyun Cho, and Yoshua Ben-gio. 2014. Neural machine translation by jointly learning to align and translate. arXiv preprint arXiv:1409.0473.
Luisa Bentivogli, Arianna Bisazza, Mauro Cettolo, and Marcello Federico. 2016. Neural versus Phrase-Based Machine Translation Quality: a Case Study. In Proceedings of the 2016 Conference on Empiri-cal Methods in Natural Language Processing, pages 257–267, Austin, Texas, November. Association for Computational Linguistics.
Ondˇrej Bojar, Rajen Chatterjee, Christian Federmann, Barry Haddow, Matthias Huck, Chris Hokamp, Philipp Koehn, Varvara Logacheva, Christof Monz, Matteo Negri, Matt Post, Carolina Scarton, Lucia Specia, and Marco Turchi. 2015. Findings of the 2015 Workshop on Statistical Machine Translation. InProceedings of the Tenth Workshop on Statistical Machine Translation, pages 1–46, Lisbon, Portugal, September. Association for Computational Linguis-tics.
Ondˇrej Bojar, Rajen Chatterjee, Christian Federmann, Yvette Graham, Barry Haddow, Shujian Huang, Matthias Huck, Philipp Koehn, Qun Liu, Varvara Logacheva, Christof Monz, Matteo Negri, Matt Post, Raphael Rubino, Lucia Specia, and Marco Turchi. 2017. Findings of the 2017 Conference on Machine Translation (WMT17). InProceedings of the Second Conference on Machine Translation, Vol-ume 2: Shared Task Papers, pages 169–214, Copen-hagen, Denmark, September. Association for Com-putational Linguistics.
Rajen Chatterjee, Marion Weller, Matteo Negri, and Marco Turchi. 2015. Exploring the Planet of the APEs: a Comparative Study of State-of-the-art Methods for MT Automatic Post-Editing. In Pro-ceedings of the 53rd Annual Meeting of the Associa-tion for ComputaAssocia-tional Linguistics), Beijing, China.
Rajen Chatterjee, M. Amin Farajian, Matteo Negri, Marco Turchi, Ankit Srivastava, and Santanu Pal. 2017. Multi-source Neural Automatic Post-Editing: FBK’s Participation in the WMT 2017 APE Shared Task. InProceedings of the Second Conference on Machine Translation, pages 630–638. Association for Computational Linguistics.
Rajen Chatterjee, Matteo Negri, Marco Turchi, Fr´ed´eric Blain, and Lucia Specia. 2018. Combin-ing Quality Estimation and Automatic Post-editCombin-ing to Enhance Machine Translation Output. In Con-ference of the American Association for Machine Translation (Research Track), New Orleans, LA.
Christian Federmann. 2012. Appraise: an open-source toolkit for manual evaluation of MT output. The Prague Bulletin of Mathematical Linguistics, 98:25– 36.
Yvette Graham, Timothy Baldwin, Alistair Moffat, and Justin Zobel. 2013. Continuous measurement scales in human evaluation of machine translation. In Pro-ceedings of the 7th Linguistic Annotation Workshop and Interoperability with Discourse, pages 33–41, Sofia, Bulgaria, August. Association for Computa-tional Linguistics.
Yvette Graham, Timothy Baldwin, Alistair Moffat, and Justin Zobel. 2016. Can machine translation sys-tems be evaluated by the crowd alone. Natural Lan-guage Engineering, FirstView:1–28, 1.
Teresa Herrmann, Jan Niehues, and Alex Waibel. 2013. Combining Word Reordering Methods on different Linguistic Abstraction Levels for Statisti-cal Machine Translation. InProceedings of the Sev-enth Workshop on Syntax, Semantics and Structure in Statistical Translation, Altanta, Georgia, USA.
Chris Hokamp. 2017. Ensembling Factored Neural Machine Translation Models for Automatic Post-Editing and Quality Estimation. In Proceedings of the Second Conference on Machine Translation, Copenhagen, Denmark, September.
Matthias Huck, Fabienne Braune, and Alexander Fraser. 2017. Lmu munich’s neural machine trans-lation systems for news articles and health infor-mation texts. In Proceedings of the Second Con-ference on Machine Translation, Volume 2: Shared Task Papers, pages 315–322, Copenhagen, Den-mark, September. Association for Computational Linguistics.
Marcin Junczys-Dowmunt and Roman Grundkiewicz. 2016. Log-linear combinations of monolingual and bilingual neural machine translation models for au-tomatic post-editing. In Proceedings of the First Conference on Machine Translation, pages 751– 758, Berlin, Germany, August.
Marcin Junczys-Dowmunt and Roman Grundkiewicz. 2018. Microsoft and University of Edinburgh at WMT2018: Dual-Source Transformer for Auto-matic Post-Editing. In Proceedings of the Third Conference on Machine Translation, Brussels, Bel-gium, October.
Marcin Junczys-Dowmunt, Roman Grundkiewicz, Tomasz Dwojak, Hieu Hoang, Kenneth Heafield, Tom Neckermann, Frank Seide, Ulrich Germann, Alham Fikri Aji, Nikolay Bogoychev, Andr´e F. T. Martins, and Alexandra Birch. 2018. Marian: Fast neural machine translation in C++. In Proceed-ings of ACL 2018, System Demonstrations, pages 116–121, Melbourne, Australia, July. Association for Computational Linguistics.
Guillaume Klein, Yoon Kim, Yuntian Deng, Jean Senellart, and Alexander Rush. 2017. Opennmt: Open-source toolkit for neural machine translation. In Proceedings of ACL 2017, System Demonstra-tions, pages 67–72. Association for Computational Linguistics.
Philipp Koehn. 2004. Statistical Significance Tests for Machine Translation Evaluation. InProceedings of EMNLP 2004, pages 388–395, Barcelona, Spain. Matteo Negri, Marco Turchi, Rajen Chatterjee, and
Nicola Bertoldi. 2018. eSCAPE: a Large-scale Synthetic Corpus for Automatic Post-Editing. In
Proceedings of the Eleventh International Confer-ence on Language Resources and Evaluation (LREC 2018), Miyazaki, Japan, May 7-12, 2018.
Santanu Pal, Nico Herbig, Antonio Kr¨uger, and van Genabith Josef. 2018. A Transformer-Based Multi-Source Automatic Post-Editing System. In Proceed-ings of the Third Conference on Machine Transla-tion, Brussels, Belgium, October.
Kishore Papineni, Salim Roukos, Todd Ward, and Wei-Jing Zhu. 2002. BLEU: A Method for Automatic Evaluation of Machine Translation. InProceedings of the 40th Annual Meeting on Association for Com-putational Linguistics, ACL ’02, pages 311–318. Daria Pylypenko and Raphael Rubino. 2018.
Conference on Machine Translation, Brussels, Bel-gium, October.
Rico Sennrich, Barry Haddow, and Alexandra Birch. 2016. Neural machine translation of rare words with subword units. InProceedings of the 54th An-nual Meeting of the Association for Computational Linguistics (Volume 1: Long Papers), pages 1715– 1725, Berlin, Germany, August.
Rico Sennrich, Orhan Firat, Kyunghyun Cho, Alexan-dra Birch, Barry Haddow, Julian Hitschler, Marcin Junczys-Dowmunt, Samuel L¨aubli, Antonio Vale-rio Miceli Barone, Jozef Mokry, and Maria Nade-jde. 2017. Nematus: a Toolkit for Neural Ma-chine Translation. InProceedings of the Software Demonstrations of the 15th Conference of the Euro-pean Chapter of the Association for Computational Linguistics, pages 65–68, Valencia, Spain, April.
Shiqi Shen, Yong Cheng, Zhongjun He, Wei He, Hua Wu, Maosong Sun, and Yang Liu. 2016. Minimum risk training for neural machine translation. In Pro-ceedings of the 54th Annual Meeting of the Associa-tion for ComputaAssocia-tional Linguistics (Volume 1: Long Papers), pages 1683–1692. Association for Compu-tational Linguistics.
Jaehun Shin and Jong-Hyeok Lee. 2018. Multi-encoder Transformer Network for Automatic Post-Editing. InProceedings of the Third Conference on Machine Translation, Brussels, Belgium, October.
Michel Simard, Cyril Goutte, and Pierre Isabelle. 2007. Statistical Phrase-Based Post-Editing. In
Proceedings of the Annual Conference of the North American Chapter of the Association for Compu-tational Linguistics (NAACL HLT), pages 508–515, Rochester, New York.
Matthew Snover, Bonnie Dorr, Richard Schwartz, Lin-nea Micciulla, and John Makhoul. 2006. A Study of Translation Edit Rate with Targeted Human An-notation. InProceedings of Association for Machine Translation in the Americas, pages 223–231, Cam-bridge, Massachusetts, USA.
Lucia Specia, Kim Harris, Aljoscha Burchardt, Marco Turchi, Matteo Negri, and Inguna Skadina. 2017. Translation Quality and Productivity: A Study on Rich Morphology Languages. InProceedings of the 16th Machine Translation Summit, Nagoya, Japan, September.
Amirhossein Tebbifakhr, Ruchit Agrawal, Matteo Ne-gri, and Marco Turchi. 2018. Multi-source Trans-former with Combined Losses for Automatic Post-Editing. InProceedings of the Third Conference on Machine Translation, Brussels, Belgium, October.
Ashish Vaswani, Noam Shazeer, Niki Parmar, Jakob Uszkoreit, Llion Jones, Aidan N Gomez, Ł ukasz Kaiser, and Illia Polosukhin. 2017. Attention is all you need. In I. Guyon, U. V. Luxburg, S. Bengio,