Abstract
—
Adsorption of hexavalent and trivalent chromium ions from aqueous solution by various composite alginate beads was investigated in a batch reactor. Ca-alginate beads, protonated beads, and dithionite entrapped beads wereprepared andused for the experiment. Adsorption equilibrium
experiments were carried out at different pH. The equilibrium data were correlated with the Langmuir, Freundlich and Sips equations. The internal diffusion coefficients were determined by comparing the experimental concentration curves with those predicted from the surface diffusion model and the pore diffusion model.
Index Terms— adsorption, alginate bead, chromium ions, equilibrium, kinetics
I. INTRODUCTION
Chromium (Cr) is one of the most strategic and critical materials having a wide range of use in the various industries. Since chromium, along with most of the heavy metals, is considered toxic, discharge limits for both Cr(III) and Cr(VI) have been instituted by most industrialized countries [1], [2]. Hexavalent chromium is generally found in the chemical industry as an oxidizing agent, metallurgical industry for chrome alloy of chromium metal production, electroplating, corrosion control and photography. On the other hand, trivalent chromium is extensively used in leather tanning industry, paints and pigments industry, fungicides industry and ceramic or glass manufacture. Cr(VI) is known to be toxic to both plants and animals, as a strong oxidizing agent and potential carcinogen. Although Cr(III) is nontoxic or less toxic than Cr(VI), a long-term exposure to trivalent chromium is known to cause allergic skin reactions.
Manuscript received July 17, 2008
The authors wish to acknowledge a grant-in-aid for research from BK 21 team for the Environmentally Friendly Core Material and Process Development and CPMD at CNU.
T. Y. Kim, Dr., is with the Environmental Engineering Department, Chonnam National University, Gwangju, 500-757, Korea (e-mail : [email protected])
J. H. Chung, Dr., is with the Environmental Engineering Department, Chonnam National University, Gwangju, 500-757, Korea (e-mail : [email protected])
S. Y. Choi, M.S., is with the Environmental Engineering Department, Chonnam National University, Gwangju, 500-757, Korea (e-mail : @chonnam.ac.kr)
S. Y. Cho, Professor, is with the Environmental Engineering Department, Chonnam National University, Gwangju, 500-757, Korea (e-mail : [email protected])
S. J. Kim, Professor, is with the Environmental Engineering Department, Chonnam National University, Gwangju, 500-757, Korea (e-mail : [email protected])
The conventional treatment of wastewater containing high concentration of chromium consists of four steps, including (1) the reduction of Cr(VI) to Cr(III), (2) the precipitation of Cr(III) as Cr(OH)3 at high pH, (3) the settling of the insoluble metal hydroxide, and finally (4) the disposal of the dewatered sludge. The major shortcomings of the conventional treatment include costly safe disposal of toxic sludge, high cost of chemicals used for Cr(VI) reduction, and incomplete reduction of Cr(VI). Wastewater containing relatively low concentration of Cr(VI) is usually treated with ion-exchange resin which has the advantage of the recovery of chromic acid and also disadvantage of high cost of resin. As an alternative to this, adsorption has recently gained more attention due to its possibility to overcome this problem. In several recent publications, various authors have reported the use of different adsorbents for trivalent chromium removal using such as: chitosan impregnated microemulsions, sunflower stalks, seaweed biomass [3]-[5]. In a similar manner, hexavalent chromium removal was investigated by employing composite chitosan biosorbent, granular activated carbon, immobilized fungal biomass [6],[7]. The adsorption of trivalent and hexavalent chromium mixture was effective by few adsorbents such as seaweed biosorbent and layer silicates. Recently, the possibility of both chromium species removal from tannery effluents was studied, by the use of calcium alginate beads containing humic acid, in a toxicological approach [8].
In this work composite alginate beads were prepared to evaluate the feasibility for the simultaneous reduction of Cr(VI) and adsorption of Cr(III) from the aqueous solutions. The adsorption capacity and kinetics were studied.
II. MATERIALS AND METHODS
A. Preparation of alginate bead
Calcium alginate beads were prepared by the method described by Papageorgiou et al., [9]. For preparation of the ca-alginate beads, 3% sodium alginate solution was added, drop by drop, into 3% calcium chloride solution in a stirrer. The prepared ca-alginate beads were protonated with 2N H2SO4 and the protonated composite beads were washed
several times with deionized water. And the dithionite entrapped beads were prepared with mixing 3% sodium alginate solution and 3% sodium dithionite solution. The mixed solution was cross-linked with 3% calcium chloride. Three composite alginate beads were dried by exposing them to air at room temperature for several days until no weight change was observed. The advantage of using the dry beads
Adsorption Characteristics of Chromium Ions
onto Composite Alginate Bead
over the gel beads were accurate measurement of the mass, better handling nature, gain in mechanical strength and rigidity.
B. Adsorption experimentals and analysis
For adsorption equilibrium experiment, 0.1 g of three composite alginate beads were mixed with 50 mL of Cr(III) solutions in 100 mL Erlenmeyer flask which is kept in a shaking incubator at 298 K. The solution concentrations were 50-500 mg/L and the pH of the solution was adjusted between 1.0 and 4.0, and the temperature was adjusted between 278 K and 318 K. A colorimetric method, described in the Standard Methods [10], was used to measure the concentration of the different Cr species. Spectrophotometer (Cole-parmer) was used for this experiment at the wavelength of 540 nm.
III. RESULTS AND DISCUSSION
A. Characterization of alginate
FT-IR analysis was performed to examine the functional groups on the ca-algnate beads. As shown in Fig. 1, the FT-IR spectrum of ca-alginate bead displays a number of absorption peaks. The broad peak around 3350 cm-1 is an indicative of existence of bonded hydroxyl group. The absorption peak at 1740 cm-1 represent the stretching band of the free carbonyl double bond from the carboxyl functional group [11]. The peak around 1630 cm-1 is chelated stretching bond of C=O. It is reported that the carboxyl groups on biological polymer such as ca-alginate bead have pKH values
raging from 3.5 to 5.0 [12], and this carboxyl groups on ca-alginate bead play an important role in Cr(III) adsorption.
Wavenumbers, cm-1
1000 1500 2000
2500 3000
3500 4000
A
b
so
rba
n
ce
[image:2.595.337.508.352.526.2]0.65 0.70 0.75 0.80 0.85 0.90 0.95
Fig. 1. FT-IR spectra of ca-alginate bead.
B. Adsorption of Cr(VI) and Cr(III)
Adsorption isotherms are very important for the design of an adsorption-based process design. Isotherm models of the Langmuir, Freundlich and Sips [13]-[15]were fitted to describe the equilibrium adsorption. These equations of isotherms were given below:
Langmuir isotherm,
e e m
bC bC q q
+ =
1 (1)
where Ce is the supernatant concentration at the equilibrium
state of the system (mol/m3), b is the Langmuir affinity constant (m3/mol), and qm is the maximum adsorption
capacity of the material (mol/kg) assuming a monolayer of adsorbate uptaken by the adsorbent.
Freundlich isotherm,
q
=
kC
e1/n (2) where k is the Freundlich constant related with adsorption capacity (mol/kg)(mol/m3)-1/n and n is the Freundlich exponent (dimensionless).Sips isotherm
,
ne n e m
bC
bC
q
q
1// 1
1
+
=
(3)where b is the Sips constant related with affinity constant (mol/m3)-1/n and qm is the Sips maximum adsorption capacity
(mol/kg).
Time [h]
0 20 40 60 80 100
Cr(VI
) conc
en
tr
a
ti
o
n
[mg
/L]
0 20 40 60 80 100 120
[image:2.595.51.286.469.637.2]Ca-alginate beads Protonated beads Dithionite entrapped beads
Fig. 2. Concentration decay curves of Cr(VI) for different alginate beads.
Time [h]
0 5 10 15 20 25
Cr
(II
I) conce
n
trati
o
n [m
g
/L
]
0 20 40 60 80 100 120
Ca-alginate beads Protonated beads Dithionite entrapped beads
[image:2.595.339.506.566.732.2]Fig. 2 shows the concentration decay curves of Cr(VI) onto different adsorbents in a batch reactor (concentration of Cr(VI); 100 ppm, T; 298K, concentration of adsorbents; 5g/L). As shown in this figure, Cr(VI) concentration decreased rapidly onto the protonated alginate bead and dithionite entrapped alginate bead. Cr(VI) was reduction into Cr(III) by contact with protonated alginate bead and dithionite entrapped alginate bead and then adsorption of the reduced Cr(III) onto the beads. But Cr(VI) was practically constant onto the ca-alginate bead. Since ca-alginate bead does not reduce Cr(VI) to Cr(III).
Fig. 3 shows the concentration decay curves of Cr(III) onto different adsorbents in a batch reactor. As can be seen in this figure, The adsorption rate of Cr(III) onto the different adsorbents was in the order of dithionite entrapped beads > ca-alginate beads > protonated alginate beads.
C. Effect of pH
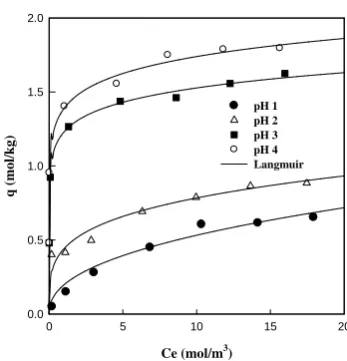
Figs. 4 - 6 show the adsorption isotherms of Cr(III) onto the composite alginate beads in terms of pH values. The concentration of alginate bead was 5 g/L, and the initial concentration and volume of the chromium solution were 50-500 mg/L and 50mL, respectively. As can be seen in those figures, the adsorption capacity of Cr(III) onto the different adsorbents was in the order of dithionite entrapped beads > ca-alginate beads > protonated alginate beads. And
Ce (mol/m3)
0 5 10 15 20
q
( m
o
l/k
g
)
0.0 0.5 1.0 1.5 2.0
pH 1 pH 2 pH 3 pH 4 Langmuir
[image:3.595.303.549.522.773.2]
Fig. 4. Adsorption isotherms of Cr(III) onto ca-alginate bead at different pH values.
Ce (mol/m3)
0 5 10 15 20
q (m
ol/k
g)
0.0 0.5 1.0 1.5 2.0
pH 1 pH 2 pH 3 pH 4 Langmuir
Fig. 5. Adsorption isotherms of Cr(III) onto protonated alginate bead at different pH values.
Ce (mol/m3)
0 5 10 15 20
q (mol/
k
g)
0.0 0.5 1.0 1.5 2.0
pH 1 pH 2 pH 3 pH 4 Langmuir
Fig. 6. Adsorption isotherms of Cr(III) onto dithionite entrapped alginate bead at different pH values. the maximum uptake (qm) increased with increasing pH.
Since the carboxyl group has pKH = 4.6, it is expected that the
adsorption sites are occupied by protons at low pH values, so that Cr(III) ions cannot be adsorbed. At pH 4, the maximum Cr(III) uptake was estimated to be 1.84 mequiv./g, based on the assumption that Cr(III) exists solely as Cr3+ at this pH. This results suggest that the solution pH is important in Cr(III) adsorption.
In this study, three isotherm models, the Langmuir, Freundlich and Sips were used to correlate our experimental equilibrium data. To find the parameters for each adsorption isotherm, the linear least square method and the pattern search algorithm were used. The value of the mean percentage error has been used as a test criterion for the fit of the correlations. The mean percent deviation between experimental and predicted values was obtained using equation 4.
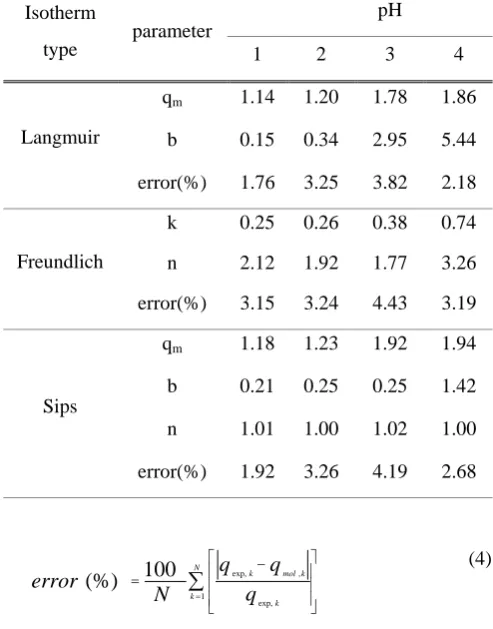
Table 1. Adsorption equilibrium constants of Cr(III) onto ca-alginate bead at different pHs (298 K )
pH Isotherm
type parameter 1 2 3 4
qm 0.93 1.07 1.58 1.67
b 0.14 0.29 0.48 0.76
Langmuir
error(%) 4.77 1.58 2.70 1.12
k 0.19 0.44 1.23 1.39
n 2.31 3.99 10.59 10.19
Freundlich
error(%) 5.81 4.38 4.20 1.89
qm 0.93 1.06 1.66 1.86
b 0.13 0.29 1.96 2.40
n 0.97 0.99 1.15 1.15
Sips
[image:3.595.74.252.593.762.2]Table 2. Adsorption equilibrium constants of Cr(III) onto protonated alginate bead at different pHs (298 K )
pH Isotherm
type parameter 1 2 3 4
qm 0.72 1.06 1.50 1.59
b 0.44 0.28 0.31 0.42
Langmuir
error(%) 4.04 2.37 3.00 2.41
k 0.32 0.37 0.43 0.75
n 4.02 3.26 2.49 4.15
Freundlich
error(%) 4.65 2.58 3.89 5.14
qm 0.77 1.04 1.50 1.65
b 0.38 0.29 0.34 0.46
n 1.07 1.03 1.05 1.00
Sips
[image:4.595.305.550.315.397.2]error(%) 4.07 2.17 3.03 3.49
Table 3. Adsorption equilibrium constants of Cr(III) onto dithionite entrapped alginate bead at different pHs (298 K )
pH Isotherm
type parameter 1 2 3 4
qm 1.14 1.20 1.78 1.86
b 0.15 0.34 2.95 5.44
Langmuir
error(%) 1.76 3.25 3.82 2.18
k 0.25 0.26 0.38 0.74
n 2.12 1.92 1.77 3.26
Freundlich
error(%) 3.15 3.24 4.43 3.19
qm 1.18 1.23 1.92 1.94
b 0.21 0.25 0.25 1.42
n 1.01 1.00 1.02 1.00
Sips
error(%) 1.92 3.26 4.19 2.68
∑
= ⎥⎥
⎥
⎦ ⎤
⎢ ⎢ ⎢
⎣ ⎡ −
= N
k
k k mol k
q q q N error
1
exp, , exp,
100 (%)
(4)
where qmol, k is each value of q predicted by the fitted model
and qexp, k is each value of q measured experimentally, and N
is the number of experiments performed.
The parameters and the average percent differences between measured and calculated values for Cr(III) onto the adsorbents are given in Tables 1 - 3. As shown in the Tables, the Langmuir equation gives the best fit of our data.
The heat of adsorption can be evaluated from adsorption equilibrium data and equation (5). If b values are known for different temperatures, the heat of adsorption can be calculated from the plot of ln b versus 1/T [16].
b = bo exp[- ΔH/RT] (5)
where b is the Langmuir constant, b0 is a constant, ΔH
(kcal∙mol-1) is the heat of adsorption, R is a universal gas constant (1.987 cal∙mol-1∙K-1) and T is the absolute temperature (K). Using our experimental data and equation 5, the heat of adsorption obtained are listed in Table 4. The results show that the adsorption reaction is endothermic. The heat of physical adsorption is less than 1kcal mol-1, and that of chemical adsorption is 5-100 kcal∙mol-1 [17]. Since the heat of adsorption for Cr(III) in this study are 1.40–2.10 kcal∙mol-1, both physical and chemical adsorptions are involved in the adsorption.
Table 4. The values of heat of adsorption for various alginate beads
Adsorbent
Heat of adsorption,
(kcal/mol)
R2
Ca-alginate beads 2.098 0.96
Protonate beads 1.400 0.99
Dithionite entrapped beads 1.725 0.99
D. Kinetics studies
For the modeling of the adsorption kinetics, one has to pay attention to two problems : one is the pore structure of adsorbents and the other is the mass transfer resistance involved in the adsorption. The adsorption on a solid surface takes place in several steps, such as external diffusion, internal diffusion, and actual adsorption. In general, actual adsorption process is relatively fast compared to the previous two steps. Intraparticle diffusion has been usually considered as the rate-controlling step in liquid-phase adsorption. However, it is important to estimate the order of magnitude of the mass transfer coefficient. There are several correlations for estimating the film mass transfer coefficient, kf, in a batch
system. In this work, we estimated kf from the initiation
concentration decay curve when the diffusion resistance does not prevail. The transfer rate of any species to the external surface of the adsorbent, NA, can be expressed by
NA = kf As (C - Cs) (6)
where NA is rate of mass transfer of adsobate to the external
surface of the biomass (mol/s). kf is film mass transfer
coefficient (m/sec).
By rearrangement and approximation for a batch system with adsorption time of less than 300 seconds [18].
ln (C / Ci) = - kf As t / Vs (7)
where Vs is the volume of solution (m3) and As is the effective
[image:4.595.44.291.365.680.2]As = 3M / ρp Rp (8)
where M is total mass of sorbent particle (kg). ρp and Rp are
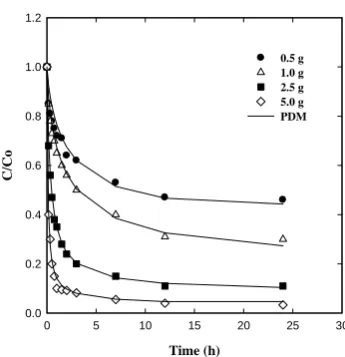
particle density (kg/m3) and particle radius (m), respectively. Figs. 7-9 show the experimental data and model prediction for the adsorption of Cr(III) onto the different alginate beads in terms of dosage in a batch adsorber. The initial adsorption rate of Cr(III) onto the different alginate beads increased with increasing dosage of the biosorbents. In this study, the pore diffusion coefficient, Dp, and surface
diffusion coefficient, Ds, are estimated by pore diffusion
model (PDM) and surface diffusion model (SDM) [19], [20]. And pore diffusion model is well predicted of our experimental data. The estimated values of
k
f, Dp, and Dsfor Cr(III) onto the different alginate beads are listed in Table 5.
Time (h)
0 5 10 15 20 25 30
C/
C
o
0.0 0.2 0.4 0.6 0.8 1.0 1.2
[image:5.595.337.510.64.243.2]0.5 g 1.0 g 2.5 g 5.0 g PDM
Fig. 7. Batch adsorption of Cr(III) at different ca-alginate bead concentration (pH : 4, 298 K)
Time (h)
0 5 10 15 20 25 30
C/
C
o
0.0 0.2 0.4 0.6 0.8 1.0 1.2
[image:5.595.72.257.294.479.2]0.5 g 1.0 g 2.5 g 5.0 g PDM
Fig. 8. Batch adsorption of Cr(III) at different protonate alginate bead concentration (pH : 4, 298 K)
Time (h)
0 5 10 15 20 25 30
C/C
o
0.0 0.2 0.4 0.6 0.8 1.0 1.2
0.5 g 1.0 g 2.5 g 5.0 g PDM
Fig. 9. Batch adsorption of Cr(III) at different entrapped alginate bead concentration (pH : 4, 298 K) Table 5. Kinetic parameters of Cr(III) in a batch reactor ( pH : 4, 298 K).
Adsorbents Dosage [g]
kf x 10-5
[m/s]
Dp x 10-9
[m2/s]
Ds x 10-11
[m2/s] Bi [ - ]
0.5 3.33 0.79 0.13 12.4
1.0 2.69 0.14 0.06 20.7
2.5 2.33 0.90 0.04 27.3
Ca-alginate
5 2.00 0.55 0.03 28.2
0.5 3.00 6.60 1.26 1.08
1.0 2.50 5.59 0.96 1.23
2.5 2.02 2.53 0.74 1.23
Protonate alginate
5 1.68 2.05 0.29 3.18
0.5 13.3 0.86 0.02 19.3
1.0 9.99 0.72 0.01 16.4
2.5 5.99 0.39 0.03 6.10
Entrapped alginate
5 3.77 0.05 0.01 5.99
The nondimensional Biot number, Bi, in Table 5 was estimated by the following relationship [21]
Bi
o p s
o p f
q
D
c
d
k
ρ
2
=
(9) [image:5.595.304.549.313.586.2] [image:5.595.72.259.537.723.2]IV. CONCLUSION
Removal of hexavalent and trivalent chromium ions from aqueous solution by composite alginate beads was investigated in a batch reactor, and the following conclusions were obtained.
The ca-alginate bead did not reduce Cr(VI) to Cr(III), but adsorbed Cr(III). The protonated bead reduced Cr(VI) moderately, but the adsorption of Cr(III) was lower than the ca-alginate bead. The rates of Cr(VI) reduction and Cr(III) adsorption by the dithionite entrapped bead were much higher than the other two alginate beads.
The Cr(III) adsorption equilibrium data were correlated very well with Langmuir equation. And kinetic parameters such as the mass transfer coefficients and controlling-step diffusion coefficients were evaluated from several correlation approximations.
The adsorption of the chromium ions was endothermic reaction, and the heats of adsorption were 2.1, 1.4, and 1.7 kcal mol-1, for ca-alginate, protonated, and dithionite entrapped beads, respectively
REFERENCES
[1] M. Costa, “potential hazards of hexavalent chromate in our drinking water”, Toxicology and applied pharmacology, 188, 2003, pp. 1-5.
[2] P. Baroni, R. S. Vieira, E. Meneghetti, M. G. C. da Silva, and M. M. Beppu, “Evaluation of batch adsorption of chromium ions on natural and crosslinked chitosan membranes”, J. of Hazard. Mater., 152, 2008, pp. 1155-1163.
[3] T. N. de Castro Dantas, A. A. Dantas Neto, M. C. P. de A. Moura, E. L. Barros Neto, and E. de Paiva Telemaco, “Chromium Adsorption by Chitosan Impregnated with Microemulsion”, Langmuir, 17, 2001, pp. 4256-4260. [4] G. Sun, and W. Shi, “Sunflower Stalks as Adsorbents for
the Removal of Metal Ions from Wastewater”, Ind. Eng. Chem. Res., 37, 1998, pp. 1324-1328.
[5] Y. S. Yun, D. Park, J. M. Park, and B. Volesky, “Biosorption of trivalent chromium on the brown seaweed biomass”, Environ. Sci. Technol., 35, 2001, pp. 4353-4358.
[6] G. J. Copello, F. Varela, R. Martínez Vivot, and L. E. Díaz, “Immobilized chitosan as biosorbent for the removal of Cd(II), Cr(III) and Cr(VI) from aqueous solutions”, Bioresource Technology, 99, 2008, pp. 6538-6544.
[7] H. Alejandro, L. G. Caravelli, and Z. E. Noemí, “Reduction of hexavalent chromium by Sphaerotilus natans a filamentous micro-organism present in activated sludges”, J. of Hazard. Mater., 156, 2008, pp. 214-222.
[8] A. K. Pandey, S. D. Pandey, V. Misra, and A. K. Srimal, “Removal of chromium and reduction of toxicity to
Microtox system from tannery effluent by the use of calcium alginate beads containing humic acid”, Chemosphere, 51, 2003, pp. 329-333.
[9] S. K. Papageorgiou, F. K. Katsaros, E. P. Kouvelos, J. W. Nolan, H. Le Deit, and N. K. Kanellopoulos, “Heavy metal sorption by calcium alginate beads from
Laminaria digitata”, J. Hazard. Mater., 137, 2006, pp.
1765–1772.
[10] L. S. Clesceri, A. E. Greenberg, and A. D. Eation, “Standard methods for the examination of water and wastewater, 20thed.”, Washington DC, 1998, pp. 366-368.
[11] E. Fourest, and B. Volesky, “Contribution of sulphonate groups and alginate to heavy metal biosorption by the dry biomass of Sargassum fluitans”, Environ. Sci. Technol., 30, 1995, pp. 277-282.
[12] S. Schiewer and B, Volesky, “Advances in biosorption of heavy metals. Wiley”, NewYork, 1999, pp. 433-453. [13] I. Langmuir, “The adsorption of gases on plane surfaces of glass mica and platinum”, J. Am. Chem. Soc., 40, 1918, pp. 1361–1403.
[14] H. Freundlich, “Uber die adsorption in loesungen”, J. Phys. Chem., 57, 1906, pp. 385–470.
[15] R. Sips, “On the structure of a catalyst surface”, J. Chem. Phys., 16, 1948, pp. 490–495.
[16] A. Ozer, and D. Ozer, “Comparative study of the biosorption Pb(II), Ni(II) and Cr(VI) ions onto S.cerevisiae: Determination of biosorption heats”, J. of Hazard. Mater., 100, 2003, pp. 219-229.
[17] J. M. Smith, “Chemical engineering kinetics, 3rd ed.”, McGraw-Hill, New-York (1981).
[18] M. D. Misic, Y. Sudo, M. Suzuki, and K. Kawazeo, "Liqiid to particle mass transfer in a stirred batch adsorptiom tank with nonlinear isotherm", J. Chem, Eng. Japan, 15, 1982, pp. 67-70.
[19] Y. H. Ma, and T. Y. Lee, “Transient diffusion in solids with a bipore distribution”, AICHE J., 22, 1976, pp. 147-152.
[20] S. Masamune, and J. M. Smith, “Adsorption rate studies-significance of pore diffusion”, AICHE J., 10, 1964, pp. 246-252.