Abstract— Decision making1 process is a huge and crucial activity that must be given high attention by decision makers and managers as it affects all business strategies in organizations. As a result of the rapid increasing and sustainable needs of organizations, relationship between organizations and suppliers has become essential to any business. In addition to all obstacles that will face the organization when poor decision is made. Decision makers and managers face challenges when they are about to select suppliers, for procurement of raw material and components for their manufacturing process. This paper presents a new hybrid model which combines Linear Weightage and Analytic Hierarchy Process (AHP) Models for supplier selection process. The final decision from this new approach will guarantee better decisions and provide a robust tool for assisting decision makers and managers to make the right decision and select the most suitable supplier. The proposed model has been applied in a real life example and finally ranking the supplier based on their scores obtained from this new approach.
Index terms—Analytical hierarchy process, Decision maker, Hybrid model, linear weightage model, Supplier selection.
I. INTRODUCTION
Today’s global business environment characterized by unprecedented competitive pressures and sophisticated customers that demand speedy solutions. Decision making is one of the crucial activities ever conducted in organizations by managers. It involves multiple participants and required conflicting resolution as well as multiple information sources. The outcomes of decision making process absolutely affect business performance within companies. Therefore, supporting those decision makers is highly recommended and desirable. Quantitative based decisions will always support the managers in their decision making process.
In today’s business context, maintaining supplier relationship is very important to reduce inventory, by introducing new concepts of just in time inventory and continuous replenishment of materials in the form of raw DR.P.D.D Dominic, Emilia Akhasah, and Goh Kim Nee are working as Lecturer in the department of Computer and Information Sciences, Universiti Teknokogi PETRONAS, Bandar Sri Iskandar, 31750 Malaysia (e-mail:dhanapal_d@ petronas.com.my, emeliaakashah@petronas.com.my, [email protected])
material, components or finished products. Organizations have been more concerned about suppliers regarding the rapid increase of purchasing materials and services which have been playing an important role in business process.
In the literature, the importance of purchasing processes can be easily observed. Some researches have mentioned a statistical operation that shows the percentage of the amount of money paid for purchased materials. The authors [1] states that on the average, about 60% of the manufacturer’s sales dollars are paid to supplier for purchased materials. For example, automobile manufacturers spend about 60% of their revenues on material purchases, farm-implement manufacturers spend about 65%, food processors spend about 70%, and oil refineries spend about 80%. It has been estimated that the labour costs represent only about 10 to 15% of production costs in many mass production industries today. From these percentages mentioned above, the importance of purchasing processes can clearly be observed which comes to show that more attention should be given by decision makers towards this critical purchase process as well as selection of suppliers.
Though supplier selection is an old concept starting from 60’s, there are still lot of researches going on in this area. Suppliers are necessary entity to any business, however wrong selection may affect the whole business processes; therefore the process of selecting suppliers is extremely important. According to [2], supplier selection or evaluation is the process of finding the supplier being able to provide customer with the products or services that have the right quality, right price, right quantity, and at the right time. Although purchasing function encompasses various numbers of processes, supplier selection was considered as the most important and critical, and it has been one of the vital research areas. Supplier selection is a multi-criteria problem which includes both qualitative and quantitative factors [3]. Thus, attention should be given to supplier selection problem by decision makers in order to make the right decisions. There are a variety of steps that often decision makers follow in order to make the right decisions and finally be capable of selecting the most appropriate supplier. It is agreed in the literature that supplier selection decision is so complicated and difficult to cope with. According to [4-10] there are various reasons which make supplier selection problem a complex process and the authors used different mathematical model in supplier selection like linear programming, integer programming, mixed integer programming, non linear
The Role of Mathematical Model In Managerial
Decisions- With Special Reference To Supplier
Selection
Dr.P.D.D.Dominic, Emelia Akashah, and Goh Kim Nee
programming, total cost based approach, goal programming and data envelopment analysis etc.
II. LINEAR WEIGHTAGE MODEL
This model is mostly depended upon decision maker’s judgment by assigning weights to the various criteria for the products as well as the suppliers which is the beginning process in decision making. In most cases there are some criteria considered as more important than others, such as product quality, product price, and delivery time. Decision makers should assign weight to each individual criterion in order to determine the relative importance of each one. These weights play a vital role in decision making process and extremely affect the final decision. First of all, decision maker has to identify all criteria that are involved in the certain process before performing any other steps. After identifying all the criteria related to supplier selection decision, decision maker has to determine threshold for each criterion. Generally, threshold can be divided into two types, i.e. maximum and minimum. To establish a threshold to criterion, decision maker should classify all criteria into two groups. The first group known as “larger is better” while the other known as “smaller is better”. For example, the delivery time, the distance between manufacturer and supplier location, and product cost can be categories as “smaller is better” where the threshold for this type of criteria must be maximum. On the other hand, most of the qualitative criteria can be considered as “larger is better” such as warranty, qualities, experience of suppliers, supplier flexibility and technical capability where thresholds must be minimum.
Based on these two conflicting threshold, the decision maker cannot take this directly. The decision maker must do the normalization process to overcome this conflict. The normalization process is explained as follows. Once the attribute is considered as a maximum type of thresholds, formula 1 should be used.
Min Max Vendor Max V − − = max (1) where
V max = vendor value that has maximum type of threshold with respect to a particular attribute/criterion. Vendor = specific vendor that is considered at the time. Max = maximum value of particular attribute/criteria
among all suppliers
Min = minimum value of the same attribute among the whole suppliers.
In the other case when the attribute is classified under the minimum type of threshold, formula 2 is the only option for calculating the vendor’s value.
Min Max Min Vendor V − − =
min (2)
where
Vmin = vendor value that has minimum type of threshold with respect to a particular attribute/criterion. Vendor = specific vendor that is considered at the time.
Max = maximum value of a particular attribute/criterion among all suppliers.
Min = minimum value of the same attribute among the whole suppliers.
The use of these to formulae is explained in the numerical illustration. The idea of using formula 1 and formula 2 is extremely valuable because they provide a method that enables the comparisons among decision criteria. Usually decision criteria have different units of measure so any comparisons among those criteria are not logically acceptable. By using the data normalization concept which was represented in formula 1 and formula 2, all the criteria will be having weights instead of a variety of measurement units and then the comparisons can simply be made.
When all values of the criteria matrix are calculated, series of calculations should be achieved by multiplying weights Wi
of criteria by the whole values Xi within the matrix. The total
score should also be calculated using formula 3 for each vendor which represents the vendors’ scores. The final decision table includes a total score for each supplier and the one who gains the highest score is recommended as the best supplier over all. The limitation of this model is assigning weights to various criteria.
Total
Score
=
∑
W
iX
i∑
W
i (3) III. ANALYTIC HIERARCHY PROCESScriterion with the weight of each supplier. The supplier who obtained the highest score is suggested as the best supplier and decision maker may consider that one as the best decision choice. However, although AHP provides good solution to any problem, the computation and understanding to the decision maker view is difficult.
IV. THE PROPOSED HYBRID MODEL
Based on the previous discussion about both models, there is an urgent need for new model that can support the supplier selection decision and offer a powerful tool which can ultimately produce satisfactory results. This paper intends to achieve this objective by proposing a new hybrid model. This new model concentrates on avoiding all the shortcomings mentioned above. It combines two different aspects from both AHP and linear weightage model. The new model uses the measurement scale of AHP model to determine to which degree each single criterion is preferred in comparison with others. Once the pairwise comparisons have been made, decision maker can obtain the weights of the whole criteria when the relative preference of criteria is specified. The next step in the proposed model is to assign thresholds to all criteria considering “larger is better” or “smaller is better”.
First stage is to obtain preference criteria matrix, by means of identifying various criteria against each other. Make pairwise comparison between the criteria by assigning weights in 1-9 scale. By performing three steps like sum the elements in each column, divide each value by its column total and calculate row averages. Finally by doing all the three steps we can obtain weigtages of each criterion. The second stage is to apply linear weightage model by finding the thresholds from the original supplier data and after normalization process by multiplying the weights obtain from the above process, we can get the final decision table matrix. Calculation of the whole values in the decision table matrix has to be produced by considering the two formulae. If the threshold is maximum then formula 1 should be used, otherwise formula 2 is applied for minimum threshold. When the whole cells that represent each supplier across only
criteria will be filled with a certain value in the decision table matrix, then each column will multiply by the column of criteria weights and obtain the new values of these cells. Now each column represents one of the competitive suppliers, the last step in the proposed model is to compute the sum of each column to get the final scores of all suppliers. The highest score indicates to the best supplier and that supplier will be recommended as the most appropriate supplier among the competitive suppliers.
V. NUMERICAL ILLUSTRATION
The data for this case study have been collected from the procurement department which is accountable for the whole purchasing processes at one of the top university in Malaysia. Interview has been conducted for the purpose of data collection. Eleven suppliers have responded with a quotation representing the prescribe product with their attributes, almost all the supplier got the similar experience with this university and they got interest to be involved in the purchasing process.
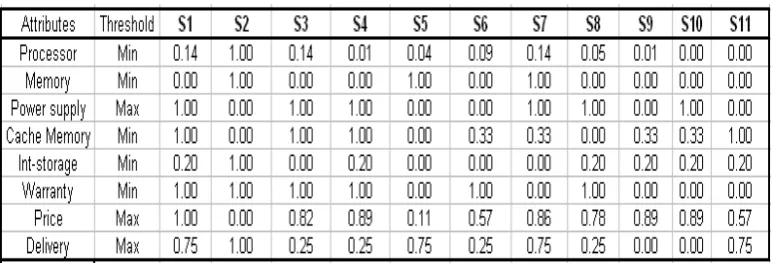
First column in Table 1 shows the criteria of the purchased products which are server devices. These criteria which are involved in the supplier selection process are eight different criteria which describes each product that has been proposed by each supplier. The eight criteria for the server devices are processor, memory, power supply consumption, cache memory, internal storage, warranty, price, and delivery time.
The rest of the columns represent the eleven competitive suppliers. S1 in the third column refers to supplier 1 and S2 in the next column refers to supplier 2 and so on till S11 which refers to supplier 11. Applying the proposed model to supplier selection decision implies that all the steps above have to be followed. Accordingly, the preference criteria matrix was obtained which compare each criterion to the others and Table 2 depicts the preference criteria matrix and gives a glimpse of decision maker’s judgment and preference of criteria in a form of pairwise comparisons.
Table 2 Pairwise comparison preference Criteria Matrix
Processor, memory and price have an equal preference of criteria that is why the cell across each two of them is filled with ones. On other hand, processor speed is more important than the power supply in the first row and four columns is filled with 7 according the AHP measure scale, and thus when compare power to processor it should be 1/7 = 0.14 because it is the opposite comparison. The same concept is followed to fulfill all the pairwise comparisons.
The next step is to obtain the weight for each criterion by normalized the data in Table 2. Three procedures applied to
preference criteria matrix and immediately the weights will be calculated.
1. Sum the elements in each column. 2. Divide each value by its column total. 3. Calculate row averages.
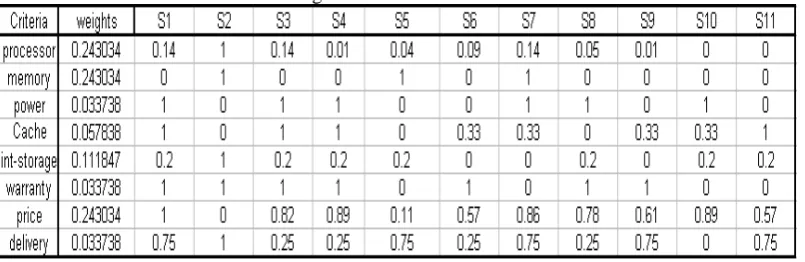
Performing the previous mathematical calculation yields the normalized matrix of criteria as illustrated in Table 3. The average weights of rows are computed in the last column to indicate the weights of the criteria.
Table 3 Weights of each criterion
From the Table 3, the weight for the processor criterion is 0.243034 as well as memory criteria. The weight of internal storage criterion is 0.111847 and so on. The next step in the proposed model is to compute the criteria value matrix using the previous formulae relying upon the thresholds which
[image:4.595.105.492.569.702.2]have already been determined earlier. Once the threshold of a certain criterion is maximum type, thus formula 1 should be applied to compute the value of that criterion with respect to all suppliers.
Table 4 NormalizedCriteria Values Matrix
The arrival of figure 0.14 in Table 4 in the first row and first column under processor speed of supplier 1 is explained as follows.
From Table 1, the processor speed is in GHz, the figures are 1.86, 3.66, 1.86, …., 1.58 of the suppliers s1, s2, s3,…,
s11 respectively. This criteria falls under larger is better, therefore use formula 2.
20352, 48200, …, 32450 of the suppliers s1, s2, …, s11 respectively. Price criteria falls under smaller is better therefore use formula 1.
For s1 we have 48200 – 20352 / 48200 – 20352 = 1.00. Repeating this process for supplier 2 up to supplier 11 gives normalized price for s1 to s11 will be 1.00 to 0.57. The next step in the proposed model is to use the weights column of
[image:5.595.108.511.154.285.2]Table 3 with the whole of Table 4 as shown in Table 5. The last step is to multiply each row of eleven supplier value by the row weight, giving Table 6. Table 6 depicts the final scores of suppliers. The most important thing is regarding the final results, the supplier who has the highest score is suggested as the best supplier for the proposed hybrid model.
Table 5 Weight andCriteria Values Matrix
In accordance with the results generated by the proposed hybrid model, S2 has the highest score of 0.67 in comparison with the rest of potential suppliers. As a result, the proposed hybrid model would recommend S2 as the best supplier
among all suppliers. With the help of the Table 6, we can rank the supplier based on the final score. S7 is second in position.
Table 6 Final Decision Matrix
VI. CONCLUSION
The proposed hybrid model is considered as a robust tool that can assist decision maker in the process of supplier selection. In addition, the proposed model saves time because there are only a few computations to be done. This model is easy to understand and easy to use. Also it saves effort due to its simplicity, and that will strongly accelerate the supplier selection decision as well as improve the whole business processes within organizations in turn.
Other advantage of the proposed model is avoiding the limitation in the linear weightage model which assigns the weights of criteria directly by decision maker based on their experience and gut feeling. The proposed model uses the AHP pairwise comparisons and the measurement 1-9 scale to generate the weights for the criteria. This method provides good solution when compared to human judgment. Thus the proposed model overcomes the absolute dependency on human judgment as in the case of Linear Weightage model. In conclusion, the proposed model can be considered as a powerful model for supplier selection problem. It fully
integrates the advantages of both linear weightage model and AHP approach. From the above supplier selection example, we can conclude that mathematical models are contributing more in managerial decisions.
REFERENCES
[1] Moynihan G. P, Saxena P, and Fonseca D. J, 2006, “Development of a decision support system for procurement operations”, International journal of logistics systems and management, Vol. 2, No. 1, pp. 1-18.
[2] Wei-Kang Wang, Wu Wen, Chang W.B., and Hao-Chen Huang, 2006, “A knowledge-based decision support system for government vendor selection and bidding, JCIS-2006 proceeding, pp.170-176.
[3] Marvin E. G, Gioconda Quesada, and Carlo, 2004, “Determining the importance of supplier selection process in manufacturing: A case study ”, International journal of physical distribution & logistic management, Vol.34, No.6, pp.492-504.
[4] Dongjoo Lee, Tachee Lee, Sue-Kyung, Ok-Ran Jeong, Hyenosang Eom, and Sang-Goo Lee, 2006, “BestChoice: a decision support system for supplier selection e-marketplaces”, The 2nd international workshop on data engineering issues in e-commerce and services DEECS2006, pp.198-208.
conference on management of innovation and technology, volume 2, pp. 827-831,
[6] Hongwei Ding, Lyes Benyoucef, and Xiaollan Xie, 2003, “A simulation-optimization approach using genetic search for supplier selection”, Proceeding of the winter simulation conference, pp. 1260-1267.
[7] Shuo-Yan Chou, and Yao Hui Chang,2008, “A decision support system for supplier selection based on a strategy-aligned fuzzy SMART approach”, Expert system with application- An international journal, Vol. 34, Issue 4, pp.2241-2253.
[8] Reza Mohammady Garfamy, 2006, “A data envelopment analysis approach based on total cost of ownership for supplier selection”, Journal of enterprise information management, Vol. 19, No. 6, pp.662-678.
[9] Ding-Zhong, Lei-Lei Chen, and Mei-Xian Jiang, 2005, “Vendor selection in supply chain system: an approach using fuzzy decision and AHP”, IEEE, International conference on service systems and services management, volume 1, pp.721-725.
[10] Masood A. Badri, and Mohammed H. Abdulla, 2004, “Awards of excellence in institutions of higher education: An AHP approach”, International journal of educational management, Vol.18, No.4, pp.224-242.
[11] Saaty T. L, 1980, The analytic hierarchy process: planning, priority setting, resources allocation. London: McGraw-Hill.
[12] Ozden Bayazit, and Birsen Karpak, 2005, “An AHP application in vendor selection”, ISAHP, pp.1-21.