Constructing Task-Specific Taxonomies for Document Collection Browsing
Hui Yang
Department of Computer Science Georgetown University
37th and O street, NW Washington, DC, 20057
Abstract
Taxonomies can serve as browsing tools for document collections. However, given an ar-bitrary collection, pre-constructed taxonomies could not easily adapt to the specific topic/task present in the collection. This paper explores techniques toquicklyderivetask-specific tax-onomies supporting browsing in arbitrary document collections. The supervised ap-proach directly learns semantic distances from users to propose meaningful task-specific tax-onomies. The approach aims to produce glob-ally optimized taxonomy structures by incor-porating path consistency control and user-generated task specification into the general learning framework. A comparison to state-of-the-art systems and a user study jointly demonstrate that our techniques are highly ef-fective.
1 Introduction
Taxonomies are widely used for knowledge stan-dardization, knowledge sharing, and inferencing in natural language processing (NLP) tasks (Harabagiu et al., 2003; Szpektor et al., 2004). However, an-other common function of taxonomies, browsing, has received little attention in the NLP community. Browsing is the task of exploring and accessing in-formation through a structure, e.g. a hierarchy, built upon a given document collection. In fact, tax-onomies serve as browsing tools in many venues, including the Library of Congress Subject Headings (LCSH, 2011) for the U.S. Library of Congress and the Open Directory Project (ODP, 2011) for about
5% of the entire Web. We call taxonomies support-ing browssupport-ing asbrowsing taxonomies.
When used for browsing, concepts1in taxonomies are linked to documents containing them and taxo-nomic structures are navigated to find particular doc-uments. Users can navigate through a browsing tax-onomy to explore the documents in the collection. A browsing taxonomy benefits information access by providing corpus overview for a document col-lection and allowing more focused reading by pre-senting together documents about the same concept. Most existing browsing taxonomies, such as LCSH and ODP, are manually constructed to sup-port large collections in general domains. Not only their constructions are expensive and slow, but also their structures are static and difficult to adapt to spe-cific tasks. In situations where document collections are given ad-hoc, such as search result organization (Carpineto et al., 2009), email collection exploration (Yang and Callan, 2008), and literature investigation (Chau et al., 2011), existing taxonomies may even not be able to provide the right coverage of concepts. It is necessary to explore ad-hoc (semi-)automatic techniques toquickly derive task-specific browsing taxonomies for arbitrary document collections.
(Hovy, 2002) pointed out that one key challenge in taxonomy construction is multiple perspectives embedded in concepts and relations. One cause for multiple perspectives is the inherent facets in con-cepts, e.g.,jewelriescan be organized bypriceor by
gemstone types. Another cause is task specification
or even personalization. For example, when build-ing a taxonomy for search results of query trip to
1
English terms or entities; usually nouns or noun phrases.
DC, Jane may organize the concepts based onplaces
of interestswhile Tom may organize them based on
dates in visit. Typically, a taxonomy only conveys
one or two perspectives from many choices. It is dif-ficult to decide which perspective should be present. One realistic solution is to leave the decision to the constructor independent of the confusion that comes from facets, task specification or personalization.
When multiple perspectives present in the same taxonomy, it is not uncommon that the per-spectives are mixed. For example, along a
path financial institute→bank→river bank,
finan-cial institute→bank shows one perspective and
bank→river bankshows another. We call this
prob-lempath inconsistency. Many approaches on
auto-matic taxonomy construction suffer from this prob-lem because their foci are on accurately identifying local relations between concept pairs (Etzioni et al., 2005; Pantel and Pennacchiotti, 2006) instead of on global control over the entire taxonomic structure. More recently, approaches attempted to build the full taxonomy structure (Snow et al., 2006; Yang and Callan, 2009; Kozareva and Hovy, 2010), however, few have looked into how to incorporate task speci-fications into taxonomy construction.
In this paper, we extended an existing taxonomy construction approach (Yang and Callan, 2009) to build task-specific taxonomies for document collec-tion browsing. The extension comes in two parts: handling path consistency and incorporating spec-ifications from users. We uniquely employ pair-wise semantic distance as an entry point to incre-mentally build browsing taxonomies. A supervised distance learning algorithm not only allows us to incorporate multiple semantic features to evaluate the proximity between concepts, but also allows us to learn the metric function from personal prefer-ences. Users can thus manually modify the tax-onomies and to some extent teach the algorithm to predict his/her way to organize the concepts. More-over, by minimizing the overall semantic distances among concepts and restricting minimal semantic distances along a path, we find the best hierarchical structure as the browsing taxonomy.
Our contributions include:
- A supervised learning mechanism to capture task-specific or personalized requirements for orga-nizing a browsing taxonomy;
- A strategy to address path inconsistency due to word sense ambiguity and/or mixed perspectives;
- A general scheme to capture user inputs in tax-onomy construction;
- A user study to evaluate the effectiveness of task-specific taxonomies for browsing activities.
2 Related Work
Document collection browsing has been studied as an alternative to the ranked list representation for search results by the Information Retrieval (IR) community. The popular IR approaches include clustering (Cutting et al., 1992) and monothetic con-cept hierarchies (Sanderson and Croft, 1999; Lawrie et al., 2001; Kummamuru et al., 2004; Carpineto et al., 2009). Clustering approaches hierarchically cluster documents in a collection and label the clus-ters. Monothetic approaches organize the concepts into hierarchies and link documents to related con-cepts. Both approaches are mainly based on pure statistics, such as document frequency (Sanderson and Croft, 1999) and conditional probability (Lawrie et al., 2001). The major drawback of these pure statistical approaches is their neglect of semantics among concepts. As an consequence, they often fail to produce semantically meaningful taxonomies.
The NLP community has extensively studied automatic taxonomy construction. Although tra-ditional research on taxonomy construction fo-cuses on extracting local relations between concept pairs (Hearst, 1992; Berland and Charniak, 1999; Ravichandran and Hovy, 2002; Girju et al., 2003; Etzioni et al., 2005; Pantel and Pennacchiotti, 2006; Kozareva et al., 2008), more recent efforts has been made in building full taxonomies. For example, (Snow et al., 2006) proposed to estimate taxonomic structure via maximizing the overall likelihood of a taxonomy. (Kozareva and Hovy, 2010) proposed to connect local concept pairs by finding the longest path in a subsumption graph. Yang and Callan pro-posed the Minimum Evolution (M E) framework to model the semantic distance d(cx, cy) between
concepts cx and cy as a weighted combination of
various lexical, statistical, and semantic features: P
jweightj∗featurej(cx, cy)and estimate the
Researcher also attempted to carve out tax-onomies from existing ones. For example, Stoica et al. (Stoica and Hearst, 2007) managed to extract a browsing taxonomy from hypernym relations within WordNet (Fellbaum, 1998).
To support browsing in arbitrary collections, in this paper, we propose to incorporate task specifica-tion in a taxonomy. One way to achieve it is to define task-specific distances among concepts. Moreover, through controlling distance scores among concepts, we can enforce path consistency in taxonomies. For example, when the distance between financial
in-stitute and river bank is big, the path financial
institute→bank→river bankwill be pruned and the
concepts will be repositioned. Inspired byM E, we take a distance learning approach to deal with path consistency (Section 3) and task specification (Sec-tion 4) in taxonomy construc(Sec-tion.
3 Build Structure-Optimized Taxonomies
This section presents how to automatically build onomies. We take two steps to build browsing tax-onomy for a given document collection. The first step is to extract the concepts and the second is to organize the concepts. For concept extraction, we take a simple but effective approach: (1) We first parse the document collection and exhaustively ex-tract nouns, noun phrases, and named entities that occur >5 times in the collection. (2) We then fil-ter out part-of-speech errors and typos by a Web-based frequency test. In the test, we search each candidate concept in the Google search engine and remove a candidate if it appears <4 times within the top 10 Google snippets. (3) We finally cluster similar concept candidates into groups by Latent Se-mantic Analysis (Bellegarda et al., 1996) and select the candidate with the highesttf idf value within a group to form the concept setC. Although our ex-traction algorithm is very effective with 95% preci-sion and 80% recall in a manual evaluation, some-timesCmay still miss some important concepts for the collection. This can be later corrected by users interactively through adding new concepts (Section 4).
To organize the concepts in C into taxonomic structures, we extend the incremental clustering framework proposed by M E (Yang and Callan,
2009). InM E, concepts are inserted one at a time. At each insertion, a concept cz is at the parent (or
child) position for every existing node in the current taxonomy. The evaluation of the best position de-pends on the semantic distance betweencz and its
temporary child (or parent) node and the semantic distance among all other concepts in the taxonomy. An advantage in M E is that it allows incorporat-ing various constraints to the taxonomic structure. For example, M E can handle concept generality-specificity by learning different semantic distance functions for general concepts which are located at upper levels and specific concepts which are located at lower levels in a taxonomy.
In this section, we introduce a new semantic dis-tance learning method (Section 3.1) and extendM E by controlling path consistency (Section 3.2).
3.1 Estimating Semantic Distances
Pair-wise semantic distances among concepts build the foundation for taxonomy construction. M E models the semantic distanced(cx, cy)between
con-ceptscx andcy as a linear combination of
underly-ing feature functions. Similar to M E, we also as-sume that “there are some underlying feature func-tions that measure semantic dissimilarity for con-cepts and a good semantic distance is a combination of these features”. Different from M E, we model the semantic distance d(cx, cy) between concepts (cx, cy) as a Mahalanobis distance (Mahalanobis,
1936):dcx,cy =
p
Φ(cx, cy)TW−1Φ(cx, xy), where Φ(cx, cy) is the set of underlying feature functions
{φk: (cx, cy)}withk=1,...,|Φ|.W is the weight
ma-trix, whose diagonal values weigh the various fea-ture functions. We use the same set of feafea-tures as proposed inM E.
Mahalanobis distance is a general parametric function widely used in distance metric learning (Yang, 2006). It measures the dissimilarity between two random vectors of the same distribution with a covariance matrix W, which scales the data points from their original values byW1/2. When only di-agonal values of W are taken into account, W is equivalent to assigning weights to different axes in the random vectors.
provides an opportunity to assign different weights for each type of semantic features. (2) When W is properly constrained to be positive semi-definite (PSD) (Bhatia, 2006), a Mahalanobis-formatted dis-tance will be guaranteed to satisfy non-negativity and triangle inequality, which was not addressed in M E. As long as these two conditions are satisfied, one may learn other forms of distance functions to represent a semantic distance.
We can estimateW by minimizing the squared er-rors between training semantic distances dand the expected value dˆ. We also need to constrain W to be PSD to satisfy triangle inequality and non-negativity. The objective function for semantic dis-tance estimation is:
min
W
|C| X
x=1
|C| X
y=1
dcx,cy−
q
Φ(cx, cy)TW−1Φ(cx, cy)
2
subject toW 0
(1)
In this implementation, we used (Sedumi, 2011) and (Yalmip, 2011) to solve the semi-definite program-ming (SDP).
To generate the training semantic distances, we collected 100 hypernym taxonomy fragments from WordNet (Fellbaum, 1998) and ODP. The seman-tic distance for a concept pair(cx, cy) in a training
taxonomy fragment is generated by assuming ev-ery edge is weighted as 1 and summing up the edge weights along the shortest path fromcx tocy in the
taxonomy fragment. In Section 4, we will show how to use user inputs as training data to capture task-specifications in taxonomy construction.
3.2 Enforcing Path Consistency
InM E, the main taxonomy structure optimization framework is based on minimization of overall se-mantic distance among all concepts in the taxonomy and the minimum evolution assumption. We extend the framework by introducing another optimization objective to the framework: path consistency objec-tive. The idea is that in any root-to-leaf path in a tax-onomy, all concepts on the path should be about the same topic or the same perspective. Within a root-to-leaf path, the concepts need to be coherent no mat-ter how far away they are apart. It suggests that a good path’s sum of the semantic distances should be small.
Algorithm: Automatic Taxonomy Optimization.
W= minW
P
x=1
P|N(ctrx)|
y=1 ((dctrx,ctry−
q
Φ(ctrx, ctry)TW−1Φ(ctrx, ctry))2;
foreachcz∈C\S
S←S∪ {cz};
ifW0
d(cz, .) =
p
Φ(cz, .)TW−1Φ(cz,);
R←R∪ {arg minR(cz ,.)(λobjM E+ (1−λ)objpath)};
OutputT(S, R)
Figure 1: An algorithm for taxonomy structure optimiza-tion with path consistency control. Cdenotes the entire concept set,Sthe current concept set, andRthe current relation set. N(ctrx)is the neighborhood of a training conceptctrx, including its parent and child(ten).R(cz, .)
indicates the set of relations between a new conceptcz
and all other existing concepts. T is the taxonomy with concept setSand relation setR.
Therefore, we propose to minimize the sum of se-mantic distances along a root-to-leaf path. Particu-larly, when adding a new conceptczinto an existing
browsing hierarchyT, we try it at different positions inT. At each temporary position, we can calculate the sum of the semantic distances along the root-to-leaf pathPcz that contains the new conceptcx. The
path consistency objective is given by:
objpath= min
Pcz
X
cx,cy∈Pcz,x<y
d(cx, cy) (2)
where x < y defines the order of the concepts to avoid counting the same pair of pair-wise distances twice.
Towards modeling path consistency in taxonomy construction, we introduce a Pareto co-efficientλ∈ [0,1]to control the contributions from objM E, the
overall semantic distance minimization objective as proposed inM E, and objpath, the path distance
min-imization objective. The optmin-imization is:
minλobjM E+ (1−λ)objpath (3)
where objM E = |P
cx,cy∈Cn∪{cz},x<yd(cx, cy)−
P
cx,cy∈Cn,x<yd(cx, cy)|,0≤λ≤1, andC
nis the
concept set afternthconcept is added. Empirically,
we setλ= 0.8.
then finds the optimal position for the concept by minimizing overall semantic distances and path in-consistency, and gradually grows the structure into a full taxonomy.
The order of adding concepts may affect the final taxonomy structure. We hence insert concepts in an arbitrary order with 10 random restarts with differ-ent initial concepts and pick the taxonomy that min-imizes both objectives among all candidate struc-tures.
4 Incorporating Task Specification
This section studies how to incorporate user-defined task specifications in taxonomy construction. Al-though the automatic algorithm proposed in Section 3 is able to well-organize most concepts for a given document collection, it has not yet addressed the is-sue of mixed perspective in taxonomy construction. For concepts with multiple perspectives, we need to decide which perspective is more appropriate for the browsing taxonomy. This task-specific requirement can only be captured by the user/constructor who builds and uses the browsing taxonomy. Moreover, the automatic algorithm relies on training data from WordNet and ODP, which are known for imperfect term organizations such as unbalanced granularity among terms at the same level. To correct the wrong relations learned from imperfect training data, we propose to utilize user inputs in the learning process. Particularly, we formulate taxonomy construction as a user-teaching-machine-learning process. To guide how to organize the concepts, a user trains the supervised distance learning model via a taxon-omy construction interface that allows the user to intuitively modify a taxonomy. The interface sup-ports editing actions such as dragging and dropping, adding, deleting, and renaming nodes. When a user put cx under cy, i.e. cx → cy, this action
indi-cates that the user wants a relation represented by cx → cy to be true in this taxonomy. We did not
expect users to make all the edits. In a human-computer-interaction cycle, a user is not restricted to give a certain number of edits. Based on a user study (Section 5.5), an average number of edits per interaction is 3.6, which can be achieved with ease by most users.
The algorithm shown in Figure 2 provides the
Algorithm: Interactive Taxonomy Construction.
1.T(S, R) =CreateInitialTaxonomy(); 2. U(0)={Unmodified Concepts}=C\S,
G(0)={Modified concepts}=S,M(0)=∅,i= 0; 3. while(not Satisfied) orU(i)6=∅
4. M(i)=CollectManualGuidance(G(i),U(i)); 5. W(i)=LearnDistanceMetricFunction(M(i)); 6. D(i)=PredictDistanceScores(W(i),U(i));
7. (G(i+1),U(i+1)) = UpdateTaxonomy(D(i),U(i),G(i)); 8. i=i+ 1;
9.OutputG(i)as the taxonomy.
Figure 2: Interactive taxonomy construction procedure.
pseudo code for the interactive taxonomy construc-tion procedure. It starts with automatic construcconstruc-tion of initial taxonomies using the techniques presented in Section 3 (Line 1). We then capture the user in-puts asmanual guidance(Line 4) and make use of it to adjust the distance learning model (Line 5), make new predictions for semantic distances of other con-cepts (Line 6), and organize those concon-cepts to agree with the user and update the taxonomy accordingly (Line 7). Line 2 initiates three variables, the unmod-ified conceptsU, the modified conceptsG, and the manual guidanceM, indexed by the iteration num-beri. The process iterates until the user is satisfied with the taxonomy’s organization (Line 3).
Learning and predicting distances have been pre-sented in Section 3.1. In this section, we present how to capture manual guidance (Section 4.1) and update the taxonomies accordingly (Section 4.2).
4.1 Manual Guidance as the Training Data
Taxonomies are tree-structured. It is not trivial to model a taxonomy, especially changes in a taxon-omy, and feed that into a learning algorithm. In this section, we propose a general scheme to cap-ture changes, i.e., user inputs during interactions, in taxonomy construction.
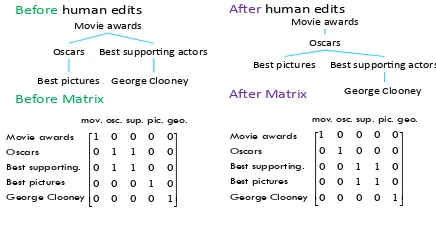
We propose to convert a taxonomy into matrices of neighboring nodes. We compare the changes be-tween a series of snapshots of the changing taxon-omy to identify the user inputs. Specifically, before a user starts editing in an interaction cycle, we repre-sent the organization of concepts as abefore matrix; likewise, after the user finishes all edits in one cy-cle, we represent the new organization of concepts as an after matrix. For both matrices, the (x, y)th
Before human edits
Before Matrix
A3er human edits
A3er Matrix
⎥ ⎥ ⎥ ⎥ ⎥ ⎥ ⎦ ⎤ ⎢ ⎢ ⎢ ⎢ ⎢ ⎢ ⎣ ⎡ 1 0 0 0 0 0 1 0 0 0 0 0 1 1 0 0 0 1 1 0 0 0 0 0 1 ⎥ ⎥ ⎥ ⎥ ⎥ ⎥ ⎦ ⎤ ⎢ ⎢ ⎢ ⎢ ⎢ ⎢ ⎣ ⎡ 1 0 0 0 0 0 1 1 0 0 0 1 1 0 0 0 0 0 1 0 0 0 0 0 1 Movie awards Oscars Best supporting. Best pictures George Clooney
Movie awards
Oscars Best suppor9ng actors
Best pictures George Clooney
Movie awards
Oscars
Best suppor9ng actors Best pictures
George Clooney
mov. osc. sup. pic. geo. mov. osc. sup. pic. geo. Movie awards
[image:6.612.82.300.77.191.2]Oscars Best supporting. Best pictures George Clooney
Figure 3: An example taxonomy before and after human edits (Concepts unchanged; relation type =sibling).
between the concepts. Figure 3 shows an example taxonomy’s before and after matrices.
We define manual guidance M as a submatrix which consists of entries in the after matrix B; at these entries, there exist differences between the
be-fore matrixAand theafter matrixB. Formally,
M =B[r;c]
r ={i:bij −aij 6= 0}
c={j:bij −aij 6= 0}
(4)
whereaij is the(i, j)thentry inA,bij is the(i, j)th
entry inB,r indicates the rows andcindicates the columns.
Note that manual guidance is not simply the matrix difference between A and B. It is part of the after matrix because it is the after matrix that indicates where the user wants the concept hierarchy to develop. The manual guidance for the example shown in Figure 3 is: M = B[2,3,4; 2,3,4] = Oscars Best supporting Best picture
Oscars 1 0 0
Best supporting 0 1 1
Best picture 0 1 1
.
When the user adds or deletes concepts, we ex-pand rows and columns inAandB by filling0for non-diagonal entries and1for diagonal entries. The expanded before and after matrices A0 and B0 are used in the calculation.
For taxonomies with concept changes, we define
manual guidance with concept set changeMchange
as a submatrix which consists of some entries of the
after matrix B; at these entries, there exist
differ-ences from theexpanded before matrixA0 to the
ex-panded after matrixB0. Note that the concepts
cor-responding to these entries should exist in the unex-panded set of concepts. Formally, manual guidance with concept set change
Mchange=B[r0;c0]
r0={i:b0ij−a0ij 6= 0, conceptci∈CB}
c0={j:b0ij−a0ij6= 0, conceptcj∈CB}
(5)
wherea0ij is the(i, j)thentry inA0,b0ijis the(i, j)th
entry inB0, CB is the set of concepts in the
unex-panded after matrix B, r indicates the rows and c indicates the columns.
Based on manual guidance M, we can create training data for the supervised distance learning algorithm (Section 3.1). In particular, we trans-form the manual guidance into a distance matrix D = 1−M, which is used as the training data. The learning algorithm is then able to learn a good model which best preserves the regularity defined by the task and the user. The difference is that the train-ing data here is derived from manual guidance while in the automatic algorithm we use training data from WordNet and ODP.
4.2 Update the Taxonomy
According to the algorithm shown in Figure 2, after learningW(i), the weight matrix at theithiteration, from the manual guidance, we can use it to predict the pair-wise semantic distances for the unmodified concepts and further group them in the taxonomy.
When the pair-wise distance score for a concept pair (cl, cm) is small (<0.5), we consider the
rela-tion between the concept pair is true; when it is big (≥0.5), false. How to organize concepts whose re-lations are true, is decided again by the relation type in the distance matrix. Ifris “sibling”,clandcmare
put under the same parent. Ifr is “is-a”, cm is put
undercl as one of cl’s children. The user interface
then presents the updated taxonomy to the user and waits for the next round of manual guidance.
5 Evaluation
We conduct experiments and a user study to evalu-ate the effectiveness of our approach. We have two goals for the evaluation. One is to evaluate how the browsing taxonomies constructed by our approach compare with those constructed by other baseline systems. Another is to investigate how well our system can learns from task-specifications based on user supervision.
5.1 Datasets
The datasets we used in the evaluation are collec-tions of Web documents crawled for complex search tasks. For each task, we created the dataset by sub-mitting 4 to 5 queries to and collecting the returned Web documents from two search enginesbing.com
andgoogle.com. For example, queries “trip to DC”,
“Washington DC”, “DC”, and “Washington” were submitted for the task “planning a trip to DC”. In to-tal, we created 50 Web datasets on the topics such as
find a good kindergarten,purchase a used car,plan
a trip to DC,how to make a cake,find a good
wed-ding videographer, write a survey paper for health
care systems,find the best deals for a Mother’s day
gift, write a survey paper for social network, write
a survey paper for EU’s finance, andwrite a survey
paper for information technology.
Around 1000 Web documents are collected for each dataset. We filter out spams and advertisements and then search for more relevant Web documents to make the total number 1000. However, not all topics can retrieve 1000 documents. Among all 50 datasets, the average number of documents is 988.5. The average number of unique words in a dataset is 698,875.
5.2 Comparing with Baseline Systems
We compare the following 5 systems.
• Subsumption: the automatic algorithm pro-posed by (Sanderson and Croft, 1999), the most effective state-of-the-art browsing hier-archy construction technique as reported by (Lawrie et al., 2001).
• KH: the automatic taxonomy construction al-gorithm proposed by (Kozareva and Hovy, 2010).
• ME: the automatic taxonomy construction al-gorithm proposed by (Yang and Callan, 2009). This framework does not perform path consis-tency control nor learning from users.
• DistOpt: our automatic taxonomy construction algorithm with path consistency control.
• PDistOpt: our interactive approach with human supervision. The process starts from a flat list of concepts. The user built the browsing taxon-omy from the list in a user study (Section 5.5).
5.3 Browsing Effectiveness
A popular measure to evaluate the quality of the browsing taxonomies is the expected mutual infor-mation measure (EMIM (Lawrie et al., 2001)). It calculates the mutual information between the lan-guage model in a taxonomy T and the language model in a document collectionZ. It is defined as:
I(C;V) = X c∈C,v∈V
P(c, v)log P(c, v) P(c)P(v),
where P(c, v) = P
d∈ZP(d)P(c|d)P(v|d), C is
the set of concepts in T, V is the set of non-stopwords inZ, and dis a document in Z. EMIM only evaluates the content of a browsing taxonomy, not its structure. However, it is still popularly used to indicate how representative a browsing taxonomy is for a document collection.
Table 1 shows the EMIM of the browsing tax-onomies constructed by the five systems under eval-uation. Based on the mean EMIM over the 50 datasets, we can rank the systems in terms of EMIM in the descending order as PDistOpt >> DistOpt >> ME> KH>> Subsumption.2 It shows that DistOpt is the best performingautomaticalgorithm to generate browsing taxonomies. DistOpt is 109% and statistically significantly more effective than ME (p-value<.001, t-test), 159% and statistically significantly more effective than KH (p-value<.001, t-test), and 17 times and statistically significantly more effective than Subsumption (p-value<.001, t-test). It strongly suggests that our techniques are
2
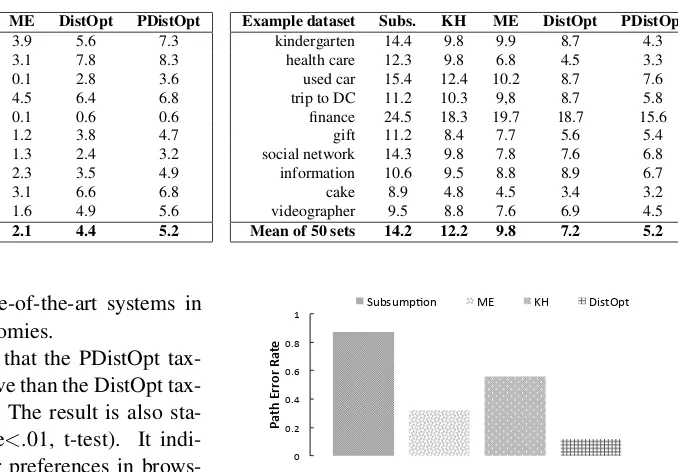
Table 1: Expected Mutual Information (in 1000*EMIM).
Example dataset Subs. KH ME DistOpt PDistOpt
kindergarten 0.4 3.8 3.9 5.6 7.3
health care 0.5 2.8 3.1 7.8 8.3
used car 0.1 0.2 0.1 2.8 3.6
trip to DC 0.2 4.3 4.5 6.4 6.8
finance 0.01 0.01 0.1 0.6 0.6
gift 0.2 1.2 1.2 3.8 4.7
social network 0.1 1.5 1.3 2.4 3.2
information 0.3 1.9 2.3 3.5 4.9
cake 0.2 1.2 3.1 6.6 6.8
videographer 0.4 1.8 1.6 4.9 5.6
Mean of 50 sets 0.24 1.7 2.1 4.4 5.2
more effective than the state-of-the-art systems in constructing browsing taxonomies.
Moreover, Table 1 shows that the PDistOpt onomies is 18% more effective than the DistOpt tax-onomies in terms of EMIM. The result is also sta-tistically significant (p-value<.01, t-test). It indi-cates that incorporating user preferences in brows-ing taxonomy construction is able to produce even more effective browsing taxonomies than all auto-mated methods.
Another popular evaluation measure3 for brows-ing effectiveness is reach time (Carpineto et al., 2009). It is defined as:
treach= 1 |R|
X
di∈R
L(ci) +pi,
whereRis the relevant documents,ciis the concept
that connects to a relevant documentdi,L(ci)is the
path length from the root to reach ci, andpi is the
position thatdi appears in the document cluster
as-sociated withci. Reach time evaluates both the
con-tent and the structure of a browsing taxonomy. This measure needs relevance judgements about a query for the documents organized by the taxonomies. We obtained the relevance judgements by using the ma-jority votes from a user study involving 29 subjects followed by expert reviews. Three experts manu-ally examined the majority votes and reached agree-ments on all relevance judgeagree-ments.
Table 2 elaborates reach time for the systems. Based on the mean reach time over 50 datasets, we obtain a similar ranking of the systems as sug-gested by EMIM. The ranking based on reach time
3Other proposed measures include coverage and
compact-ness (Kummamuru et al., 2004).
Table 2: Reach time.
Example dataset Subs. KH ME DistOpt PDistOpt
kindergarten 14.4 9.8 9.9 8.7 4.3
health care 12.3 9.8 6.8 4.5 3.3
used car 15.4 12.4 10.2 8.7 7.6
trip to DC 11.2 10.3 9,8 8.7 5.8
finance 24.5 18.3 19.7 18.7 15.6
gift 11.2 8.4 7.7 5.6 5.4
social network 14.3 9.8 7.8 7.6 6.8
information 10.6 9.5 8.8 8.9 6.7
cake 8.9 4.8 4.5 3.4 3.2
videographer 9.5 8.8 7.6 6.9 4.5
Mean of 50 sets 14.2 12.2 9.8 7.2 5.2
0 0.2 0.4 0.6 0.8 1
Pa
th
E
rr
or
Ra
te
Subsump/on ME KH DistOpt
Figure 4: Path error rate.
is: PDistOpt >> DistOpt >> ME > KH >> Subsumption. It shows that the best performing automaticsystem is DistOpt, which on average can produce taxonomies to reach a relevant document by visiting only 7.2 nodes, including 5.2 non-leaf con-cepts and 2 documents in the leaf cluster on average. To find all relevant documents in a collection sized around 1000, this reach time is very fast. The in-teractive PDistOpt unsurprisingly gives even better reach time, 5.2 nodes on average.
5.4 Path Consistency
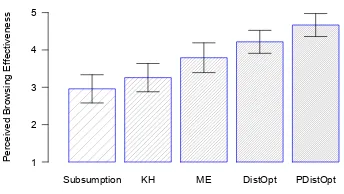
To evaluate how well path consistency is handled, we compare thepath error rategenerated by our ap-proach and by other baseline systems. This evalua-tion is only applied to automatic algorithms.
Subsumption KH ME DistOpt PDistOpt
Pe
rce
ive
d
Bro
w
si
ng
Ef
fe
ct
ive
ne
ss
[image:9.612.91.263.76.173.2]1 2 3 4 5
Figure 5: Perceived browsing effectiveness.
the errors that all assessors agree on and normalizing the sum by the taxonomy size.
Figure 4 shows the path error rate generated by all the automated algorithms under evaluation. We can see that DistOpt produces the least path error. The algorithms can be ranked in terms of the ability to handle path consistency as DistOpt>>ME>> KH>> Subsumption. DistOpt statistically signif-icantly reduces path errors from not using the path consistency control (M E) by 500% (p-value<.001, t-test). It strongly indicates that our technique is ef-fective to maintain path consistency. We conclude that DistOpt best handles path consistency among all the system under evaluation.
5.5 User Study
Besides objective evaluations, we conducted an user study consisting of two parts: qualitative compari-son of the systems under evaluation, and using our taxonomy construction user interface to interactively construct personalized browsing taxonomies.
Twenty-nine (Thirty subjects initially, one was ex-cluded because of incomplete data entry) graduate and undergraduate students from various majors in two universities participated in the study. They were all familiar with use of computers and highly profi-cient in English. Each user study lasted for 4 hours. In the first half of the user study, the participants were first introduced to the taxonomy construction user interface for about 10 minutes to get famil-iar with its functions. After that, the participants performed an exercise task which lasted about 5 minutes and then started the real tasks. For each dataset, the participants were asked to interactively work with PDistOpt to build browsing taxonomies.
Once the real tasks were done, the participants spend 5 minutes to answer a questionnaire regarding their experience and opinions.
In the second half of the user study, we asked the participants to use and compare the provided brows-ing taxonomies with the followbrows-ing task in mind.
Imagine your have a task [task name]. You use a browsing taxonomy designed for the collection of Web documents about this task. Use the browsing taxonomy to find all useful topics for your task. Iden-tify at least one document for each topic.
For each dataset, we asked the participants to rate the browsing taxonomies built by the systems un-der evaluation by answering the following question aboutperceived browsing effectiveness-“How well did the browsing taxonomy help you to complete the
task?”. Ratings in the 5-point Likert-type scale,
ranging from “very good”(5), “good”(4), “fair”(3), “bad”(2), to “trash”(1), are used to rate browsing ef-fectiveness perceived by the participants.
5.5.1 Perceived Browsing Effectiveness
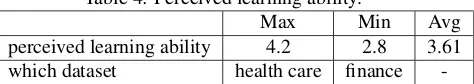
Figure 5 shows the mean and 95% confidence in-terval for the perceived browsing effectiveness for browsing taxonomies constructed by the systems under evaluation. These perceived browsing ef-fectiveness can be ranked in descending order as PDistOpt>>DistOpt>ME>>KH> Subsump-tion. PDistOpt shows the highest mean perceived browsing effectiveness, which is as high as 4.4. Such high rating shows that browsing taxonomy with per-sonalization could well satisfy users’ information needs and are perceived as very effective in brows-ing by the users.
5.5.2 Accuracy of System Predictions
Table 3: Accuracy of system predictions. Max Min Avg accuracy of system predictions 0.98 0.92 0.94
Table 4: Perceived learning ability.
Max Min Avg
perceived learning ability 4.2 2.8 3.61 which dataset health care finance
-to his/her own standard. We calculate the ac-curacy of system predictions as: Accuracy =
1
I
PI
i=1
number of accepted predictions inithcycle
number of predictions inithcycle , where I
is the total number of human-computer interaction cycles when constructing a browsing taxonomy. A high accuracy indicates that the system learns well from user edits. This evaluation is only applied to PDistOpt.
Table 3 shows that for all datasets, the mean ac-curacy of the system predictions is above 0.92. The average value is 0.94. This high accuracy clearly demonstrates that the system successfully learns from a user and makes highly accurate predictions on how the user would organize the concepts.
5.5.3 Perceived Learning Ability
After completing constructing a browsing taxon-omy, a participant was asked immediately to rate how well the system learned from his/her edits. The question was “How well did the system appear to
learn your method of organizing the concepts?”. We
also used the 5-point Likert-type scale to rate this
perceived system learning ability. This evaluation is
only applied to PDistOpt.
Table 4 shows the max, min, and average re-sponses of perceived system learning ability. The mean perceived learning ability is 3.61, with a stan-dard derivation of 0.45. It suggests that the learning ability of the system was only perceived as moder-ately good. This result contradicts with the conclu-sion that we drew based on the more objective mea-sure, accuracy of system prediction (Section 5.5.2).
We further investigate why the participants were only moderately satisfied with the system’s learn-ing ability. From the after session questionnaire, we found that participants thought that some datasets such as “finance” were more difficult than other datasets such as “health care”. For example, the
dataset “finance” was considered by all participants as “very difficult” while “health care” was consid-ered as “very easy”. The participants also com-plained that they were not familiar with the difficult datasets. It is interesting that when a dataset is less familiar for the users, the system was perceived per-forming badly too. It may suggest that when peo-ple are not familiar with the tasks, they provide less promising edits, the system learns from the lower quality training data, and in the end the users per-ceive the output as poor system learning ability.
6 Conclusion
Document collection browsing is another common use of taxonomies. Given an arbitrary collection, a taxonomy must suit the specific domain in order to support browsing. This paper explores techniques
toquickly derive task-specific taxonomies
support-ing browssupport-ing in arbitrary document sets. In par-ticular, we uniquely employ pair-wise semantic dis-tance as an entry point to incrementally build brows-ing taxonomies. The supervised distance learnbrows-ing algorithm not only allows us to incorporate multi-ple semantic features to evaluate the proximity be-tween concepts, but also allows us to learn the met-ric function from personal preferences. Users can thus manually modify the taxonomies and to some extent teach the algorithm to predict his/her way to organize the concepts. Moreover, by minimizing the overall semantic distances among concepts and re-stricting minimal semantic distances along a path, we find the best hierarchical structure as the brows-ing hierarchy. It guarantees that semantically close concepts are put together so that users will have a good idea about why the concepts are put together. This greatly increases the interpretability of a con-structed browsing hierarchy than the existing ap-proaches. This makes our approach more flexible and more general to effectively creating browsing taxonomies to support more complicated and more realistic tasks such as Web information triage.
Acknowledgments
References
J. R. Bellegarda, J. W. Butzberger, Yen-Lu Chow, N. B. Coccaro, and D. Naik. 1996. A novel word clustering algorithm based on latent semantic analysis. In Pro-ceedings of the Acoustics, Speech, and Signal Process-ing, 1996. on Conference Proceedings., 1996 IEEE International Conference - Volume 01, ICASSP ’96, pages 172–175, Washington, DC, USA. IEEE Com-puter Society.
Matthew Berland and Eugene Charniak. 1999. Finding parts in very large corpora. InProceedings of the 27th Annual Meeting for the Association for Computational Linguistics (ACL 1999).
Rajendra Bhatia. 2006. Positive definite matrices (princeton series in applied mathematics). Princeton University Press, December.
Claudio Carpineto, Stefano Mizzaro, Giovanni Romano, and Matteo Snidero. 2009. Mobile information re-trieval with search results clustering: Prototypes and evaluations. Journal of American Society for Informa-tion Science and Technology (JASIST), pages 877–895. Duen Horng Chau, Aniket Kittur, Jason I. Hong, and Christos Faloutsos. 2011. Apolo: making sense of large network data by combining rich user interaction and machine learning. InCHI, pages 167–176. Gouglass R. Cutting, David R. Karger, Jan R. Petersen,
and John W. Tukey. 1992. Scatter/Gather: A cluster-based approach to browsing large document collec-tions. In Proceedings of the fifteenth Annual ACM Conference on Research and Development in Informa-tion Retrieval (SIGIR 1992).
Oren Etzioni, Michael Cafarella, Doug Downey, Ana-Maria Popescu, Tal Shaked, Stephen Soderland, Daniel S. Weld, and Alexander Yates. 2005. Unsu-pervised named-entity extraction from the web: an ex-perimental study. InArtificial Intelligence, 165(1):91-134, June.
Christiane Fellbaum. 1998.WordNet: an electronic lexi-cal database. MIT Press.
Roxana Girju, Adriana Badulescu, and Dan Moldovan. 2003. Learning semantic constraints for the automatic discovery of part-whole relations. InProceedings of the Human Language Technology Conference/Annual Conference of the North American Chapter of the As-sociation for Computational Linguistics (HLT/NAACL 2003).
Sanda M. Harabagiu, Steve J. Maiorano, and Marius A. Pasca. 2003. Open-domain textual question answer-ing techniques. In Natural Language Engineering 9 (3): 1-38.
Marti A. Hearst. 1992. Automatic acquisition of hy-ponyms from large text corpora. In Proceedings of
the 14th International Conference on Computational Linguistics (COLING 1992).
E. H. Hovy. 2002. Comparing Sets of Semantic Re-lations in Ontologies. In R. Green, C. A. Bean, and Myaeng S. H. (eds), editors, The Semantics of Relationships: An Interdisciplinary Perspective. Dor-drecht: Kluwer.
Zornitsa Kozareva and Eduard Hovy. 2010. A semi-supervised method to learn and construct taxonomies using the web. InProceedings of the 2010 Conference on Empirical Methods in Natural Language Process-ing, pages 1110–1118, Cambridge, MA, October. As-sociation for Computational Linguistics.
Zornitsa Kozareva, Ellen Riloff, and Eduard Hovy. 2008. Semantic class learning from the web with hyponym pattern linkage graphs. InProceedings of the 46th An-nual Meeting for the Association for Computational Linguistics (ACL 2008).
Krishna Kummamuru, Rohit Lotlikar, Shourya Roy, Karan Singal, and Raghu Krishnapuram. 2004. A hi-erarchical monothetic document clustering algorithm for summarization and browsing search results. Pro-ceedings of the 13th conference on World Wide Web WWW 04, page 658.
Dawn Lawrie, W. Bruce Croft, and Arnold Rosenberg. 2001. Finding topic words for hierarchical summa-rization. InProceedings of the 24th Annual ACM Con-ference on Research and Development in Information Retrieval (SIGIR 2001), pages 349–357.
LCSH. 2011. Library of congress subject headings.
http://www.loc.gov/.
P. C. Mahalanobis. 1936. On the generalised distance in statistics. InProceedings of the National Institute of Sciences of India 2 (1): 495.
ODP. 2011. Open directory project. http://www.
dmoz.org/.
Patrick Pantel and Marco Pennacchiotti. 2006. Espresso: Leveraging generic patterns for automatically harvest-ing semantic relations. InProceedings of the 44th An-nual Meeting for the Association for Computational Linguistics (ACL 2006).
Deepak Ravichandran and Eduard Hovy. 2002. Learning surface text patterns for a question answering system. InProceedings of the 40th Annual Meeting for the As-sociation for Computational Linguistics (ACL 2002). Mark Sanderson and W. Bruce Croft. 1999. Deriving
concept hierarchies from text. InProceedings of the 22nd Annual International ACM SIGIR Conference on Research and Development in Information Retrieval (SIGIR 1999).
Sedumi. 2011. http://sedumi.mcmaster.ca. Rion Snow, Daniel Jurafsky, and Andrew Y. Ng. 2006.
evi-dence. InProceedings of the 21st International Con-ference on Computational Linguistics and 44th Annual Meeting of the Association for Computational Linguis-tics (ACL/COLING 2006).
Emilia Stoica and Marti A. Hearst. 2007. Automating Creation of Hierarchical Faceted Metadata Structures. In Proceedings of the Human Language Technology Conference (NAACL-HLT).
Idan Szpektor, Hristo Tanev, Ido Dagan, and Bonaventura Coppola. 2004. Scaling web-based acquisition of en-tailment relations. In Proceedings of the Conference on Empirical Methods in Natural Language Process-ing (EMNLP 2004).
Yalmip. 2011. http://users.isy.liu.se/
johanl/yalmip.
Hui Yang and Jamie Callan. 2008. Ontology generation for large email collections. InProceedings of the 8th National Conference on Digital Government Research (Dg.O 2008).
Hui Yang and Jamie Callan. 2009. A metric-based framework for automatic taxonomy induction. In Pro-ceedings of the 47th Annual Meeting for the Associa-tion for ComputaAssocia-tional Linguistics (ACL 2009). Liu Yang. 2006. Distance metric learning: A
com-prehensive survey. http://www.cs.cmu.edu/
˜liuy/frame_survey_v2.pdf.