Abstract— the purpose of this study is to clarify the mechanism of how software engineering capabilities relate to the business performance of IT vendors in Japan. To do this, we developed a structural model using factors related to software engineering, business performance and competitive environment. By analyzing the data collected from 78 major IT vendors in Japan, we found that superior deliverables and business performance were correlated with the effort expended particularly on human resource development, quality assurance, research and development and process improvement.
Index Terms—business performance, competitive environment, software engineering, statistical analysis
I. INTRODUCTION
Many companies that use enterprise software in Japan have not been fully satisfied with the quality, cost, speed and productivity of software that IT vendors deliver. At the same time, IT vendors in Japan are facing drastic changes in their business environment, such as technology innovations and new entrants from China and India. In order for the IT industry in Japan to meet these challenges, an important step is to understand the extent to which software engineering is a core competence for achieving medium- and long-term success.To do so, we designed the research on software engineering capabilities and conducted it in SEE2005 [7].
The objectives of the study were:
- to assess the achievement of software engineering by IT vendors in Japan, and
- to better understand the mechanism of how software
engineering capabilities relate to the business performance of IT vendors.
To achieve these objectives, we developed a new measurement tool called “Software Engineering Excellence (SEE)”, which can evaluate the overall software engineering capabilities of IT vendors from the viewpoint of deliverables,
Manuscript received July 6, 2007.
Yasuo Kadono is with Management Science Institute Inc., 5-31-6 Taishido, Setagaya-ku, Tokyo 154-0004, JAPAN (+81-3-3412-7617; e-mail: [email protected]). He is also with Shibaura Institute of Technology, 5-37-8 Shiba, Minato-ku, Tokyo 108-0014, JAPAN.
Hiroe Tsubaki is with Tsukuba University, 3-29-1 Ohtsuka, Bunkyo-ku, Tokyo 112-0012, JAPAN (e-mail: [email protected]).
Seishiro Tsuruho is with Software Engineering Center, Information-Technology Promotion Agency, Japan, Bunkyo Green Court Center Office, 2-28-8 Honkomagome, Bunkyo-ku, Tokyo 113-6591, JAPAN (e-mail: [email protected]).
project management, quality assurance, process improvement, research and development, human development, and contact with customers. Also, we introduced other indicators: business performance and competitive environment. The competitive environment complements the relationship between SEE and the business performance of the software vendors.
In SEE2005 survey, we analyzed the relationship among software engineering excellence (SEE), business performance and competitive environment basedon the data collected from 55 major IT vendors in Japan. As we confirmed using the path analysis, we found that software engineering excellence (SEE) has a direct positive impact on business performance and that the competitive environment directly as well as indirectly (i.e., via SEE) affects business performance [7].
In SEE2006 survey, we modified the measurement model in SEE 2005 and increased the number of surveyed Japanese IT vendors from 55 to 78 in order to investigate more deeply the impact of software engineering on business performance, as well as the competitive environment. In particular, in this study we focus on the relationship among factors of SEE, the competitive environment, and business performance as measured by operating profit ratio.
II. RESEARCH METHOD
A. Structural Model
We assume the following research questions on the relationship among the three primary indicators (i.e., software engineering, business performance, and competitive environment) in Fig. 1.
Research question 1: the"software engineering excellence
(SEE)" has a positive impact on "business performance".
Research question 2: the "competitive environment"
directly and indirectly (i.e., via SEE) affects "business performance".
Here, “software engineering excellence (SEE)” expresses the extent to which IT vendors can put software engineering into practice. SEE is a measurement tool for evaluating the overall capabilities of software engineering of IT vendors from the viewpoints of deliverables, project management, quality assurance, process improvement, research and development, human development, and contact with customers.
A Survey on Management of
Software Engineering in Japan
Research Question 1 Business performance Software
Engineering Excellence (SEE)
Competitive environment •deliverables
•project management •quality assurance •process improvement •research and development •human development •contact with customer
[image:2.595.48.281.115.219.2]Research Question 2
Fig. 1: Structural model.
“Business performance” expresses the overall business performance of individual IT vendors, such as profitability, growth, and management efficiency. “Competitive environment” expresses the company profile of IT vendors as well as the business environment in which the vendors work, e.g., number of software engineers, business model, and average age of employees.
B. Measurement Model
Our measurement model of software engineering excellence (SEE) was developed through the interviews with over 20 experts in the industry and literary searches [1][3][4][9]. The SEE measurement model has a hierarchical structure with three layers: observed responses, seven detailed concepts, and SEE as a primary indicator, as we developed in our research on IT management effectiveness [5, 6].
The observed responses such as readiness for state-of-the-art technology, moral support, and clarification of user
specification are newly added to the measurement model as a result of feedback from the respondents to SEE2005 and interviews with the experts.
- Software engineering excellence (SEE)
- deliverables: achievement ratio of quality, cost, speed, and productivity
- project management: project monitoring, assistance to project managers, project planning capability, ratio of PMP(Project Management Professional)
- quality assurance: organization, method, review, testing, guideline, management of outsourcers
- process improvement: data collection, improvement of estimation, assessment method, CMM/CMMI [2]
- research and development: strategy, organization, sharing technological skills, learning organization, development methodology, intellectual assets, commoditized software, readiness to state-of-the-art technology,
- human development: training hours, skill development systems, incentive schemes, measure of human development, moral support
- contact with customers: ratio of prime contracts, scope of service offered, direct communication with customer’s top
management, deficit prevention, clarification of user specification
In addition to SEE, we assume two primary indicators, business performance and competitive environment as follows.
- Business performance
- profitability: operating profit ratio - growth: annual sales growth
- management efficiency: return on equity - Competitive environment
- number of software engineers including programmers - average age of employees
- business model: ratio of customized development, ratio of development based on mainframe computer, ratio of prime contractors
- aspirations of senior managers: sales growth orientation, profitability orientation, business model innovation orientation, spirit of challenge
- corporate culture: information sharing and agility
III. SURVEY ON SOFTWARE ENGINEERING EXCELLENCE
To research on the questions in the previous section, we conducted a new survey on Software Engineering Excellence (SEE2006). In this survey, we designed a questionnaire on the practice of software engineering and the nature of the company. This questionnaire was sent to CEOs of 537 major Japanese IT vendors with over 300 employees, and was then distributed to the departments in charge of software engineering. Responses were received from 86 companies and valid responses totaled 78 at SEE2006 (response rate was 15%), while valid responses were 55 at SEE2005 (response rate was 23%). Profitability measured by operating profit ratio of 72 (36) vendors was available at SEE2006 (SEE2005).
The measurement model in the previous section is fitted to the data by confirmatory factor analyses to estimate the scores of software engineering excellence (SEE) in the same way as we developed at SEE2005 [7].
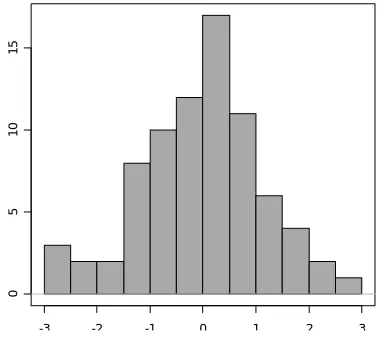
Fig. 2: Histogram of deviations of SEE.
-3 -2 -1 0 1 2 3
0
5
10
[image:2.595.335.524.547.718.2]Fig. 2 shows a histogram of the deviations of software engineering excellence (SEE) of 78 IT vendors. We consider that the result of SEE analysis is appropriate for further analyses since some scores of SEE are reasonable in light of the results of the interviews with the individual respondents and since the histogram has an almost unimodal distribution.
Fig. 3 is a box-and-whisker plots which shows that the median software engineering excellence (SEE) of vendors who were originally users of IT (2) is higher than that of vendors who were originally makers of IT (1). Also, the median SEE of vendors who were originally vendors of IT (1) is higher than that of independent vendors (3). However, the maximum SEE of 3 is higher than that of 2. This tendency in SEE206 is the same as that in SEE2005 except the slight order reversal of the median SEE between 1 and 2.
[image:3.595.73.248.289.486.2]SEE
Fig. 3: SEE by origin of vendors (1: makers, 2: users, 3: independent).
[image:3.595.327.527.482.698.2]The median achievement ratios of quality, cost, and delivery are higher than 70% (Fig 4). Achievement level of delivery is the highest of quality, cost, and delivery. This tendency was also observed in the previous study at SEE2005 [7].
Fig. 4: Achievement ratio of quality, cost, and delivery. Regarding training hours, the medium hours for new recruits is almost 500 hours per year, while the medium
hours for software engineers except new recruits is 40 hours per year (Fig.5 ).
Fig. 5: Training hours.
(left side: new recruits, right side: except new recruits)
IV. PRELIMINARY ANALYSES
To construct a path model analysis on the research questions in the next section, we conducted the following preliminary analyses of relationship among indicators such as SEE, business performance, and competitive environment.
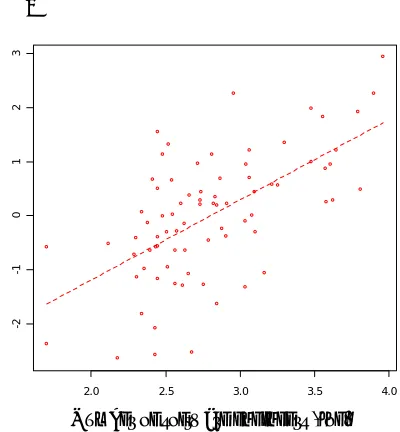
Fig. 6 shows that vendors who have a larger number of software engineers tend to score higher for software engineering excellence (SEE). This tendency was similar to that of the previous study at SEE2005 [7].
SEE
Number of software engineers (log)
Fig. 6: Relationship between number of software engineers and software engineering excellence
2.0 2.5 3.0 3.5 4.0
-2
-1
0
1
2
3
0
2
04
0
6
08
0
X2
.1C
.I
0
2
04
06
08
0
1
0
0
X2
.1D
.I
0
2
04
0
6
08
0
X2
.1Q
.I
0
20
0
400
60
0
800
10
00
新
人
研
修
X2
.6
2
0
4
0
60
80
100
120
研
修
X2
.6
S
E
1 2 3
-2
-1
0
1
2
[image:3.595.57.277.564.678.2]Fig. 7 shows that vendors whose employees are older tend to score higher for software engineering excellence (SEE).
SEE
[image:4.595.327.527.182.392.2]Average age of employees
Fig. 7: Relationship between average age of employees and SEE.
Fig. 8 shows that vendors who develop more custom software tend to score lower for software engineering excellence (SEE).
SEE
0 20 40 60 80 100
-2
-1
0
1
2
3
[image:4.595.65.272.471.688.2]Ratio of custom development
Fig. 8: Relationship between ratio of custom development and SEE.
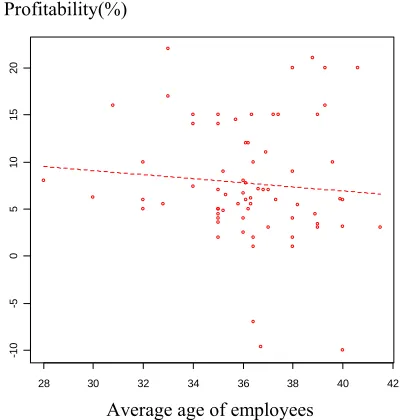
Fig. 9 shows that vendors whose employees are older tend to be less profitable. This relationship is weaker than that of the previous study at SEE2005. The reason for this change is thought to be recovery of revenue as well as rejuvenation of the software industry in Japan. However, we need further investigation of the reasons.
Profitability(%)
Average age of employees
Fig. 9: Relationship between average age of employees and profitability.
Fig. 10 shows that vendors who have a higher software engineering excellence (SEE) tend to be slightly more profitable (i.e., higher operating profit ratio) based on the 72 vendors whose data of business performance is available.
Profitability(%)
SEE
Fig. 10:Relationship between SEE and profitability.
-2 -1 0 1 2 3
-10
-5
0
5
1
0
1
5
2
0
28 30 32 34 36 38 40 42
-1
0
-5
0
5
1
0
1
5
2
0
28 30 32 34 36 38 40 42
-2
-1
0
1
2
[image:4.595.333.524.512.723.2]V. PATH MODEL ANALYSIS
On the basis of the results of the preliminary analyses, we constructed a path model that consists of all seven factors of software engineering excellence (SEE) as well as the selected factors for business performance and competitive environment in section 2, owing to the constraints of sample size, statistical significance, and realistic interpretation, e.g., average age of employees, number of software engineers, ratio of development based on mainframe computer, ratio of prime contractors, ratio of manufacturer customers, and ratio of operating profit.
By a trial and error method, we succeeded in constructing a well-fitted path model (CFI = 1.0), where all the existing path coefficients are significant at the 5% level (Fig. 11 and Fig.12).
human development
quality assurance
project management
process improvement
contact with customer
research and development
deliverables
Ratio of operating profit
[image:5.595.62.274.272.419.2]Positive effect Negative effect
[image:5.595.44.295.477.740.2]Fig. 11:Result of path analysis among factors of SEE and business performance.
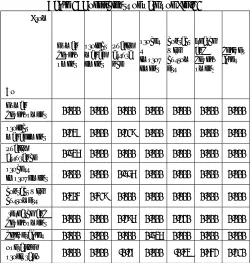
Table 1: Coefficients of paths of Fig.11
From
To
human develo pment
project manag ement
quality assura nce
proces s improv ement
contact with custom ers
esearch and develo pment
deliver ables
human
development 0.000 0.000 0.000 0.000 0.000 0.000 0.000 project
management 0.237 0.000 0.219 0.000 0.000 0.000 0.000 quality
assurance 0.536 0.000 0.000 0.000 0.000 0.000 0.000 process
improvement 0.000 0.000 0.556 0.000 0.000 0.000 0.000 contact with
customers 0.304 0.419 0.000 0.000 0.000 0.000 0.000 research and
development 0.000 0.000 0.296 0.000 0.220 0.000 0.000 deliverables 0.000 0.000 0.000 0.536 0.000 0.000 0.000 operating
profit ratio 0.000 0.000 -0.27 0.000 -0.33 0.642 0.210
Regarding the research question 1 in section 2, i.e., the relationship among factors of SEE and business performance measured by operating profit ratio, we found the following (Fig. 11, Table1):
- Within the SEE factors, human development is positioned in the uppermost stream.
- Human development has positive impact on quality assurance, project management and customer contact. - Quality assurance has a direct negative impact on the
operating profit ratio. This suggests that the cost of quality assurance does not pay off.
- However, indirectly quality assurance has positive impact on the ratio of operating profit via the positive influence of process improvement, deliverables, and research and development.
- Research and development has positive impact on the ratio of operating profit directly. This tendency is similar to the result of the previous study at SEE2005 [7]. - Process improvement has positive impact on the ratio of
operating profit via deliverables. This effect of process improvement is the same as that of the previous study.
Ratio of prime contractor Ratio of custom development
Number of SE
Ratio of development on MF
Ratio of manufacturer Customers Average age of employees
human development
quality assurance
project management
process improvement
contact with customer
research and development
deliverables
Ratio of operating profit Positive effect Negative effect
Fig. 12:Result of path analysis among factors of competitive environment, factors of SEE and business performance. Similarly, in terms of the research question 2 in section 2, i.e., the relationship among factors of competitive environment, factors of SEE, and business performance measured by the ratio of operating profit, by using a trial and error method, we succeeded in constructing a well-fitted path model (CFI = 1.0), where all the existing path coefficients are significant at the 5% level. We found the following direct influences (Fig.12, Table2):
- The number of software engineers positively affects human development, research and development, quality assurance, and project management, while the number of software engineers negatively influences the ratio of operating profit.
[image:5.595.45.293.479.744.2]on deliverables, while it has negative impact on human development and research and development.
- The ratio of prime contractor has positive impact on customer contact, quality assurance, and research and development.
- Average age of employees has positive impact on research and development, while it has negative impact on deliverables.
[image:6.595.44.292.243.504.2]- The ratio of development based on mainframe computer has positive impact on process improvement and project management, while it has negative impact on deliverables, the ratio of operating profit, and customer contact.
Table 2: Coefficients of paths of Fig.12
From
To
ratio of custom ized develo pment
ratio of prime contra ctors
number of software engineer s
ratio of develop ment based on mainfra me computer
average age of employe es
ratio of manuf acturer custo mers
human
development -0.267 0.000 0.569 0.000 0.000 -0.167 project
management 0.000 0.000 0.243 0.153 0.000 0.000 quality
assurance 0.000 0.115 0.265 0.000 0.000 0.000 process
improvement 0.000 0.000 0.000 0.213 0.000 0.000 contact with
customers 0.000 0.149 0.000 -0.153 0.000 0.000 research and
development -0.170 0.099 0.399 0.000 0.097 0.000 deliverables 0.212 0.000 0.000 -0.277 -0.168 0.000 operating
profit ratio 0.000 0.000 -0.286 -0.229 0.000 0.000
The above observations suggest that improving software engineering excellence (SEE) is a significant method of improving the profitability of IT software vendors in Japan. Also, improving SEE depends on the competitive environment, as well as the nature of the individual software vendors, such as the number of the vendor’s software engineers, the ratio of prime contractors, and the ratio of customized development.
VI. CONCLUSION
In this study, we analyzed the relationship among software engineering excellence (SEE), business performance and competitive environment based on the data collected from 78 major IT vendors in Japan. As we confirmed using the path model, we found that human development, research and development, and process improvement mostly improve deliverables and the profitability of the software vendors. In addition, the competitive environment, such as the number of software engineers, the average age of employees, and the
business model should be considered for the further growth of the software industry in Japan.
To better understand the reality and issues facing Japan’s software industry in the medium- and long-term, we suggest that future studies be conducted as follows:
- further refinement of the measurement model and analysis of the cause-and-effect relationships in more detail, - further analysis by types of vendors, e.g., vendors from makers, vendors from users, and independent vendors, - data collection over a wider range of IT vendors,
- global benchmarking, and - time series analysis.
ACKNOWLEDGMENT
The authors gratefully acknowledge the valuable suggestions and support of the Ministry of Economy, Trade and Industry, Software Engineering Center, Information-Technology Promotion Agency, Japan.
REFERENCES
[1] Erik Brynjolfsson, (2004) Intangible Asset, Diamond.
[2] Carnegie Mellon University, Software Engineering Institute, http://www.sei.cmu.edu/cmmi/.
[3] Micheal A. Cusumano, (2004) The Business of Software, Free Press.
[4] Takahiro Fujimoto, (2003) Nouryoku Kouchiku Kyousou,
Chuohkouronshinsya (in Japanese).
[5] Yasuo Kadono, (2004) Evolution of IT Management Creating Business Value, Nikkagiren.
[6] Yasuo Kadono, Hiroe Tsubaki, (2006) “Development of IT Management Effectiveness and Analyses of Japanese Companies,” Journal of Japanese Association for Management Information, Vol.14, No.4, pp.69-83.
[7] Kadono, Y., H. Tsubaki, and S. Tsuruho (2006). “A Study on the Reality and Economy of Software Development in Japan,” The sixth Asia Pacific Industrial Engineering Management Systems Conference, Bangkok, Thailand, pp.1425-1433.
[8] Yoshihiro Matsumoto, (2005) Application of SWEBOK to Software Development, Ohmsha.
[9] Ministry of Economy, Trade and Industry, (2005) Report on Software Industry.