Evolution of Solidification Structures in Fe-Mn-Si-Cr Shape Memory Alloy
in Centrifugal Casting
Kenichiro Ito
1, Ryoji Sahara
2, Susan Farjami
3, Tadakatsu Maruyama
4and Hiroshi Kubo
51
Honda R&D Co. Ltd., 4630 Shimotakanezawa, Haga-gun, Tochigi 321-3393, Japan
2Institute for Materials Research, Tohoku University, Sendai 980-8577, Japan
3Department of Materials Science, Graduate School of Engineering, Tohoku University, Sendai 980-8579, Japan 4Awaji Sangyo KK, Tokyo 101-0052, Japan
5Kanto Polytechnic University, Oyama 323-0810, Japan
In aiming at obtaining thin columnar structures in the centrifugal casting of Fe-28Mn-6Si-5Cr (mass%) shape memory alloy (SMA), evolution of solidified macroscopic structures is investigated by solidification experiments and simulation using a coupled finite volume-cellular automaton (FV-CA) model.
In the temperature gradient-crystal growth rate (G-V) diagram of solidification, the columnar to equi-axed transition (CET) line that indicates the boundary of two different structural regions is identified from the simulation calculation. The macroscopic structure of joining pipes of Fe-28Mn-6Si-5Cr SMA produced by centrifugal casting is elucidated to reside in a deep region of columnar structure in the G-V diagram. It is concluded that finer columnar structure could be obtained by increasing the rotation speed of centrifugal casting mould and by increasing the cooling rate of the casting. [doi:10.2320/matertrans.47.1584]
(Received January 16, 2006; Accepted April 4, 2006; Published June 15, 2006)
Keywords: simulation, centrifugal casting, shape memory alloys (SMA), cellular automaton, finite volume method
1. Introduction
The shape memory effect in Fe-28Mn-6Si-5Cr (mass%) shape memory alloys (SMA) is explained by the phase transition between austenite () and martensite (") phase. The phase transition fromto"phase is provoked when stress is applied, and the reverse transformation occurs by heating the deformed material to an appropriate high temperature (As
temperature). Utilizing such potential characters of one-way shape recovery, the Fe-based SMA has recently gained much attention in applying to the pipe joining of large curved pipes in civil engineering and heavy duty joint components in railway construction.1) However, the industrial application
requires the shape recovery strain over 3.0% and the proof stress more than 350 MPa at 0.2% strain, while those of the product materials are 2.5% and 300 MPa, respectively, at the present stage. The centrifugal casting method has been adopted in aiming at producing large size of SMA pipes with low cost. To our surprise, the pipes made by such casting methods have frequently exhibited better shape recovery strain (3%) than those made through rolling and forging processes.2,3) The enhancement of shape recovery effect in
the cast SMA is originated in the developed columnar structure, which has been formed by uni-directional solid-ification in casting.4,5) Since then, various efforts have been
made in the centrifugal casting of Fe-based SMA to make more perfect materials with less segregation of minor elements such as P and C, less cavities and thin joining tubes. On the other hand, computer simulation offers one of the powerful tools to predict the transformation. Since Rappaz and Gandin6,7) suggested a coupled FV (finite volume)-CA (cellular automaton) model to predict the textures in recrystallization, it has been frequently used to predict the evolution of macroscopic structures of solidification. In the coupled FV-CA model, continuum space is first divided into a finite volume mesh (order of100mm size mesh) so that the
macroscopic heat transfer can be treated. This so called a ‘macroscopic heat transfer mesh’ is further divided into microscopic mesh of CA model (order of 101mm size mesh) that can describe the nucleation and nucleus growth. Several studies based on the coupled FV-CA model have already been made on the evolution of solidification structures in casting processes.6–12)
In the present paper, we estimate the macroscopic heat transfer using the FV model, and investigate the evolution of solidification structures using the coupled FV-CA model. One of the objectives in the present paper is, therefore, to establish the simulation method which describes the evolu-tion of solidificaevolu-tion structures in the centrifugal casting of Fe-28Mn-6Si-5Cr SMA. Another objective is to describe the columnar to equi-axed phase transition (CET) in the Fe-28Mn-6Si-5Cr SMA. By identifying the position of the CET line in G-V (temperature gradient-crystal growth rate) diagram of solidification, we can derive the processing conditions of obtaining thin columnar structures and check the present process. For example, the conditions such as cooling rate of the casting and heat transfer across the interface between the mould and casting are significant for obtaining a fine columnar structure.
2. Principles of Simulation
In order to simulate the evolution of macroscopic structures of cast alloys, the coupled CA-FV model is used. To feed back the released latent heat from CA mode (nucleation and growth) into the FV mode (macroscopic heat transfer), two methods have frequently been used. They are ‘‘full coupling method’’ where the temperature of FV mesh
TTtþt is recovered after estimating the increment of solid fraction in all microscopic CA meshes, and ‘‘weak coupling method’’ where the FV mode is carried out by taking into account the temperature increment Tit;LH, beforehand, by
the hypothetical solidification in FV mesh. The CA mode calculation is followed after the FV mode (macroscopic heat transfer) stimulation. In the present paper, we have also used either full coupling method or weak coupling method depending on the target of calculation (see Table 3).
Only the enthalpy formulation method is applied in this study, because our preliminary calculations show the results obtained by using temperature recovery method are often diversified. This divergence often occurs in a system of large latent heat release as will be described in section 4.1. Meanwhile, to describe the amount of the heat transfer as quantitatively as possible, we have applied the thermody-namical calculation using the ‘Thermo-Calc’ software. The equilibrium solid fraction fsðTÞis estimated in the Fe-28Mn-6Si-5Cr (mass%) SMA system and it is rewritten relative to both the enthalpy of transformation and the corresponding temperature difference.
2.1 Macroscopic heat transfer calculation with FV mesh
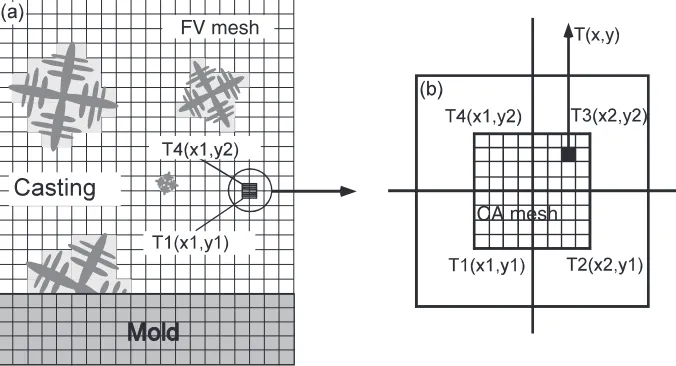
Schematic diagram of FV model is illustrated in Fig. 1(a). The mould and the casting are divided into FV meshes (macroscopic heat transfer mesh). The temperature of each FV mesh is represented by the temperature of the center of the mesh as shown in Fig. 1(b). This FV model has been widely applied to the solidification analysis of casting because the heat transfer in each mesh can be simply expressed by considering the thermal income and expendi-ture, and it can also be applied to the complicated shapes of the casting mould. Applying the energy conservation law at the i-th mesh, we get the following differential equation of the heat transfer%CpðTitþtT
t iÞ:
%CpTitþt¼%CpTitþ
t Vi
X
k
AkðTktT t iÞ
xi
2i
þ1 hi
þxk
2k ; ð1Þ
where%is density,Cpis volumetric specific heat,tis time step, Tt
i is temperature of i-th FV mesh at time t, Tkt is temperature of the FV mesh surrounding i-th mesh, Vi is volume ofi-th mesh,Akis contact area betweenk-th andi-th mesh,xis interval of FV mesh,iis thermal conductivity in macroscopic FV mesh, and hð¼1=RÞ is heat transfer coefficient at the interface.
The physical constants used for the heat transfer calcu-lation mode are tabulated in Table 1, where Al-7 mass%Si alloy is also cited along with Fe-28Mn-6Si-5Cr SMA because it is referred as a reference material for simulation.
2.2 Nucleation
The FV meshes of Fig. 1(a) are further divided into finer meshes that are called CA meshes as shown in Fig. 1(b). Each CA mesh is supposed to have its own physical characteristics: temperature, volume fraction of solid, pref-erential growth direction of nucleus and the state of solid (f) or liquid (l) are defined in each CA mesh. They are evolved by a much finer time step compared with FV mode.
Using the CA model, nucleation and nucleus growth are processed as follows: At the start of the calculation, we have fixed the nucleation site in a manner that; (1) the maximum numerical value of the nucleus density nmax is distributed randomly among all the CA meshes, (2) undercooling temperatures for nucleation where the nucleation rate is supposed to obey a Gaussian distribution are randomly
CA mesh FV mesh
[image:2.595.129.467.74.257.2]Fig. 1 Schematic diagram of FV-CA model.
Table 1 Physical parameters used for heat transfer calculation.
i: thermal
conductivity %: density
Cp: volumic
specific heat
Hi: latent
heat
Tl: liquidus
temp.
Tf: solidus
temp.
Ti: initial
temp.
W/mK kg/m3 J/m3K J/m3 K K K
Fe-based SMA 8.37 7:45103 5:42106 1:05108 1517 1234 1773
Ai-7Si 90 2:69103 2:6106 9:8108 893 853 973
Metal mould 4:86101 7:86103 4:08106 — — — 293
[image:2.595.49.549.308.396.2]distributed among the CA meshes selected in the step (1),13) and (3) preferential growth direction h10i is randomly distributed among the selected CA meshes. Since the direction of the preferential growth is four-fold symmetry in the square lattice, the distribution of preferential growth direction is made by taking into account the crystal symmetry. The area of casting is divided into 10 sections within45and 45of the crystal axes, and the preferential
growth direction is distributed randomly in each section. It is assumed, in the present simulation, that the nucleation rate follows the Gaussian distribution as indicated by Thevoz et al.,14)
dn
dðTiÞ
¼ ffiffiffiffiffiffini;max
2
p
Ti;
exp 1
2
ðTiTi;nucÞ2
ðTi;Þ2
; ð2Þ
where Ti¼TlTi (i¼s: on surface, i¼b: in bulk) indicates undercooling temperature from the critical (solid-ification) temperature Tl, the nucleation rate at temperature
Tiis expressed asdn=dðTiÞ, the symbolTi;nucis average undercooling temperature of the nucleation,Ti;represents dispersion in the Gaussian distribution, that is, the width of the Gaussian distribution function at the half point of the maximum value ni;max=ð
ffiffiffiffiffiffi
2
p
Ti;Þ, and ni;max is maximum nucleus density. Since the macroscopic structure at the surface of the casting is different from that of the inside of the bulk, it is assumed that the heterogeneous nucleation and nucleus growth on the wall of the mould occur independently from inside of the bulk.
The nucleus density,nðTiÞ, is expressed by the equation,
nðTiÞ ¼ Z Ti
0
dn dðTiÞ
dðTiÞ: ð3Þ
The macroscopic temperature fields determined by the heat transfer calculations are interpolated into every CA meshes. When the temperature at a particular CA mesh becomes lower than the defined critical undercooling temperature where nucleation occurs, the nucleation process will be performed in computer by (1) changing the liquid state (l) into solid state (f), and (2) by starting from vanishing the volume of nucleus.
2.3 Nucleus growth
Once nucleation occurs, it will grow along a preferential crystallographic direction. At this stage, the growth of a dendrite tip and the change in the solid fraction can be estimated. According to the expression proposed by Gandin et al.,15)the amount of the dendrite tip growth (tip radius R)
in one time step along the preferential growth directionsh10i
is expressed as vðTt
i;RÞt, v being the growth rate of dendrite. The distanceLt11þt from the center of CA mesh to the surface of {11} plane at the timetþtis represented as,
Lt11þt¼Lt11þ 1ffiffiffi
2
p vðTit;RÞt: ð4Þ
After the model of Kurz, Giovanola and Trivedi (KGT model),16)the undercooling temperature at the dendrite tip can be obtained from the local balance of constituting elements at the solid-liquid interface and the mechanical stability condition as follows,
Tit;R¼mc0
1 1 ð1kÞIvðPeÞ
þ2
R ; ð5Þ
wheremis the slope of the liquidus line in equilibrium phase diagram,c0is solute composition, to which 28 mass% Mn is adopted in the present study,kis partition coefficient,Ris the dendrite tip radius andis the Gibbs–Thomson parameter.
The symbolIv(Pe) in eq. (5) is Ivantsov function andPeis Peclet number expressed in terms of growth rate V¼
ðTt
i;RÞof solid-liquid interface and diffusion coefficientD as follows,
Pc¼
V
D
mGcG
1
2
; VðTit;RÞ; ð6Þ
whereGc is composition gradient of solutes at the interface andGis average temperature gradient. Thus, the growth rate ðTt
i;RÞof the dendrite tip can be obtained in the analytical calculation, once the undercooling temperature Tt
i;R is obtained through eqs. (5) and (6). However, in the present paper, the following approximation of a polynomial equation is introduced to reduce the large amount of calculations of eqs. (5) and (6).
vðTit;RÞ ¼2:92103Tit;R2þ6:24104Tit;R3: ð7Þ
When the nucleus continues to grow according to eq. (7), the nearest neighbor CA meshes will be captured into grown solid phase (dendrite). If the nearest neighbor CA mesh is in a liquid state, the state number is changed from liquid (l) to solid (f) phase. The area which delimits the dendrite envelope continues to grow and touches to the nearest neighbor centers. After then, the growth mode is succeeded to the one controlled by these nearest neighbor meshes. The material constants used for the calculation of crystal growth rate are tabulated in Table 2.
2.4 Coupling of FV mode with CA mode
In the present study, the full coupling method and the weak coupling method are alternatively combined with the enthalpy formulation method. We call these as ‘‘enthalpy formulation-full coupling method’’ and ‘‘enthalpy formula-tion-weak coupling method’’.
The temperatureTCAðx;yÞatðx;yÞposition in the CA mesh is estimated by interpolating the macroscopic temperature field that is consisted of four heat transfer meshes as shown in Fig. 1(b).
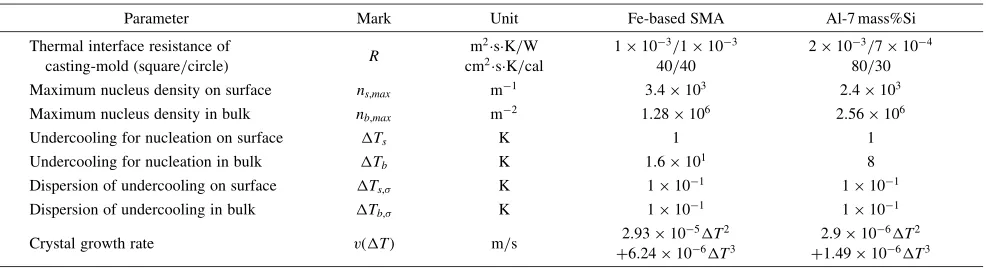
TCAt ðx;yÞ ¼ ð1tÞ ð1uÞ T1tþt ð1uÞ T2tþtuT3tþ ð1tÞ uT4t; ð8Þ
t xX1 X2X1
; u yY1
Y2Y1
; ð9Þ
[image:3.595.305.549.94.172.2]whereTit(i¼1{4) is the temperatures at the center of the FV meshes, Xi;Yi (i¼1{2) are the coordinates of the FV meshes.
Table 2 Numerical values used for the calculation of dendrite tip growth in molten alloys.
D(m2/s) (mK) k m(K/mass%) c
[image:3.595.336.546.688.747.2]The enthalpy of the CA mesh can be estimated from the macroscopic enthalpy change in a similar way as the interpolation of temperature TCAðx;yÞ in CA mesh. In the enthalpy formulation-full coupling method, solid fraction calculations are made over all the CA meshes. The total released latent heat is estimated by summing up the solid phase fraction ftþt
s ðTCAt Þ in each mesh over all the CA meshes as follows,
TFVtþt ¼TFVt þ
X
fst;þCAtðTCAt ÞSCA
SFV
Hf %CP
; ð10Þ
where the summation is carried out over all CA meshes in the FV mesh, andSCA andSFV are the surface area of CA mesh and FV mesh, respectively.
In the weak coupling method, on the other hand, the macroscopic heat transfer is carried out by taking account of the temperature incrementTt
i;LH, beforehand, by the hypo-thetical solidification in FV mesh. The CA mode calculation is followed after the FV mode (macroscopic heat transfer) stimulation.
The solid fractionfsðTitÞin the solidification process has often been estimated using Scheil equation which is derived under assumptions of no diffusion in solid and homogeneous solute concentration in liquid. However, in the present investigation of the Fe-28Mn-6Si-5Cr SMA system, the relationship between the solid fraction fsðTitÞ and the temperature Tit is obtained from the thermodynamical calculation using the ‘Thermo-Calc’ software. Figure 2 shows the estimated solid fraction fsðTitÞ at equilibrium
obtained using Thermo-Calc and the solid fraction obtained by Scheil equation.
3. Experiments of Casting and Parameters Fitting
3.1 Metal mould casting
In our simulation of heat transfer and solidification, some parameters can hardly be estimated in the analytical way. They have been identified from experiments or by comparing the results of computer simulation to the experiment.
Experimental data have been prepared to obtain proper values of parameters required in the simulation. The Fe-28Mn-6Si-5Cr SMA and the reference material of Al-7 mass%Si alloy were cast into the metal mould in cylindrical shape and square shape. The cooling curves were recorded at 7.5, 12.5, 17.5 and 22.5 mm apart from the mould wall in the molten side of the casting. The parameter of thermal interface resistance R (¼1=h) shown at the interface between the casting and the mould can be obtained solely from the experimental data of cooling rate.
The macroscopic structures of cast alloys were observed using optical microscope and were compared with the simulation results. The morphology of macroscopic struc-tures can be utilized for obtaining nucleus density (surface:
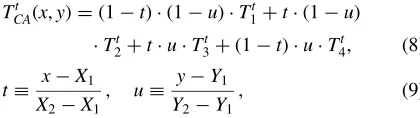
ns;max, bulk:nb;max), average undercooling temperature (sur-face:Ts;nuc, bulk:Tb;nuc) and dispersion of undercooling (surface:Ts;, bulk: Tb;). The optimum value for each parameter was chosen so as to reproduce the experimental results of macroscopic structures. Six different kinds of algorithms have been prepared by taking combinations of the computational methods. They are tabulated in Table 3, where the polar coordinate is prepared in Model 4 and Model 5 to apply to the centrifugal casting. The Model 5 (polar axis) and 6 (Cartesian axis) is used to reproduce the macroscopic structures obtained in experiments.
The effect of each parameter on the morphology and size of the macroscopic structure that was revealed in the simulation results is summarized in Table 4. The main parameters affecting the CET, which is one of our main concerns in this paper, are identified as the nucleation rate, i.e., undercooling temperature for nucleation, Tb, and crystal growth rate, V. They compete with each other at the growth front of the crystal to occupy the CA mesh, resulting in the development of a particular macroscopic columnar or equi-axed structure that is formed by the competition of such two parameters. It is also to be noticed that the crystal growth
0 0.2 0.4 0.6 0.8 1
1200 1250 1300 1350 1400 1450 1500 1550
Temperature, T/K Scheil
Fraction of Liquid
equilibrium
[image:4.595.70.266.73.221.2]Fig. 2 Solid fraction of Fe-Mn system obtained by Scheil model and the equilibrium solid fraction obtained using ‘Thermo-Calc’.
Table 3 Characteristics of the algorithms.
Program Coupling method
Introducing
Thermo-Calc Coordinate
Input method of nucleus density
Model 1 (cell 315) weak no Cartesian A
Model 2 (cell 34) weak yes Cartesian A
Model 3 (cell 41) full yes Cartesian A
Model 4 (cell cy1) weak yes polar A
Model 5 (cell cy2) weak yes polar B
Model 6 (cell 35) weak yes Cartesian B
[image:4.595.46.552.666.765.2]rate itself is also a function of the undercooling temperature, i.e., V¼vðTbÞ. Therefore, in the process of parameter fitting, the value of Tb is first determined to adjust the macroscopic structure followed by bulk nucleus density nb, and finally parameters concerning the surfaces are identified. The adopted numerical values of the parameters
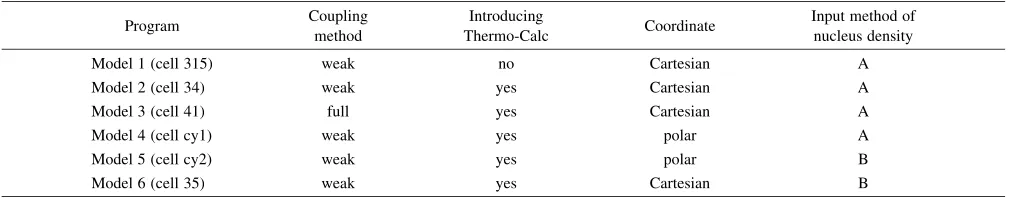
[image:5.595.54.549.85.310.2]ðns;max;ns;max;Ts;nuc;Tb;nuc;Ts;;Tb;Þ are tabulated in Table 5.
In the design of simulation, the square mould with the dimension 110110mm2 is divided into 55mm2 FV meshes. The casting area is6060mm2at the center of the square mould. The CA mesh is designed by dividing the FV mesh into0:250:25mm2mesh size. Figure 3 shows (a) the macroscopic structure of the cast Fe-28Mn-6Si-5Cr SMA in a square mould and (b) simulation result estimated using the numerical values listed in Table 5. The columnar structures are well developed into the center of the cast SMA. Because we have used controlled (fixed) volume method of FV and CA model, the final stage of shrinkage shown in Fig. 3(a) could not be explained.
Figure 4 indicates (a) the macroscopic structures of the cast Fe-28Mn-6Si-5Cr SMA in a cylindrical shape of mould, and (b) result of simulation. In Fig. 4(b), a part of the mould design for simulation in cylinder shape is also indicated. The
FV mesh design in simulation has been done by dividing both the casting zone and mould zone into 2 mm steps along the radial direction. The CA mesh of the casting zone is set by
Table 4 Contribution of parametric values to microstructures.
Parameter Symbol Unit Direction of
change Resultant effects
Maximum nucleus density on surface ns m1
" Small chill size
# Large chill size
Maximum nucleus density in bulk nb m2
" Small size microstructure
# Large size microstructure
Undercooling for nucleation on surface Ts;max K
" Small amount of chill,
Narrow inter-columnar distance
# Large amount of chill,
Wide inter-columnar distance
Undercooling for nucleation in bulk Tb;max K
" Equi-axed!Columnar, Large size
# Columnar!Equi-axed, Small size
Dispersion of undercooling on surface Ts; K
" Large chill size
# Small chill size
Dispersion of undercooling in bulk Tb; K
" Large size microstructure
# Small size microstructure
Crystal growth rate V m/s " Columnar!Equi-axed, Small size
[image:5.595.57.550.344.478.2]# Equi-axed!Columnar, Large size
Table 5 Adopted numerical values in simulation obtained by comparing experimental results with simulation.
Parameter Mark Unit Fe-based SMA Al-7 mass%Si
Thermal interface resistance of
casting-mold (square/circle) R
m2sK/W cm2sK/cal
1103=1103 40/40
2103=7104 80/30 Maximum nucleus density on surface ns;max m1 3:4103 2:4103
Maximum nucleus density in bulk nb;max m2 1:28106 2:56106
Undercooling for nucleation on surface Ts K 1 1
Undercooling for nucleation in bulk Tb K 1:6101 8
Dispersion of undercooling on surface Ts; K 1101 1101 Dispersion of undercooling in bulk Tb; K 1101 1101
Crystal growth rate vðTÞ m/s 2:9310
5T2 þ6:24106T3
2:9106T2 þ1:49106T3
(a)
(b)
[image:5.595.340.510.498.700.2]dividing the FV mesh into 0.025 mm meshes along the radius. The angular division of the mesh is kept common to FV and CA mesh as 0.01 radian. The macroscopic structures within a 1/8 area of the circle are obtained and the symmetry operation is carried out to draw the whole circle area. The minor chill phase attached to the mould surface and the developed columnar structure toward the center of the cylinder are well reproduced in the simulation.
3.2 Centrifugal casting
In order to obtain the optimum numerical value of the parameters in centrifugal casting, the Fe-28Mn-6Si-5Cr SMA was cast into a steel mould with a stair shaped cross section (step-type of the mould). We have suspended thermo-couples fixing the distancehabove each stair of the step-type mould apart from the mould wall. Because of the step type of the mould, various cooling rates TT_ of the SMA cast were obtained depending on the thickness of the cast. The centrifugal casting of the Fe-28Mn-6Si-5Cr SMA has also been done to compare the macro- (dendrite and equi-axed) and micro- (secondary branch width of dendrite) structures to those of the SMA which were cast into the step-type mould.
From the similar microscopic structures of the cast SMA to those of the reference materials obtained by the step-type of the mould, we have identified the cooling rate TT_ of the centrifugal casting SMA.
The thermal interface resistanceR1defined at the interface between the casting and mould andR2 between the casting surface and air are obtained from the cooling curve of the centrifugal casting estimated in the above. The other parameters that can be estimated from the macroscopic structures are tabulated in Table 6.
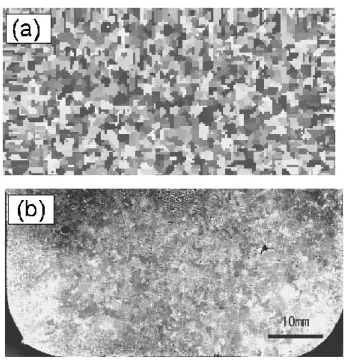
Figure 5(a) illustrates the mould design of the centrifugal casting for 100 A (100mm in diameter) and the estimated macroscopic structure by simulation. The simulation has been done by dividing the hollow (air) core region into 18 FV meshes (36 mm/18) along the radial direction, casting region into 8 FV meshes (16 mm/8) and mould region into 10 FV meshes (40 mm/10). The FV mesh along the circumference is obtained by dividing it into 640 meshes. The CA mesh is obtained by dividing the FV mesh of the casting zone into finer meshes; 2.5 mm length measured along the radial direction is divided into 80 s (2 mm/80), resulting in the CA mesh size ofð0:51{0:35Þmm0:03mm. We have estimated the macroscopic structures within the 1/8 area of the circle. The symmetry operation is carried out to draw the whole circle area.
The simulation has been done using the Model 5 (polar axes) in Table 3 with the numerical values ðR1;R2; ;
ns;max;ns;max;Ts;nuc;Tb;nuc;Ts;;Tb;Þ tabulated in Table 6. The macroscopic structure estimated by simulation is also shown in Fig. 5(a). The columnar structure grows lineally from the mould surface to the end ridge of the casting. Equi-axed crystal zone is formed in the inner surface end of the casting with 2mm in thickness. Figure 5(b) indicates the micrograph of the cast Fe-28Mn-6Si-5Cr SMA by centrifugal casting method. The columnar structure is directly developed from the mould surface and the equi-axed crystallites are also observed at the end part of solidification. However, the size of the columnar structure seems to be smaller than the simulation results. It seems to be originated from the low value of the maximum surface nucleate density
(b)
∆80
30mm/∆15 metal mold
22mm/∆11
52mm
(a)
[image:6.595.70.271.68.229.2]Fig. 4 Comparison of the macrostructures of Fe-Mn-Si-Cr SMA obtained in (a) experiments, (b) simulation.
Table 6 Numerical values used for simulation in centrifugal casting.
Thermal interface resistance of
casting-mould R1 m
2sK/W 2103
Thermal interface resistance of
air-mould R2 m
2sK/W 6:4105
Thermal conductivity W/mK 8:4101
Maximum nucleus
density on surface ns;max m
1 1:5103
Maximum nucleus
density in bulk nb;max m
2 1105
Undercooling for
nucleation on surface Ts;max K 1
Undercooling for
nucleation in bulk Tb;max K 1:610
1
Dispersion of
undercooling on surface Ts; K 110
1
Dispersion of
undercooling in bulk Tb; K 110
1
[image:6.595.46.551.581.786.2]ns;max. However, because the mesh size becomes larger along the radial direction, and because there was a time limitation for simulation, we could not take a large nucleate density.
3.3 CET in G-V diagram
The crystal growth rate appears to be the most important factor to control the macroscopic structures as elucidated in the previous section. According to Kurz and Fisher,17)the macroscopic structure of a casting could be categorized in a G-V diagram expressed by the axes of temperature gradient G and the crystal growth rate V. The equi-axed structure is expected to locate in an upper-left region (large V-small G), and columnar structure is to be located in a lower-right region (small V-large G) in the diagram.
The cooling rateTT_, in case of uni-directional growth, can be obtained from the growth rate V and the temperature gradient G as,
_
T
T¼GV: ð11Þ
In a normal static casting, we can identify the value of the parameters by experiments. However, since it is difficult to measure the values of such parameters asTT_, G or V in the centrifugal casting, we have utilized the macroscopic structure of the centrifugal casting to evaluate them.
As mentioned in the previous section of the step-type of a steel mould experiment, we have measured the cooling rate
_
T
Tstep of the cast Fe-28Mn-6Si-5Cr SMA followed by the
observation of microscopic structures by optical microscopy. The secondary branch width of a dendrite,2;stephas a certain proportional relation to the local solidification time f;step, which is the elapsed time for the secondary branch of the dendrite to start the solidification at temperature 1584 K (1311C) and to finish solidification at temperature 1532 K
(1259C). This local solidification time
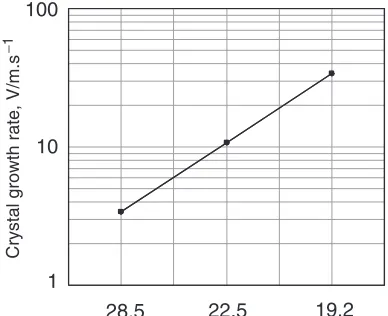
f;step was deter-mined from the flat part of the temperature-time diagram in which the temperatures are measured by the thermo-couples placed above each stair of the step-type mould. The logarithm of growth rate, lnðVstepð¼2;step=f;stepÞÞ, plotted against
lnð2;stepÞ indicates a straight line as shown in Fig. 6. From this simple linear relation, the crystal growth rate in the centrifugal casting, Vcent, is obtained by measuring the secondary branch width of a dendrite,2;cent. Knowing that
_
T
Tstep¼TT_cent at the same secondary branch width of a dendrite, i.e., at 2;cent¼2;step, we can obtain the temper-ature gradient Gcentfrom eq. (11).
The industrial pipes of 100 A (4 inches pipe), 250 A (10 inches pipe) and 300 A (12 inches pipe) were produced by the centrifugal casting under the conditions cited in Table 7. The Vcent value estimated for the dendrite is plotted against temperature gradient Gcent at the identified position of the dendrite. Thus, we have obtained the distinguished zone map in the G-V diagram as shown in Fig. 7. Overlapping the macroscopic structure image on each point plotted in G-V diagram, we can clearly recognize the CET line in Fig. 7. It is estimated as G=V2:5108 (Ks/m2). The extension shown by the double-arrows in Fig. 7 represents 10 mm thickness of the cast pipes from the mould surface. All sizes of the pipes are found to reside in the deep columnar structure area. However, a disturbance whose macroscopic structure could not be identified has occurred in the casting of large size of pipes (250 A, 300 A), which is indicated by square box symbols in Fig. 7. Moreover, the equi-axed macroscopic structures were observed for the large size of pipes (250 A, 300 A) in the columnar region of the G-V diagram. In the centrifugal casting, the fluid convection of molten alloys is a well known phenomenon. Therefore, it is anticipated that the molten or mushy SMA of large size of pipes undergoes
Fig. 5 (a) Centrifugal casting mould and simulated macrostructure of casting Fe-28Mn-6Si-5Cr (mass%) SMA. (b) Optical macrograph of SMA.
1 10 100
28.5 22.5 19.2
Secondary branch width of dendrite, 2/ mµ
Crystal grow
th rate, V/m.s
−
1
λ
[image:7.595.62.278.68.399.2] [image:7.595.328.522.75.233.2]convection in the centrifugal casting. In fact, such disturbed region disappears by increasing the rotation speed until
103rpm.
4. Reliability of Model and Calculation
In this section, in order to make clear the problem and make clear discussions based on the established scientific foundation, we pick up Al-7 mass%Si alloy as a reference material.
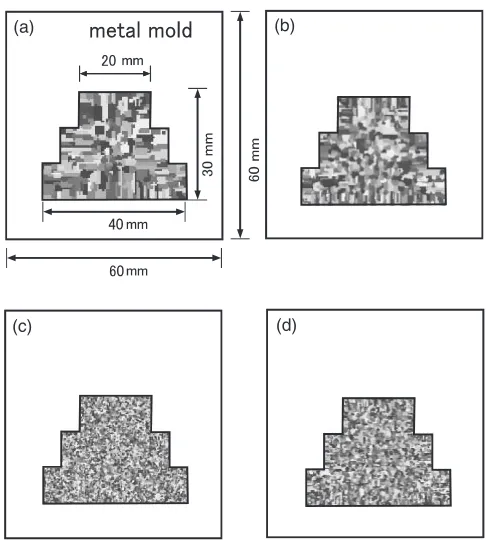
Mesh size: The striking effect of nucleus on the morphol-ogy of macroscopic structures is invoked by changing the amount of nucleus or nucleus density ni. It is, therefore, particularly significant to adopt reliable numerical value of nucleus density. The effect of nucleus density is directly connected to the mesh size, because the nucleus is randomly distributed over all CA meshes. We have set up the mould shown in Fig. 8(a) to make a trial simulation with the mesh sizes varied. The adopted shape of the mould is almost the same as the one investigated by Cho et al.,18) because we firstly need to confirm the similar simulation results as those
obtained previously by researchers. Model 3 is used to make clear the mesh size effect by using full coupling method. Fixing FV mesh size as 55mm2, we have estimated the effect of CA mesh size on the macroscopic structure of the cast alloy (Figs. 8(a), (b), (c)). The morphology of macro-scopic structure obtained by FV and CA mode coupling is revealed to vary significantly depending on the CA mesh size. Corresponding to a large mesh size such as
[image:8.595.45.556.83.241.2]0:50:5mm2 and 0:250:25mm2, columnar structures are developed from the mould wall, while for a small mesh size of 0:1250:125mm2, almost all equi-axed structure has appeared in small size throughout the mould. The effect of FV mesh is investigated by fixing the CA mesh size as
Table 7 Casting parameters.
100 A(4 in.) 250 A(10 in.) 300 A(12 in.)
Cast size 129912655
(mm) 2712211185 3112701060
Mould size 235135:52720
(mm) 4582781213 5703201067
Mould material AISI-4130 SC SC
Mould temperature 493 K (220C) 453 K (180C) approx. 453 K (180C) approx.
Casting temperature 1803 K (1530C) 1703 K (1430C) 1705 K (1432C)
Casting speed 132 kg/8 s 160 kg/8 s 160 kg/8 s
Rotating speed 23.3 s1(1400 rpm) 16 s1(960 rpm) 13.5 s1(810 rpm)
Rotating time 150 s 300 s approx. 300 s approx.
Pulling time 600–900 s 300 s approx. 300 s approx.
Cooling air/water air air
The inside surface of casting is cooled by air and outside surface of mold is cooled by water.
Columnar
Columnar
Equiaxed
Chill
G/K.m
-1Equiaxed
100A 250A
300A
G/V=2.5 8(K.s/m2)
V/m.s
-1
10-4
10-5
104
Disturbed
105
10
Fig. 7 Distinguished macrostructure zone of the cast pipes plotted in G-V diagram. 100 A, 200 A, and 300 A indicate the pipes in size of 100, 200 and 300 mm diameter, respectively. Double-arrows indicate 10 mm thickness of the cast pipes from the mould surface.
(c) (d)
(b) (a)
[image:8.595.305.548.275.546.2] [image:8.595.71.267.281.462.2]0:1250:125mm2 and changing the FV mesh between
55mm2 (Fig. 8(c)) and 2:52:5mm2 (Fig. 8(d)). The size of macroscopic structure is slightly changed, and because of the rapid heat flow in a small FV mesh (Fig. 8(d)), columnar structures of dendrite are formed from the mould wall.
To prevent such a problem that the macroscopic structures are simulated in various morphologies and sizes depending on the mesh size of the model, we have changed the input method of the nucleus density in the simulation calculation. The nucleus density evaluated, so far, as (number of nucleation site)/(total number of meshes) is changed to (number of nucleation site)/(area of unit CA mesh). It is adopted in Model 5 and 6 to apply to Fe-28-Mn-6Si-5Cr SMA as shown in Table 3. It was confirmed that, in the range of the mesh size mentioned above, total macroscopic structure which was estimated using Model 5 and 6 would not show a striking change in its size and morphology.
Time step: In the time-consuming simulation, time stept
(increment of time per one step of calculation) is also a factor to investigate its performance. The relationship between the time step and the nucleation and growth is investigated by setting the time step by t¼0:5, 0.4, 0.1, 0.005 s, respec-tively. The simulation results using Model 6 revealed that for the time step oft¼0:5and 0.4 s, the casting shows almost equi-axed structures, and for the time step of t¼0:1 and 0.05 s the columnar structures have appeared in the casting. This simulation results have come from the restriction that the crystal growth is to be limited within a single CA mesh by the one step calculation, and that in case of a large time step the temperature of CA mesh might decrease under the nucleation temperature during such one step of calculation. As a result, for a large value oft, the nucleation takes part at many nucleation sites before the crystal starts the growth. However, shorter time steps are time-consuming in perform-ing the calculation. We have adopted in the present paper the time stept¼0:05.
Another problem of time step is the occurrence of temperature instability when the temperature recovery method is used for latent heat absorption. The rapid decrease of temperature excites the cyclic phenomena of rapid increase of solid fraction and rapid release of latent heat. This results in rapid increase of temperature. As a conse-quence, the cyclic temperature change diversifies in the solution. Therefore, in the present investigation, we adopt the enthalpy method for temperature estimation.
Cooling rate dependency: To check the reproducibility of macroscopic structures of cast alloy, simulation has been done using Model 6 by changing the cooling rate in the program. It is supposed that the cooling rate of the casting can be varied by the thermal interface resistanceRdefined at the interface between the mould and casting.
The parameters used for the simulation, except the thermal interface resistanceR, are those tabulated in Table 5. In order to clarify the effect of cooling rate, we have adopted a wide range of values for the thermal interface resistance such as
R¼0, 20, 40, 100 (cm2sK/cal). Cooling temperatures were estimated at the point,A¼7:5mm andD¼22:5mm apart from the mould wall that are set along the horizontal centerline.
Figure 9 shows the cooling curves obtained by simulation forR¼100. Two cooling curves estimated at A and D of the FV mesh indicate almost the same traces against time. Similar cooling curves were obtained for other values of thermal interface resistance, R¼0, 20, 40. The resultant cooling curves obtained in the simulation have revealed that smaller the R value (higher cooling rate) is, and closer the measured point to the mould wall, more steeply the temper-atures are decreased. In all the stimulated curves, a deviation point in slope exists at about 890 K through which the slope of the curve becomes gradual, and again the slope steeps at about 850 K. The first deviation point in slope corresponds to the liquidus temperatureTl¼890K and the second one is the eutectic temperature of Al-7 mass%Si alloy.
Figure 10 indicates simulation structures obtained by varying the R values in Al-7 mass%Si alloy. When the cooling rate is fast (small R), dendrite columns develop toward inside of the mould and the widths of dendrite columnar tips become small. The cooling curves are estimated in the simulation at points located at A¼7:5,
B¼12:5,C¼17:5andD¼22:5mm apart from the mould wall, which are the same locations identified in the experi-ment in section 3.1. The cooling rate TT_ (= GV) at the dendrite columnar tip is obtained from the temperature curve at the liquidus temperature Tl as shown in Fig. 9. In due process, the V values estimated at the identified points A, B, C and D are plotted against temperature gradient G as shown in Fig. 11. The macroscopic structures have also been identified at each point A, B, C and D in the simulation pictures of Fig. 10. The columnar region and the equi-axed one are clearly distinguished. The CET line TT0 is readily
identified in the G-V diagram. With smallR, that is, with easy heat transfer at the interface between the mould and casting, larger amount of columnar structures could be formed in the casting. The existence of clear-cut CET line in G-V diagram reveals that the CET is yielded by the competition of nucleation and column growth at the growth front of the crystal.
Reproducibility of macroscopic structures: Fitting of cooling curves by adjustingRvalue in the cast Al-7 mass%Si alloy is made as shown in Fig. 12. Using the numerical
TQ
Tl
Temperature,
T
/K
Time, t/s
7.5mm, cell 34 22.5mm, cell 34
7.5mm, t-sold 2d 22.5mm, t-sold 2d
0 20 40 60 80 100 120
800 850 900 950 1000
[image:9.595.326.526.75.221.2]values listed in Table 5, we have obtained the macroscopic structure of the Al-7 mass%Si alloy shown in Fig. 13(a) that is compared to the experimental result in Fig. 13(b).
5. Conclusions
Shape memory effect of the joining pipes in Fe-28Mn-6Si-5Cr SMA has a close connection to its macrostructure. In order to obtain a high quality of SMA, we have to have uni-directionally developed fine columnar structures in the centrifugal casting. The simulation was made on the macro-scopic structures of the centrifugal casting of Fe-28Mn-6Si-5Cr SMA to improve the production process of joining pipes by centrifugal casting. The key point is to obtain the CET line in G-V diagram.
1. It is revealed in the simulation that in the Fe-28Mn-6Si-5Cr mass% SMA the nucleation of crystals at a under cooling temperatureTb, and crystal growth compete each other at the growth front of the crystal, and as a result, the particular macroscopic structure (columnar or equi-axed) could develop in the centrifugal casting. 2. In the industrial pipe joining materials of Fe-28Mn-6Si-5Cr SMA, the CET is estimated as G=V2:5108
(Ks/m2). All size of the pipes (100 A, 200 A, 300 A) are found to reside in the deep columnar structure region in G-V diagram.
3. Finer columnar structure could be obtained by increas-ing the coolincreas-ing rate of the castincreas-ing and increasincreas-ing the rotation speed of the centrifugal casting mould. The structure formations are reproduced in the conditions of centrifugal casting by the developed simulation models of FV-CA coupling mode.
REFERENCES
[image:10.595.48.290.70.327.2]1) H. Tanahashi, T. Maruyama and H. Kubo:Shape Memory Materials and Hydrides, ed. by K. Otsuka and Y. Fukai, (Trans. MRS Jpn., vol. 18B, Elsevier Sci., 1994) p. 1149.
Fig. 10 Variation of macrostructure with thermal interface resistanceR. (a)R¼0, (b)R¼20, (c)R¼40, (d)R¼100. Higher heat transfer (small
R) allows columnar structure developed from the mould wall. Dendrite tips seem to have merged together at around the wall interface.
10 102 103 104 105
R=40
10-2
10-3
10-4
T
T'
AB
C D
R=20 R=0
R=100
G/K.m-1
V/m.s
-1
Fig. 11 Plot of crystal growth rate V against temperature gradient G at the dendrite column tip.Rindicates thermal interface resistance. For eachR, G and V are estimated at FV mesh located at 7.5, 12.5, 17.5, and 22.5 mm.
cast (experiment)
mould (experiment) cast,
mould,cellcy3
200 300 400 500 600 700 800 900 1000
10 20 30 40 50
0
Time,
t
/s
Temperature,
T
[image:10.595.326.526.75.222.2]/K
Fig. 12 Fitting of cooling curves of Al-7 mass%Si cast into square steel mould.
[image:10.595.340.512.279.459.2] [image:10.595.71.267.400.542.2]2) H. Otsuka, T. Maruyama and H Kubo: Mater. Sci. Forum327–328
(2000) 243–246.
3) T. Maruyama and H. Otsuka: Metal66(1996) 1079.
4) O. Matsumura, S. Furusako, T. Furukawa and H. Otsuka: ISIJ Int.36
(1996) 1103–1108.
5) T. Suezawa: The Graduation Thesis. Department of Materials Processing, Tohoku University, 2001.
6) M. Rappaz and C. A. Gandin: Acta Metall. Mater.41(1993) 345–360. 7) M. Rappaz and C. A. Gandin: MRS Bull.19(1994) 20–24. 8) H. W. Hesselbarth and I. R. Gobel: Acta Metall. Mater.39(1991)
2135–2143.
9) C. A. Gandin and M. Rappaz: Acta Mater.45(1997) 2187–2195. 10) C. A. Gandin, J. L. Desbiolles, M. Rappaz and P. Thevoz: Metall.
Mater. Trans. A30(1999) 3153–3165.
11) K. Y. Lee and C. P. Hong: ISIJ Int.37(1997) 38–46. 12) T. Toffoli: Phys. D10(1984) 117–127.
13) G. E. P. Box and M. E. Muller: Ann. Math. Statist.29(1958) 610–611. 14) P. Thevoz, J. L. Desbiolles and M. Rappaz: Metall. Mater. Trans. A20
(1989) 311–322.
15) C. A. Gandin, M. Rappaz and R. Tintillier: Metall. Mater. Trans. A25
(1994) 629–635.
16) W. Kurz, B. Giovanola and R. Trivedi: J. Cryst. Growth91(1988) 123– 125.
17) W. Kurz and D. J. Fisher: Acta Metall.29(1981) 11–20.
18) S. H. Cho, T. Okane and T. Umeda: Int. J. of Cast Metals Res.13