Preparation of Mg–Li–Al–Zn Master Alloy in Air
by Electrolytic Diffusing Method
Meng-Chang Lin and Jun-Yen Uan
*Department of Materials Engineering, National Chung Hsing University, 250 Kuo-Kuang Rd., Taichung 402, Taiwan, R. O. China
Electrolytic diffusing method was conducted at 500C to prepare Mg–Li–Al–Zn master alloy in air. It was also explored for the melting and casting of Mg–Li alloy in air, as the Mg–Li–Al–Zn master alloy used as raw material. A mixture of 45 mass% lithium chloride (LiCl) and 55 mass% potassium chloride (KCl) was employed as the electrolyte. Mg–9 mass%Al–1 mass% Zn (AZ91) alloy was used as cathode material while graphite selected as anode. Experimental results showed that the electrolysis current linearly depended on the applied working voltage. Deposition of lithium occurred on the cathode surface. After the electrolysis experiments, Mg–12 mass% Li–9 mass% Al–1 mass% Zn alloy sheet can be obtained. At working voltage of 4.2 V and one hour electrolysis, the hexagonal-closed-pack AZ91D sheet (1.5-mm thickness) was fully converted to body-centered-cubic Mg–Li–Al–Zn alloy. The formation of Mg–Li phase during electrolysis was studied by inductively coupled plasma-atomic emission spectrometer (ICP), X-ray diffraction, and optical microscopy. It is diffusion rather than deposition rate (electrolysis current) that controlled the depth of Mg–Li phase formed in the cathode sample. The Mg–Li–Al–Zn alloy used as master alloys could be melted and casted in air without ignition. However, the content of lithium in the as-cast block was reduced to 3.77 mass%, properly due to oxidation of lithium metal during melting.
(Received January 24, 2005; Accepted April 6, 2005; Published June 15, 2005)
Keywords: magnesium, magnesium-lithium alloy, electrolysis, diffusion, master alloy
1. Introduction
Magnesium and its alloys have high specific strength, good thermal conductivity, and are recyclable.1) However, poor cold forming capability limits the development of the alloy. Addition of over 10.3 mass% lithium into magnesium will convert the hexagonal closed pack (HCP) structure to body centered cubic (BCC) lattice, improving formability of the alloy, and reduce its density.2–4)Besides, binary Mg–Li alloy
and ternary Mg–Li–Al alloy can be the anodic materials in primary battery systems.5) According to Sahoo and
Atkin-son,5) the Mg–Li–Al alloy can consistently give higher
voltages and perform better discharge characteristics. Conventional way to produce Mg–Li alloy and Mg–Li–Al alloy is ingot metallurgy method, with careful lithium handling in a vacuum melting system.5–7)On the other hand,
due to high diffusion coefficients of lithium in Li–Mg ( phase) alloy (10 6cm2s 1 at 420C),8) Smolinski9)
per-formed electrolysis of the fused salt bath composed of 55 mass% LiCl and 45 mass% KCl at 500C. In the electro-lytic cell, graphite has been used as the anode, and pure magnesium was cathode. Basically, the chlorides are decom-posed into metal ions and chlorine ions during electrolysis. The metal ions form into metal atoms by a reducing reaction at the surface of cathode. The metal atoms then diffuse into the magnesium matrix. According to Smolinski,9) it takes
four hours to obtain a Mg–Li sample with 1.65 mm thickness following the electrolytic diffusing process. Beside, the sodium content in the Mg–Li sample was up to 0.026 mass%, and the content of potassium in the cathode sample after electrolysis was not examined in previous study.9)
In present study, AZ91 Mg–Al–Zn alloy, rather than pure magnesium metal, was selected to be the cathode material. As a result, less time was needed to covert the AZ91 cathode into Mg–Li–Al–Zn alloy. The BCC Mg–Li–Al–Zn alloy with
low concentrations of potassium and sodium was produced in air by controlling a suitable DC voltage. In addition, the feasibility of melting and casting Mg–Li–Al–Zn alloy in air was confirmed by this study.
2. Experimental Procedures
A mixture of 45 mass% lithium chloride (LiCl) and 55 mass% potassium chloride (KCl) was employed as the electrolyte. Both chlorides were commercial grade. The chloride mixture is in the eutectic composition of LiCl-KCl system with a eutectic temperature of 354C.10)The
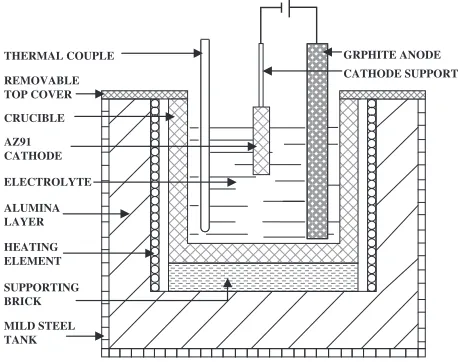
electro-lytic cell used in this study is schematically illustrated in Fig. 1. As indicated, the cathode is Mg–9 mass% Al– 1 mass% Zn (AZ91D) alloy. It had 1.5 mm in thickness, 20 mm and 80 mm for the width and length. The anode was a graphite bar. The molten electrolyte was kept at 500C in a
crucible. Electrolysis was carried out as the power supply
THERMAL COUPLE GRPHITE ANODE
AZ91 CATHODE
ALUMINA LAYER
MILD STEEL TANK
CATHODE SUPPORT REMOVABLE
TOP COVER
SUPPORTING BRICK ELECTROLYTE CRUCIBLE
HEATING ELEMENT
Fig. 1 Electrolytic cell for deposition of lithium.
*Corresponding author, Email: [email protected]
[image:1.595.311.540.587.768.2]unit applied a constant voltage to the electrolytic cell. Voltages from 3.4 to 4.2 V were used in current study. For each voltage, the time for electrolytic deposition is one hour. In addition, the AZ91 samples with 3 mm in thickness, 45, and 60 mm for the width and length were also taken as cathode. At 4.2 V, the times for electrolytic deposition were 10, 30, 60, 90, 120, and 180 min, respectively, to see the thickness of Mg–Li phase as a function of time.
Mg–Li–Al–Zn master alloy was prepared by the electro-lytic diffusing method mentioned above. The master alloy was then melted in air under a gas protective atmosphere of 99.8 vol% (volume percent) dried air and 0.2 vol% SF6. The molten Mg–Li–Al–Zn alloy was poured into sand mold (1050100mm3). The pouring temperature is 720C.
The microstructures were studied by optical microscopy and scanning electron microscopy (SEM). Chemical compo-sitions of the samples were analyzed by inductively coupled plasma-atomic emission spectrometer (ICP). The X-ray diffraction analysis was performed with an X-ray diffrac-tometer by means of Cu K radiation at 40 Kv. An X-ray scanning speed of 1 deg/min was employed in the experi-ment.
3. Results and Discussion
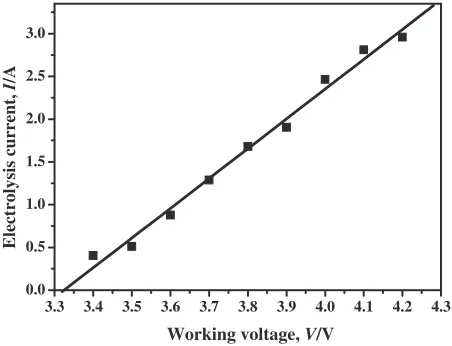
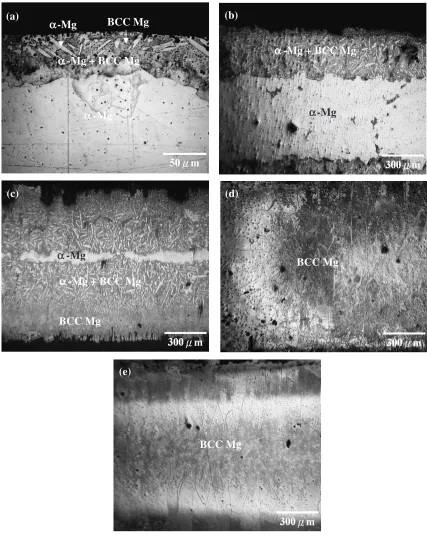
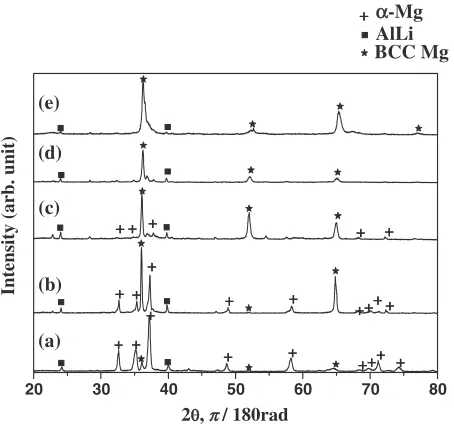
For the electrolysis in LiCl-KCl salt bath, Fig. 2 illustrates the electrolysis current versus working voltage of the electrolytic cell. The current was changed almost linearly with working voltage. Figures 3(a) through (e) showed the optical micrographs of the samples after electrolytic diffusing at working voltage of 3.4, 3.6, 3.8, 4, and 4.2 V for 1 h at 500C, respectively. Figure 4 (spectra (a) to (e)) showed the
X-Ray diffraction results of the samples after electrolytic diffusing at working voltage of 3.4, 3.6, 3.8, 4, and 4.2 V for 1 h at 500C, respectively. The X-ray peaks in Fig. 4 were
indexed following the previous study about the crystal structure of Mg–Li alloy.11) As indicated in Figs. 3(a), (b)
and (c) the diffusing layers consisted of the mixture of-Mg phase (i.e., HCP Mg phase) and BCC Mg phase. Further-more, it could be observed that the fine needle-shape -Mg phase (in bright color) distributed in the gray BCC Mg
matrix. Similar microstructure can be found in previous studies about the Mg–Li alloys casted by ingot metallurgy method.4,12) The total diffusing thickness (including the
mixture layer) was50mmfor 3.4 V/1 h. A higher applied voltage caused it up to300mmfor 3.6 V/1 h and600mm
for 3.8 V/1 h, respectively. The X-Ray diffraction spectra for the electrolytic diffusing samples 3.4, 3.6 and 3.8 V/1 h were indicated in Fig. 4. The samples of 3.4 and 3.6 V/1 h (spectra (a) and (b)) showed weak crystalline BCC Mg peaks, while the sample at 3.8 V/1 h (spectrum (c)) revealed typically sharp crystalline BCC Mg peaks. Figures 3(d) and (e) showed optical micrographs of the samples after electrolytic diffusing at working voltage of 4 V and 4.2 V for 1 h. The samples were full charged by lithium, converting the original HCP Mg phase into BCC Mg, as shown in Figs. 3(d) and (e) for microstructure, and Fig. 4 (spectra (d), (e)) for X-ray data. As the spectra (d) and (e) depicted in Fig. 4, the X-ray diffraction patterns for the samples of 4 V/1 h and 4.2 V/1 h showed that only sharp BCC Mg peaks and AlLi peaks were identified.
The lithium content in each of the samples after electro-lytic diffusing at working voltage from 3.4 to 4.2 V for 1 h was determined by ICP. Figure 5 showed the lithium content versus working voltage. The composition of lithium increas-ed with working voltage. According to the microstructural results in Fig. 3, the thickness of diffusing layers also increased with the working voltage. At 4.2 V for 1 h electrolysis, microstructural observation and X-ray data (Fig. 4, spectrum (e)) showed that the sample with HCP crystal structure has been totally transformed into BCC crystal structure. The chemical composition of the sample after the electrolytic diffusing at working voltage of 4.2 V for 1 h was show in Table 1 (c.f., the composition of the original AZ91 sample in Table 1). As shown, the sample contained 12.1 mass% of lithium. Nevertheless, the content of potas-sium was only 0.133 mass%. Therefore, following Fig. 3 through Fig. 5, the increase of diffusing layer thickness and the phase transition were both evidently due to the electro-lytic diffusing of lithium into the AZ91D matrix. However, since there was 55 mass% of potassium chloride in the molten electrolyte salt and the theoretical decomposition potential of KCl is 3.755 V13)(3.646 V for LiCl13)), it raises a question of how the potassium did not massively deposit on cathode surface and diffuse into the matrix of the cathode material. The reason is still not clear but our recent research points to the formation of the diffusing layer of BCC Mg–Li phase as initially considered. It deserves further exploration. The content of sodium (the impurity) in the Mg–12.1Li–8.3Al– 0.62Zn alloy that prepared in this study was only 0.007 mass% (see Table 1) after electrolysis. The sodium content was much lower than the 0.026 mass% of sodium of previous study,9) while the lithium content was nearly the same as
12mass%.
The AZ91 samples with 3 mm in thickness, 45, and 60 mm for the width and length were taken as cathode for investigating the thickness of Mg–Li phase as a function of electrolytic diffusing time. Here, the Mg–Li phase includes the BCC Mg layer and BCC Mg plus-Mg composite layer in the sample (e.g., see Fig. 3(c)). The applied voltage was fixed at 4.2 V. Figure 6 depicts the thickness of Mg–Li phase
3.3 3.4 3.5 3.6 3.7 3.8 3.9 4.0 4.1 4.2 4.3 0.0
0.5 1.0 1.5 2.0 2.5 3.0
Electrolysis current,
I
/A
Working voltage, V/V
[image:2.595.56.282.585.758.2]versus the square root of electrolysis time. As shown, the thickness linearly depends on the square root of electrolysis time. Since the electrolysis was carried out at a fixed temperature (500C), the diffusion coefficient was assumed
to be the same. Thus, the linear dependence indicated in Fig. 6 suggested that the formation of the Mg–Li phase was probably due to diffusion control.14)Under diffusion control, it may help to interpret and to understand the experimental results of Fig. 2 and Fig. 5. In Fig. 2, the electrolysis current exhibited linear proportionality to the working voltage. It appeared that high working voltage caused high rate of
lithium deposition on cathode. It is part of the reason why 4.2 V/1 h electrolysis resulted in total conversion of -Mg into BCC Mg (see Fig. 3(e)) whereas 3.6 V/1 h did not have this result (see Fig. 3(b)). Figure 7 provided further infor-mation about the lithium deposition, showing the electrolysis current (I)vs.electrolysis time (t) for the working voltages at 3.6, 3.9 and 4.2 V, respectively. The total electrolysis time was 1 h. As indicated in the plot, the current slightly decreased as a function of the electrolysis time. Although the OM micrographs in Fig. 3 showed the Mg–Li phase layer at 4.2 V was noticeably thicker than those of 3.6 V and 3.8 V,
(b)
(c)
(d)
(e)
(a)
αα
-Mg
α
-Mg + BCC Mg
BCC Mg
α
-Mg
α
-Mg + BCC Mg
BCC Mg
BCC Mg
α
-Mg + BCC Mg
α
-Mg
α
-Mg
BCC Mg
[image:3.595.83.510.71.607.2]each I–t curve had similar decreasing tendency. Moreover, the I–t curve of 4.2 V kept a steady slight decreasing rate as a function of time (t). The current of working voltage 4.2 V did not have a noticeable decrease in relation to the electrolysis time. This suggested that the increasing thickness of Mg–Li phase did not substantially hindered the deposition of lithium atoms on the cathodic material. Figure 7 helped to explain the data in Fig. 2 that high lithium deposition rate occurred when the working voltage was larger than 3.9 V (the linear I– V relation from 3.4 to 4.2 V). However, Fig. 5 showed that
the linear dependence between the lithium content in cathode and the working voltage had different slope in different range. The slope became smaller after working voltage at 3.9 V. Since deposition and diffusion are two important factors to determine the concentration of lithium in cathode materials after electrolysis,9)it came into view that lithium passing from surface to the interior of cathode became difficult as the lithium had to diffuse through the increasing depth of Mg–Li phase. Therefore, although high deposition rate (high electrolysis current) resulted in highly increased depth of Mg–Li phase due to the working voltages higher than 3.9 V (Figs. 2 and 3), Fig. 5 showed that the lithium content in cathode material actually was not that high. That is, because the Li diffusion became diffcult when the thickness of Mg–Li phase increased, the expected content of lithium was unable to obtain in the cathode when the working voltages were higher than 3.9 V.
The process of melting and casting in air for Mg–Li alloy was carried out. The cathode material (AZ91) was converted into the Mg–12.1Li–8.3Al–0.62Zn master alloy, as the chem-ical composition listed in Table 1. The master alloy was melted under a dry air and SF6 mixture atmosphere. In steel (a)
(b) (c) (d) (e)
αα-Mg AlLi BCC Mg
20 30 40 50 60 70 80
2θ,π/ 180rad
Intensity (arb. unit)
Fig. 4 X-Ray diffraction patterns obtained from AZ91D after electrolytic diffusion at working voltage of 3.4 V (a), 3.6 V (b), 3.8 V (c), 4 V (d), and 4.2 V (e) for 1 h at 500C.
3.3 3.4 3.5 3.6 3.7 3.8 3.9 4.0 4.1 4.2 4.3 0
2 4 6 8 10 12 14 16 18
Lithium content (mass %)
Working voltage, V/V
[image:4.595.313.540.72.245.2]Fig. 5 Lithium content in cathode samplevs.working voltage. Electrolysis was carried out for 1 h at each working voltage.
Table 1 The composition of AZ91 and Mg–Li–Al–Zn master alloy (in mass%).
Li Na K Al Zn Mg
AZ91 — 0.003 0.004 8.8 0.69 Bal.
Mg–12Li–9Al–1Zn 12.1 0.007 0.133 8.3 0.62 Bal.
20 40 60 80 100 120
0.0 0.5 1.0 1.5 2.0 2.5
Thickness of diffusion layers,
T
/ mm
Electrolysis time, t1/2/ s1/2
Fig. 6 Thickness of diffusion layersvs.the square root of electrolysis time at working voltage of 4.2 V at 500C.
0 500 1000 1500 2000 2500 3000 3500 0.0
0.5 1.0 1.5 2.0 2.5 3.0 3.5 4.0
3.6V 3.9V
Electrolysis current,
I
/
A
Electrolysis time, t / s
4.2V
[image:4.595.57.284.74.286.2] [image:4.595.312.542.301.474.2] [image:4.595.56.281.352.532.2] [image:4.595.46.291.605.646.2]crucible there were great deals of oxide slug covering the melt. It is probably due to the oxidation of the lithium metal. The molten melt was poured into sand mold at 720C. After
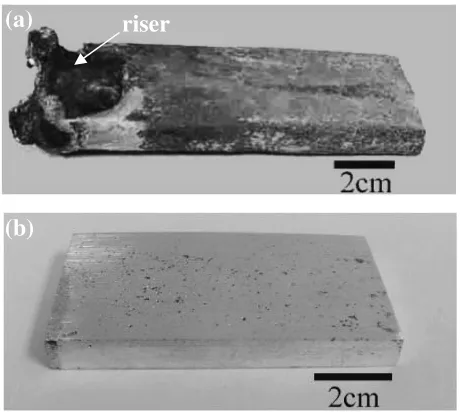
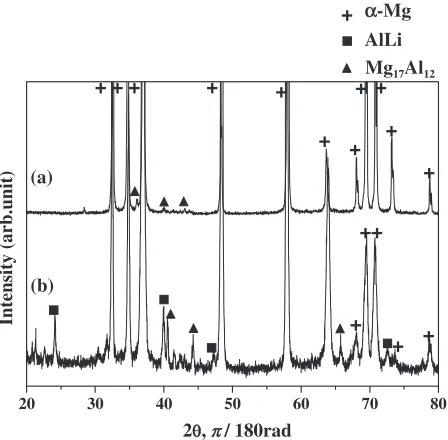
solidification, the casting block with riser was showed in Fig. 8(a). Figure 8(b) illustrated the block after machining. Table 2 showed the chemical composition of the as-cast block. The content of lithium in the as-cast block was reduced to 3.77 mass%, due to the oxidation. Figures 9(a) and (b) showed the as-cast microstructures of the Mg– 3.77 Li–8.6 Al–0.75 Zn alloy (in mass%). As indicated in Fig. 9(a), interdendritic network structure was observed. The microstructural details in Fig. 9(b) were found from the interdendritic structure in high magnification. The Mg17Al12 precipitates appear in two morphologies, plate-like shape and small lamellar precipitates. Similar structure can be found in a previous study by Songet al.15)Figure 10 (spectrum (b)) showed the X-ray diffraction pattern of the as-cast Mg–Li– Al–Zn alloy. For comparison, an X-ray spectrum of AZ91 was also indicated in Fig. 10 (spectrum (a)). As illustrated in Fig. 10 (spectrum (b)), except typical sharp crystalline magnesium peaks and Mg17Al12 peaks, the X-ray patterns of the as-cast Mg–Li–Al–Zn alloy showed some AlLi peaks, which were also observed in Fig. 4. These peaks were due to the 3.77 mass% of lithium contained in the alloy. Further-more, the x-ray data showed that there were no BCC Mg peaks in the spectrum, probably due to only 3.77 mass% of lithium in the alloy. Although the as-cast Mg–Li–Al–Zn alloy is in HCP structure, a recent study16)shows that HCP Mg–Li alloys containing 4 mass% of lithium exhibit a significantly increased ductility, as compared to the alloys without lithium. The electrolytic diffusing method and the whole process of
melting and casting in air for Mg–Li–Al–Zn alloy need to be improve to increase the efficiency of BCC Mg–Li phase formation during electrolysis, and to decrease the depletion of lithium during melting.
4. Conclusion
According to the preceding results and discussion, the following conclusions can be drawn.
(1) The electrolysis current linearly depended on the applied working voltage. Lithium content in cathode material exhibited linear dependence to working volt-age. However, the slope of the linear relationship was closely related to the range of the voltage. The linear slope is small in the range of the working voltages higher than 3.9 V. It is diffusion rather than deposition rate (electrolysis current) that controlled the depth of Mg–Li phase formed in the cathode sample.
(2) At working voltage of 4.2 V, the 1.5-mm thick AZ91 cathode sample (hexagonal-closed-pack (HCP) struc-ture) was diffused right through from both faces by lithium atoms in 1 h. The sample was totally converted into body-centered-cubic (BCC) structure. The lithium content was 12.1 mass% while the potassium content and sodium content was 0.133 and 0.007 mass%,
(a)
(b)
riser
Fig. 8 Mg–3.77 Li–8.6 Al–0.75 Zn as-cast block by melting and casting in air: (a) as-cast block with riser, (b) the block after machining. Mg–Li–Al– Zn master alloy that produced by electrolysis diffusing method (see composition in Table 1) was used as the raw material for the melting.
(a)
plate-like Mg
17Al
12lamellar Mg
17Al12(b)
interdendritic structures
[image:5.595.54.284.71.277.2]Fig. 9 Microstructures obtained from as-cast block by (a) OM, and (b) SEM.
Table 2 The composition of as-cast block (in mass%).
Li Na K Al Zn Mg
[image:5.595.314.540.72.428.2] [image:5.595.39.293.366.394.2]respectively.
(3) By electrolytic diffusing process (e.g. at the optimum condition 4.2 V/1 h), the master alloy with chemical composition of Mg–12.1 mass% Li–8.3 mass% Al–0.62 mass% Zn was obtained. The master alloy was used as raw material, and they could be melted in air. The melt was successfully casted in air to the form of as-cast square block. The content of lithium was reduced to 3.77 mass%, properly due to oxidation of lithium metal.
Acknowledgment
The authors acknowledge the financial support of this work from the National Science Council of Taiwan, ROC under Grant No. NSC 92-2216-E-005-019.
REFERENCES
1) B. L. Mordike and T. Ebert: Mater. Sci. Eng. A302(2001) 37–45. 2) K. Matsuzawa, T. Koshihara and Y. Kojima: J. Jpn. Inst. Light Met.39
(1989) 45–51.
3) H. Haferkamp, M. Niemeyer, R. Boehm, U. Holzkamp, C. Jaschik and V. Kaese: Mater. Sci. Forum350–351(2000) 31–42.
4) R. Ninomiya and K. Miyake: J. Jpn. Inst. Light Met.51(2001) 509– 513.
5) M. Sahoo and J. T. N. Atkinson: J. Mater. Sci.17(1982) 3564–3574. 6) C. R. Chakravorty: Bull. Mater. Sci.17(1994) 733–745.
7) H. Haferkamp, Fr.-W. Bach, P. Bohling and P. Juchmann: Proceedings of the Third International Magnesium Conference, Edited by G. W. Lorimer, Manchester, UK, Apr, 10–12, 1996, Institute of Materials, London, UK, 177–192.
8) Y. Iwadate, M. Lassouani, F. Lantelme and M. Chemla: J. Appl. Electrochem.17(1987) 385–397.
9) J. Smolinski: J. Appl. Chem.6(1956) 180–186.
10) S. I. Berezina, A. G. Bergman and E. L. Bakumskaya: Russ. J. Inorg. Chem.8(1963) 1118–1120.
11) D. H. Kim, Y. S. Han, H. I. Lee and B. Cantor: Scr. Metall. Mater.31 (1994) 819–824.
12) Y. Yoshida, H. Yamada, S. Kamado and Y. Kojima: J. Jpn. Inst. Light Met.51(2001) 551–555.
13) W. J. Hamer, M. S. Malmberg and B. Bubin: J. Electrochem. Soc.103 (1956) 8–16.
14) P. Shewmon:Diffusion in Solids, 2nd. Edition, (TMS,Warrendale, PA, USA, 1989) pp. 16.
15) G. Song, A. L. Bowles and D. H. StJohn: Mater. Sci. Eng. A366(2004) 74–86.
16) F.-W. Bach, M. Schaper and C. Jaschik: Mater. Sci. Forum419–422 (2003) 1037–1042.
20 30 40 50 60 70 80
Intensity (arb.unit)
2θ,π/ 180rad (a)
(b)
[image:6.595.58.282.75.295.2]α-Mg AlLi Mg17Al12