Fatigue Characteristics of Low Cost
Titanium Alloys for Healthcare
and Medical Applications
Gunawarman
1;2, Mitsuo Niinomi
1, Toshikazu Akahori
1, Takayuki Souma
1, Masahiko Ikeda
3,
Hiroyuki Toda
1and Kazuhiko Terashima
11Dept. of Production Systems Eng., Toyohashi University of Technology, Toyohashi 441-8580, Japan 2Dept. of Mechanical Eng., Andalas University, Padang 25163, West-Sumatera, Indonesia
3Kansai University, Suita 564-8680, Japan
Two new low costtitanium alloys, Ti–4.3Fe–7.1Cr (TFC alloy) and Ti–4.3Fe–7.1Cr–3.0Al (TFCA alloy) for healthcare and medical applications have been recently developed. As for such applications, the alloys are necessary to have high fatigue performance. The aim of this study is, therefore, to investigate fatigue characteristics of the alloys subjected to solution treatment abovetransus. Fatigue tests were carried out at a stress ratio, R, of 0.1 and a frequency of 10 Hz.
Fatigue limit of the solution treated TFC alloy is higher than that of the solution treated TFCA alloy, but both are higher than that of the existing biometallic materials. Fatigue strength of the TFC alloy is almost independent of solution treatment temperature, while, fatigue strength of the TFCA alloy strongly depends on solution treatment temperature, especially, in the low cycle fatigue life (LCF) region. The fatigue ratio and biofunctionality of these new alloys are much higher than those of the existing biometallic materials. In general, a crack initiates from the surface in the LCF region and from subsurface (internal) in the high cycle fatigue life (HCF) region for the TFC alloy, while, in the case of the TFCA alloy, a crack tends to initiate from the subsurface in both LCF and HCF regions. The internal crack initiation sites are found to be the area with lowphase stability in the LCF region and at the area with high stability ofphase in the HCF region. The relatively low fatigue strength of TFCA alloy is associated with the addition of Al that leads to precipitatephase in which both crack initiation and facet formation are easier to occur.
(Received January 20, 2005; Accepted May 11, 2005; Published July 15, 2005)
Keywords: fatigue, solution treatment, heat treatment, microstructure, healthcare, medical materials, wheelchairs, titanium
1. Introduction
Due to increasing the number of aged people (over 65 years) over the world, the demand on medical and healthcare materials is increasing.1–5)This demand leads researchers to
develop new materials for such applications.2–8) The most
important requirement for medical materials is biocompat-ibility. At present, titanium and its alloys are the best choice among metallic materials.2–7) However, the usage of the
alloys is limited due to their high cost. In order to reduce the cost, two kinds of titanium alloys for healthcare applications; Ti–4.2Fe–6.9Cr (TFC) and Ti–4.0Fe–6.7Cr– 3.0Al (TFCA)2–5)have been recently developed in Japan. The cost of each alloy is lower than that of other titanium alloys, even including pure titanium.8)This reduction is due to the usage of low cost alloying elements of Fe and Cr. Moreover, the cost can be more suppressed when low cost ferrochrome or recycled titanium containing Fe is used.
Biocompatibility of TFC and TFCA alloys was found equal to that of pure titanium and better than that of Ti–6Al– 4V.7) The tensile properties of these new alloys are
comparable with those of commercial beta titanium alloys, which generally contain higher amount of alloying elements (means more expensive). Tensile properties of TFCA alloy, for example, can be equal or more than those of Ti–4.5Fe– 6.8Mo–1.5Al alloy,3) while, the balance of strength and
ductility of TFC alloys is equal to that of Ti–15V–3Cr–3Sn– 3Al alloy.3)Recent studies4,8) have shown that cold work-ability of these new alloys, especially TFCA alloy, is equivalent to that of conventional pure titanium, and much better than that of Ti–6Al–4V (STA). However, since these alloys are relatively new, some fundamental investigations
are still needed before the alloys are practically used. For medical and healthcare applications, the alloys are required to have high performance under repetitive loads. Moreover, advanced biomaterials should also have high fatigue ratio (ratio of fatigue strength and tensile strength) and biofunc-tionality9)(ratio of fatigue strength and modulus of
elastic-ity); two important mechanical properties that depend closely on the fatigue strength.
The aim of this study is to investigate the mentioned properties of the alloys subjected to solution treatment above transus. The fatigue mechanisms of these type titanium alloys are discussed in terms of the degree of phase stability.
2. Experimental Procedures
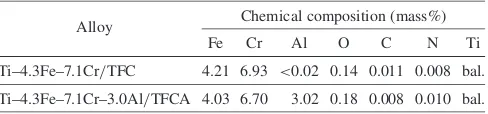
The materials used in this study are hot-forged bars of Ti– 4.3Fe–7.1Cr (TFC) and Ti–4.3Fe–7.1Cr–3.0Al (TFCA) with a diameter of 25 mm and a length of 1000 mm. The chemical composition of each alloy is given in Table 1.
[image:1.595.306.550.728.785.2]Specimens for tensile and fatigue tests with geometry shown in Fig. 1 were machined from the bars by electric discharge machining. These specimens were solution treated (ST) in vacuum at two temperatures abovetransus, namely,
Table 1 Chemical composition of TFC and TFCA alloys.
Alloy Chemical composition (mass%)
Fe Cr Al O C N Ti
Ti–4.3Fe–7.1Cr/TFC 4.21 6.93 <0:02 0.14 0.011 0.008 bal.
Ti–4.3Fe–7.1Cr–3.0Al/TFCA 4.03 6.70 3.02 0.18 0.008 0.010 bal. Special Issue on Medical, Healthcare, Sport and Leisure Materials
1023 K and 1048 K for TFC alloy, and 1098 K and 1123 K for TFCA alloy, respectively, for 3.6 ks (1 h) followed by quenching into ice water (WQ). In this paper, the specimens of TFC alloy solution-treated at 1023 K and 1048 K are referred as TFC1023 and TFC1048, while the specimens of
TFCA alloy solution-treated at 1098 K and 1123 K are referred as TFCA1098 and TFCA1123.
For microstructural observations, cubic samples with a length of 3 mm were cut from each heat treated bar, gradually ground with waterproof emery papers up to #1500 and subsequently buff-polished with alumina powder and then finally etched in 5%HF solution for 20 s. Microstructural observations were then conducted on the samples using an optical microscope and a scanning electron microscope
(SEM: JEOL6300). The phase constitution of the specimens was determined by an X-ray diffractometer using Cu-K radiation with an accelerating voltage of 40 kV and a current of 30 mA. Moreover, microstructures of selected samples were also observed in a transmission electron microscope (TEM).
Tensile tests were carried out using an Instron testing machine with a cross head speed of8:33105ms1, which
corresponds to an initial strain rate of 4:2104s1, at
ambient temperature (298 K).
Elastic modulus of the alloys was measured by a resonance method of elasticity measurement device using a rectangular sample of 5 mm in thickness, 4 mm in width, and 60 mm in length. The surface of the samples was wet-ground with emery papers up to #600.
Fatigue tests were carried out using an electro-servo-hydraulic machine with a capacity of 48 kN, a stress ratio of 0.1, and a frequency of 10 Hz, at ambient temperature (298 K).
Fracture surfaces of fatigue-tested specimens were ob-served using an optical microscope and an SEM (JEOL6300). Observation was conducted after sectioning the sample from fractured specimens. In addition, elemental distribution on the fracture surface was examined using energy-dispersive X-ray (EDX) spectroscopy.
3. Results
3.1 Microstructures
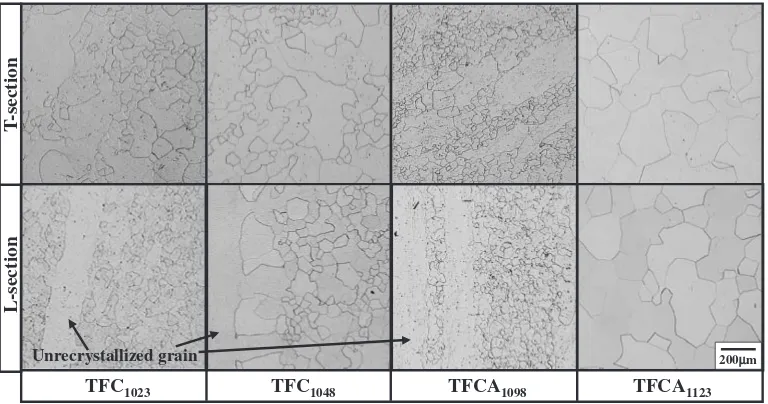
Typical optical micrographs of TFC and TFCA alloys subjected to solution treatment (ST) are shown in Fig. 2. All micrographs show single phase that has been confirmed as phase by XRD analysis. Grain size of phase is relatively fine at low ST temperature, and becomes coarser with increasing ST temperature. Moreover, unrecrystallized grains of phase are clearly seen in both the alloys at low ST temperature, but tend to disappear at higher ST temperatures. Volume fractions of these unrecrystallized grains decrease
15
20
15
3
70 R10
3
20 90
R10
φ
5
Φ
10
a)
b)
Fig. 1 Geometry of a) tensile test specimen and b) fatigue test specimen in mm.
T
-section
L-section
TFC1023 TFC1048 TFCA1098 TFCA1123
200µm Unrecrystallized grain
[image:2.595.58.282.76.301.2] [image:2.595.107.491.555.757.2]with increasing ST temperature.
TEM analysis showed that ! phase precipitates in all solution treated alloys. Besides, for TFCA alloy, precipitated phase was also observed in addition to thephase and the precipitated!phase. The amount of each precipitated phase tends to increase with increasing ST temperature.
3.2 Tensile properties
The tensile properties of the solution treated alloys are shown in Fig. 3. Tensile strength and 0.2% proof stress of both alloys decrease with increasing ST temperature. The tensile strength and 0.2% proof stress of the solution treated TFC alloys decrease slightly from 101510MPa and
99010MPa at a ST temperature of 1023 K (TFC1023) to
99020MPa and 97520MPa at a ST temperature of 1048 K (TFC1048), respectively, as can be seen in Fig. 3(a).
The tensile strength and 0.2% proof stress of TFCA alloy decrease from 98010MPa and 97020MPa at a ST temperature of 1098 K (TFC1098) to 94020MPa and
91020MPa at a ST temperature of 1123 K (TFC1123),
respectively. The elongation and reduction in area of TFC alloy increase slightly from 194% and 522% at a ST temperature of 1023 K (TFC1023) to202% and552% at
a ST temperature of 1043 K (TFC1048) as can be seen
(Fig. 3b). However, an opposite trend is seen for the ductility (elongation and reduction in area) of TFCA alloys against
solution treatment temperature, where the elongation and reduction in area of TFCA alloy decrease considerably from
194% and 495% at a ST temperature of 1098 K (TFCA1098) to105% and266% at a ST temperature of
1123 K (TFCA1123).
The tensile strength and elongation of the alloys are also tabulated in Table 2 (all present data in the averaged values). For comparison, the strength and elongation of some existing biomedical materials are also given in this Table. The tensile strengths of the solution treated TFC and TFCA alloys are much higher than those of 316L stainless steel, vitallium (CoCr), pure-Ti, and solution treated Ti–29Nb–13Ta–4.6Zr, and are close to that of Ti–6Al–4V and aged Ti–29Nb–13Ta– 4.6Zr.
3.3 Fatigue strength, fatigue ratio and biofunctionality
Maximum cyclic stress against number of cycles to failure (S–N) curves of both TFC and TFCA alloys is shown in Fig. 4. For comparison, the range of S-N curves of Ti–6Al– 4V is also shown in the figure. It can be seen that the fatigue limit (the lowest maximum cyclic stress that can be sustained by specimens without failure for the number of cycles more than 107) of TFC alloy is much higher than that of TFCA alloy. The fatigue limits of both solution treated TFC alloys are nearly the same, around 790 MPa, while, the fatigue limit of TFCA alloy decreases with increasing ST temperature.
T
ensile str
ength,
σB
/ MP
a
0.2% pr
oof str
ength,
σ0.2
/ MP
a
Elongation, El, (%)
Reduction in
Ar
ea, RA, (%)
(a) (b)
850 900 950 1000 1050
1000 1040 1120 1160
UTS YS
0 10 20 30 40 50 60
1000 1040 1120 1160
El RA
Solution treatment temperature / K Solution treatment temperature / K
TFC TFCA TFC TFCA
TFC1023 TFC1048 TFCA1098TFCA1123 TFC1023 TFC1048 TFCA1098TFCA1123
[image:3.595.112.490.74.219.2]Fig. 3 Tensile properties of solution treated TFC and TFCA alloys.
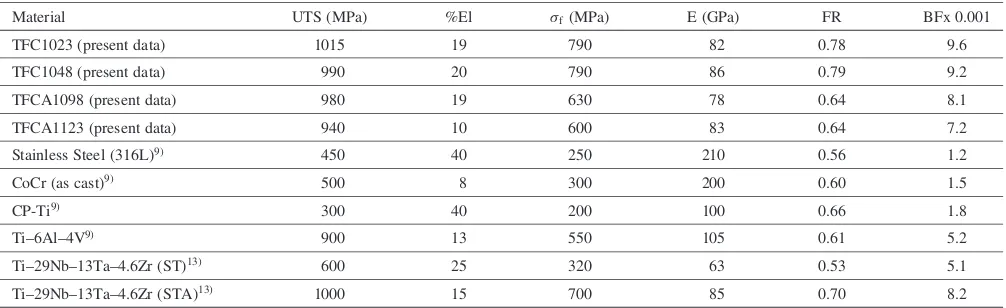
Table 2 Mechanical properties of various metallic biomaterials.
Material UTS (MPa) %El f(MPa) E (GPa) FR BFx 0.001
TFC1023 (present data) 1015 19 790 82 0.78 9.6
TFC1048 (present data) 990 20 790 86 0.79 9.2
TFCA1098 (present data) 980 19 630 78 0.64 8.1
TFCA1123 (present data) 940 10 600 83 0.64 7.2
Stainless Steel (316L)9Þ 450 40 250 210 0.56 1.2
CoCr (as cast)9Þ 500 8 300 200 0.60 1.5
CP-Ti9Þ 300 40 200 100 0.66 1.8
Ti–6Al–4V9Þ 900 13 550 105 0.61 5.2
Ti–29Nb–13Ta–4.6Zr (ST)13Þ 600 25 320 63 0.53 5.1
Ti–29Nb–13Ta–4.6Zr (STA)13Þ 1000 15 700 85 0.70 8.2
E = Modulus of elasticity, UTS = Ultimate tensile strength,f= Fatigue limit, El = Elongation, FR = Fatigue ratio (f/UTS), BF = Biofunctionality
[image:3.595.47.550.275.429.2]The fatigue limits of TFCA1098 and TFCA1123 are around
630 MPa and 600 MPa, respectively. These are in the range of the reported fatigue limit of the most popular titanium alloy, Ti–6Al–4V, that is 500–700 MPa.10) Comparing to the
fatigue limit of the existing biomaterials such as 316L stainless steel, CoCr and cp-Ti, that of the present alloys is much higher as can be seen in Table 2.
The fatigue ratio, which is the ratio of fatigue limit to tensile strength, of both solution treated TFC alloys is very close, that is around 0.78 for TFC1023and 0.79 for TFC1048as
shown in Table 2. These values are about 22% higher than the fatigue ratio of both solution treated TFCA alloys, which is about 0.64. However, the fatigue ratio of TFCA alloy is still in the upper range of that of Ti–6Al–4V (0.5 to 0.7). The
fatigue ratio of other existingtype titanium alloys such as Ti–15V–3Cr–3Sn–3Al alloy and Ti–15Mo–5Zr–3Al alloy are also reported in this range.10)Moreover, it is higher than
the fatigue ratio of the existing biomaterials such as 316L stainless steel and CoCr (see Table 2) and the conventional structural materials, steels and aluminum (0.4 to 0.5).
Biofunctionality, BF, that is the ratio of fatigue limit to modulus of elasticity, of the alloys and some existing biomedical materials is shown Table 2. All fatigue limit data are for fatigue tests with a stress ratio, R, of 0.1. It can be seen that BF of the TFC and TFCA alloys is much higher than that of the existing biometallic materials. Biofunctionality of TFC alloy, for example, is about 9.2–9.6, which is about 8 times of that of 316L stainless steel, or about 5 times of that of pure-Ti. This excellent biofunctionality gives a compara-tive advantage to the new alloys used for biomedical applications that requests high strength but low stiffness materials.7,9)
3.4 Fracture morphologies
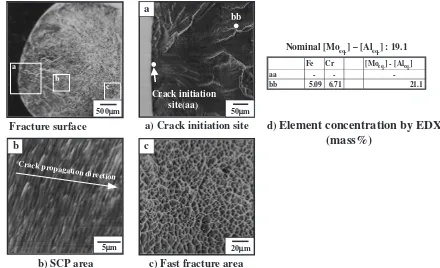
Typical SEM photographs of fracture surfaces of the fatigue tested alloys for low and high cycle fatigue life regions are shown in Figs. 5 and 6. Low cycle fatigue life (LCF) region means the region where N is less than105in S–
N curves, while, high cycle fatigue life (HCF) region means the region where N is more than105. A fatigue crack initiates from the surface and then propagates towards the inside for TFC1023 specimens tested in the LCF region (Fig. 5.
How-ever, the crack tends to propagate from the subsurface for the specimens tested in the HCF region, as typically shown in Fig. 6. Regardless of ST temperature, it is found that 13 of 14 TFC specimens tested in the HCF region show subsurface (internal) crack initiation (Fig. 4). In Fig. 4, the specimen Number of cycles to failure, Nf
Maximum cyclic str
ess,
σa
/ MP
a
103 104 105 106 107
500 600 700 800 900 1000
R=0.1 f=10Hz
σa /σB = 0.78
σa / σB = 0.79
TFC1023
TFCA1098
Ti-6Al-4V TFCA1123 TFC1048
σa / σB = 0.5 ~ 0.7
Slash mark / : Internal crack initiation Arrow mark : Specimen not broken
σa / σB = 0.64
Fig. 4 S–N curves of solution treated TFC and TFCA alloys in comparison with the range of S–N curve of Ti–6Al–4V (STA)
Fe Cr [Moeq.] - [Aleq.]
aa - -
-bb 5.09 6.71 21.1
a) Crack initiation site
c) Fast fracture area
50µm20µm
Nominal [Moeq.] – [Aleq.] : 19.1
Crack initiation site(aa)
bb
a
Crack pr
opagation dir ection
b) SCP area
5µmb
c
d)
Element concentration by EDX
(mass%)
a
b
c
Fracture surface
500µm
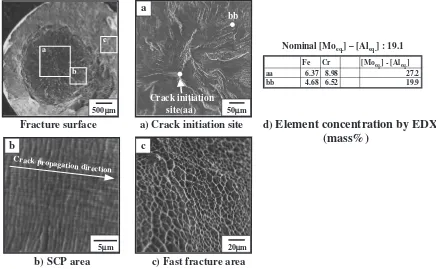
[image:4.595.56.283.72.235.2] [image:4.595.74.514.488.756.2]with internal crack initiation is denoted by a slash mark in its datum point. In the case of TFCA alloy, most of the specimens show internal crack initiation. Only 2 of 14 specimens tested in the LCF or HCF region that show surface crack initiation in each region regardless of solution treat-ment temperature, as can be seen in Fig. 4. Detailed information on fracture modes of each solution treated alloy is given in Table 3.
Striations and dimples are observed in stable crack propagation (SCP) and fast fracture areas, respectively, of the solution treated TFC alloys tested in the LCF region (Fig. 5 and Table 3). The present of dimples in the whole fast fracture area indicates that the specimens failed in ductile manner, while, the fracture surfaces of TFCA alloy tested in the LCF region showed the same facet as observed on the fracture surface of the tensile tested specimens. It was difficult to observe striation in the SCP area of TFCA alloy. Domination of cleavage fracture surface in this area indicates that the alloy failed in brittle manner. In the fast fracture area of TFCA1098, small amount of dimples are obtained, but for
TFCA1123, the fracture surfaces consist of cleavage facets in
the LCF region.
4. Discussions
The fatigue strengths of TFC and TFCA alloys are found relatively higher than those of the existing biometallic materials (Table 2). The fatigue strength of TFC alloy is very high and almost independent of solution treatment temperature (Fig. 4). However, the fatigue strength of TFCA alloy is relatively low and strongly depends on solution treatment temperature, especially, in the LCF region. The fatigue strength, obviously, relates to microstructure of the alloys. The relationship between fatigue strength, fracture morphology and microstructure, especially the degree of phase stability, and the microstructural analysis using an alloy design method are discussed in detail below.
4.1 Relationship between fatigue strength, fracture
morphology and microstructure
For type and some þ type titanium alloys, it is commonly observed that they have high fatigue strength.11–19) The high fatigue strength of these alloys is generally associated with internal crack initiation. However, it is difficult to identify the internal crack initiation site, and
Fe Cr [Moeq.] - [Aleq.]
aa 6.37 8.98 27.2
bb 4.68 6.52 19.9
Crack propagation dir
ection
a) Crack initiation site
b) SCP area
c) Fast fracture area
50µm 500µm
5µm 20µm
Nominal [Moeq.] – [Aleq.] : 19.1
Crack initiation site(aa)
bb
a
b c
a
b
c
d)
Element concentration by EDX
(mass%)
Fracture surface
[image:5.595.78.514.74.343.2]Fig. 6 Typical SEM fractographs and element concentrations of TFC1048specimen for high cycle fatigue life region. SCP is the Stable Crack Propagation.
Table 3 Fracture modes of solution treated TFC and TFCA alloys.
Low cycle fatigue life (LCF) region High cycle fatigue life (HCF) region
Crack initiation site
Stable crack propagation area
Fast fracture area
Crack initiation site
Stable crack propagation area
Fast fracture area
TFC1023 surface striation dimple subsurface striation dimple
TFC1048 surface striation dimple subsurface facet dimple+cleavage
TFCA1098 subsurface striation dimple+cleavage subsurface striation+facet dimple
[image:5.595.45.550.405.502.2]its mechanism may change according to microstructure. Umezawaet al.11)have proposed the microcracking in small
grains by stress or strain concentration due to localized deformation in Ti–5Al–2.5Sn. The internal fatigue crack initiation in Ti–15V–3Cr–3Al–3Sn alloy with rod-type precipitates is associated with the faceting of debonded microcracks between the favorably orientedandphases in the close vicinity of grain boundary.12)On the other hand,
for Ti–15V–3Cr–3Al–3Sn alloy with finely distributed needle-type precipitates, a multiple occurrence of grain boundary cracking is believed to be responsible for internal fatigue crack initiation.12)
All of these facts, however, indicate that the preferred sites for crack initiation are around secondary phase. Since the formation of secondary phase leads to stabilizephase and change elemental distributions around the secondary phase, the degree ofphase stability at crack initiation sites can be determined by measuring the elemental distributions on the fracture surfaces using EDX. For Ti–Fe–Cr–Al system alloys, the degree ofphase stability, which is the resultant of Mo equivalent, [Mo]eq,4)and Al equivalent, [Al]eq,4)can
be calculated using following expression:4)
Degree of phase stability [Mo]eq{[Al]eq
¼2.5[Fe]þ1.25[Cr]{[Al]: ð1Þ
[Fe], [Cr], and [Al] are chemical compositions in mass %. Using this formula, the degrees of phase stability of TFC and TFCA alloys at nominal composition ([Mo]eq–[Al]eq
nominal) are calculated to be 19.1% and 15.4%, respectively. Elemental distributions of Fe, Cr and Al, and [Mo]eq–[Al]eq
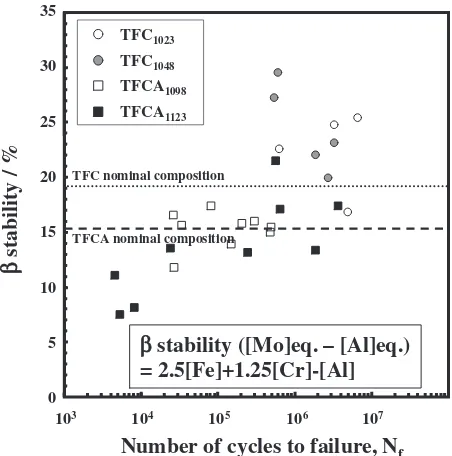
at the crack initiation site (CIS) and the stable crack propagation (SCP) area, for example, are shown in Figs. 5(d) and 6(d). The elemental distribution of each specimen near the internal crack initiation site as a function of number of cycles to failure is shown in Fig. 7. The dotted lines in the figure are the represent nominal composition of each element. Since the internal crack initiation in TFC alloy is observed only in HCF region, the data of TFC alloy exist only in the HCF region in the figure. It can be seen that the internal crack initiation site has relatively high content of Al and relatively small content of Fe and Cr for the specimens tested in the LCF region (Fig. 7). On the other hand, the crack initiation site has small content of Al and high content of Fe and Cr for those treated in the HCF region. Figure 8 shows the degree of phase stability of each specimen near the internal crack initiation site as a function of number of cycles to failure. This figure indicates that the internal crack initiation site in the LCF region is in the area that has a relatively low degree of phase stability. Meanwhile, the internal crack tends to initiate from the area that has a relatively high degree ofphase stability in the HCF region. The degrees ofphase stability at the internal crack initiation site of the solution treated TFC alloys are about 20–30%, higher than that for the nominal composition (19%). It is, therefore, considered that, local slip occurs easily in this area and it nucleates a crack.
It can be also seen from Fig. 8 that the internal crack initiation tends to occur at the low stability area in the LCF region. For TFCA alloy, especially TFCA1123, for example,
the phase stability at internal crack initiation site is very
low, about half of that for the nominal composition. The low phase stability is obviously observed at precipitatedand ! phases. Both kinds of precipitates are brittle. This is, therefore, to be a reason for the formation of flat facets and cleavage fracture surfaces near the crack initiation site (Table 3). The internal crack initiation is considered to occur due to slip plane decohesion initiated in precipitated phases.13) Neal et al.16) proposed that the precipitates are cleaved due to restricted slip and to the operative slip system, the cleavage plane and the plane of maximum stress. Ruppen
et al.19)reported that the cleavage occurs at {100} plane of 0
1 2 3 4 5 6 7 8 9 10
Element concentration / mass%
Fe : TFC1023
Cr : TFC1023
Fe : TFC1048
Cr : TFC1048
Fe : TFCA1098
Cr : TFCA1098
Al : TFCA1098
Fe : TFCA1123
Cr : TFCA1123
Al : TFCA1123
103 104 105 106 107
Number of cycles to failure, N
fAl Fe Cr
Fig. 7 Elemental concentrations at internal fatigue crack initiation sites of solution treated TFC and TFCA alloys.
Number of cycles to failure, N
f TFC1023TFC1048
TFCA1098
TFCA1123
0 5 10 15 20 25 30 35
103 104 105 106 107
TFC nominal composition
TFCA nominal composition
β
stability / %
β
stability ([Mo]eq. – [Al]eq.)
= 2.5[Fe]+1.25[Cr]-[Al]
[image:6.595.312.540.73.301.2] [image:6.595.315.541.356.584.2]phase due to the inconsistent slip between {1100} plane of phase and {110} plane ofphase.
4.2 Microstructural analysis using an alloy designing
method
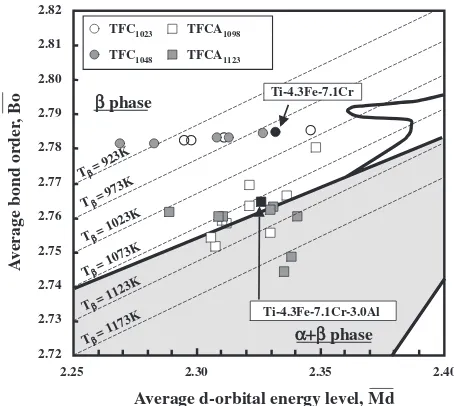
The fatigue characteristics of the alloys seem to relate closely with the degree of phase stability as described above. However, information on a concrete solution treat-ment temperature to control phase stability and to avoid precipitation ofphase is not obtained by this concept. It is necessary, therefore, to analyze the microstructure using an alloy designing method. By assuming that the change of transus is mainly due to the change of alloying elements, the transus was presumed by the DV-Xcluster method20)in this study. The average bond order, Bo, and the average energy level of d-orbital, Md, were calculated from the elemental distributions. The result is shown in Fig. 9. The dotted lines in the figure are the isotherm line of thephase transformation (transus). Thetransus temperatures for the nominal compositions of TFC alloy and TFCA alloy are 989 K and 1077 K, respectively. Thetransus of the solution treated TFC alloy near the crack initiation sites decreases due to the high content of Fe or Cr in that area. On the other hand, the transus increases significantly up to 1203 K in the solution treated TFCA alloy as a result of local segregation of Fe, Cr, and Al near the crack initiation sites. This means that the present solution treatment temperature is not high enough to provide a uniform singlephase structure in TFCA alloy. It can be seen that most of TFCA1023data (5 of 8) lie in the
þ field, which means phase exists near the internal crack initiation sites. These data belong to the specimens with the flat facets and cleavage surfaces on the fracture surface and relatively low fatigue strength in the LCF region. This indicates that the formation of phase, as a result of Al segregation, causes the early crack initiation and then decreases the fatigue strength of the alloy.
It can be concluded that the non-uniform microstructure and the low strength of TFCA alloy as compared with those of TFC alloy is due to the addition of Al. Segregation of Al leads to formprecipitates that become crack initiation sites. It is, therefore, strongly considered that the uniformity of microstructure and the strength of TFCA alloy can be improved by decreasing the amount of Al, or by conducting thermomechanical treatment with solution treatment proc-esses at a high temperature for a short time to make more homogenous Al distribution in the alloys. An investigation on the effect of thermomechanical treatment on the mechanical properties of the alloys is carrying out and the results will be reported separately.
5. Conclusions
Fatigue characteristics of new low costtitanium alloys, Ti–4.3Fe–7.1Cr (TFC alloy) and Ti–4.3Fe–7.1Cr–3.0Al (TFCA alloy), for healthcare and medical applications were investigated. The alloys were solution treated in thephase field. Fatigue tests were carried out at a stress ratio, R, of 0.1 and a frequency of 10 Hz. The following results were obtained.
(1) The fatigue limits of the alloys are high, as much as
790 MPa for TFC alloy and 610–630 MPa for TFCA alloy. These are higher than those of pure-Ti, Ti–6Al– 4V and the existing bimetallic materials such as 316L stainless steel and CoCr.
(2) The fatigue ratios of TFC alloy (0.78) and TFCA alloy (0.64) are higher than those of steels and aluminum (0.4 to 0.5), and Ti–6Al–4V (0.5 to 0.7), while, the biofunctionality of TFC alloy (9.2–9.8) and TFCA alloy (7.2–8.1) is much higher than that of the existing biomedical materials such as stainless steel (1.2), CoCr (1.5), pure-Ti (1.8) and Ti–6Al–4V (5.2).
(3) In general, a crack initiates from the surface in the LCF region and from subsurface (internal) in the HCF region for TFC alloy, while, in the case of TFCA alloys, a crack tends to initiate from the subsurface in both LCF and HCF regions.
(4) The internal crack initiation tends to occur at the area with lowphase stability in the LCF region and at the area with high stability ofphase in the HCF region. (5) The relatively low fatigue strength of TFCA alloy is due
to the addition of Al that leads to precipitatephase in which crack initiation and facet formation are easier to occur.
REFERENCES
1) Homepage of Ministry of Health, Labor and Welfare of Japan,http:// www.mhlw.go.jp/
2) M. Ikeda, S. Komatsu, M. Ueda, T. Imose and K. Inoue:The forth Pacific Rim International Conference (PRICM) 4, ed. by S. Hanada, Z. Zhong, S. W. Nam and R. N. Wright, (JIM, Sendai, 2001) pp. 213– 216.
3) M. Ikeda, S. Komatsu, K. Inoue, M. Ueda and A. Suzuki: Mater. Trans. 45(2004) 1566–1570.
4) T. Souma: Master Thesis, Toyohashi University of Technology, Japan, 2004 (in Japanese).
5) M. Ikeda, S. Komatsu, M. Ueda, T. Imose and K. Inoue:LiMAT-2001, ed. by N. J. Kim, C. S. Lee and D. Eylon, (2001), pp. 73–78. 6) M. Niinomi: Metall. Mater. Trans. A3(2002) 477–486.
2.72 2.74 2.76 2.78 2.80 2.82
2.25 2.30 2.35 2.40
Average d-orbital energy level, Md
A
v
erage bond order
, Bo
2.81
2.73 2.75 2.77
2.79 β phase
α+β
α+β phase
TFC1023
TFC1048
TFCA1098
TFCA1123
Ti-4.3Fe-7.1Cr-3.0Al
Tβ = 1173K
Tβ = 1073K
Tβ = 973K
Tβ = 1123K
Tβ = 1023K
Tβ = 923K
Ti-4.3Fe-7.1Cr
[image:7.595.312.539.73.276.2]7) M. Niinomi: Sci. Technol. Adv. Mater.4(2003) 445–454.
8) Gunawarman, M. Niinomi, T. Akahori, T. Souma, M. Ikeda and H. Toda: Mater. Sci. Eng. C, to be published.
9) J. Breme:Titanium and Its Alloys for Medical Applications in Titanium and Titanium Alloys, ed. by C. Leyens and M. Peters, (Institute of Materials Research, Germany, 2003), pp. 423–452.
10) R. Boyer, G. Welsch and E. W. Collings: Materials Properties Handbook: Titanium Alloys, (ASM Int, Material Park, OH, 1994). 11) O. Umezawa, K. Nagai and K. Ishikawa: Mater. Sci. Eng.A129(1990)
217–221.
12) S. J. Kim, M. Hagiwara, Y. Kawabe and S. S. Kim: Mater. Sci. Eng. A 334(2002) 73–78.
13) M. Niinomi: Biomaterials,24(2003) 2673–2683.
14) R. Chait and T. S. DeSisto: Metall. Trans. A8(1997) 1017. 15) S. K. Jha and K. S. Ravi Chandran: Scr. Mater.48(2003) 1207–1212. 16) D. F. Neal and P. A. Blenkinshop: Acta Meter.24(1976) 59–63. 17) V. Sinha and W. O. Soboyejo: Mater. Sci. Eng. A319–321(2001) 607–
612.
18) A. Atrens, W. Hoffelner, T. W. Duerig and J. E. Allison: Scr. Metall.17 (1983) 601–606.
19) J. Ruppen, P. Bhowal, D. Eylon and A. J. Macevely: ASTM STP, (1979), pp. 47–68.