Cooling Rate and Graphite Structure of Final Eutectic
Solidification Part in Cast Iron
*Hirokazu Kawashima
1, Katutoshi Sigeno
1, Masaki Kusubae
1and Kazuhiro Tachibana
21Matsubara Co. Ltd., Seki 501-3924, Japan
2Graduate School of Science and Engineering, Yamagata University, Yonezawa 992-8510, Japan
A CE meter cup was modeled using a casting simulation software and cooling curves at different points of the casting model were calculated. In setting temp-solid fraction parameters, an Fe-C-Si ternary equilibrium phase diagram was used with a substantive temperature range in the equilibrium phases so that the-Fe+G+L phases can be considered. In studying the calculated cooling curve, a rapid temperature drop was found in the cooling curve in the final solidification period. This rapid cooling occurred during eutectic solidification. The structure formed by the rapid cooling was found as chill or D-type graphite because the liquid phase is cooled rapidly to below the eutectic temperature. This rapid cooling may be one of the causes of D-type graphite near the final solidification part of thick iron castings.
[doi:10.2320/matertrans.F-M2011829]
(Received January 25, 2011; Accepted September 7, 2011; Published November 25, 2011)
Keywords: computer aided engineering (CAE), cast iron, eutectic reaction, inverse chill, simulation, solidification
1. Introduction
In iron castings, the chilled iron structure called the inverse chill can be formed at deep inner regions of thick castings. Although obvious inverse chills have rarely been seen in modern castings because of the improvement of the inocu-lation technology, the microstructures that seem to be formed by rapid cooling are often observed at the final solidification part of the casting, for example, the D-type graphite.
The various causes of the inverse chill have been suggested as follows:1)
(1) Carbide stabilizing elements segregate at the center of thick castings,
(2) The inoculation is insufficient,
(3) And/or the cooling rate is particularly fast at the center of the casting.
However, these suggestions are not enough to explain sufficiently the reasons why the inverse chill is formed only at the thick parts of the casting.
It is widely known that the rapid temperature drop can be found at the point just after the end of the eutectic solidification when primary differentiation is conducted on a cooling curve recorded by a CE meter. However the reasonable cause of the rapid temperature drop has not been reported.
On the other hand, the conventional cooling curve measured with a CE cup does not show the real cooling curve because the temperature is measured through an outer silica tube (4mm, 1 mm-thick) for a thermocouple. There-fore, it is difficult to measure the temperature with the CE cup during the eutectic solidification.
We have simulated the cooling curve in the CE cup by numerical analysis software, in order to see whether or not the rapid temperature drop can be found at the final solidification part just like the way it appears on the conventional cooling curves with the actual measurement. Also, we have allocated certain points in the simulated CE
cup for cooling curve measurement in order to understand the possibilities of the formations of the inverse chills and D-type graphite.
2. Experimental Procedures
2.1 Actual measurement
The molten iron was poured from a cupola into the forehearth, and held for ten minutes. Then, the molten iron with 0.05% amount of carbon inoculation was transferred to a ladle. After 30 s from the inoculating, the molten iron was poured into a CE cup connected with the digital recorder, and the cooling curves were recorded until the end of the solidification. The CE cup for this experiment was not the tellurium-added type which is commonly used for measure-ment of the cemeasure-mentite eutectic temperature, but the type without any additives in order to record a cooling curve of the practical cast iron. The temperatures were recorded at intervals of 1/2 s for 300 s just after the pouring in order to obtain the cooling curve until the post-solidification period. Figure 1 shows the shape of the CE cup and the measuring points. Table 1 shows the chemical composition of the cast iron. Figure 2 shows the result of the actual measurement and the curve calculated by primary differentiation.
2.2 Setting latent heat emission pattern
In order to find the appropriate pattern of the latent heat emission, the temperatures at the thermocouple in the silica tube just like a real CE cup were calculated. The latent heat emission patterns were determined by the relationship between temperature and solid fraction by using simulation software. The definition of the transformation temperatures were based on the result of the actual measurement and the parameters were set as follows:
(1) The liquidus temperature (TL) was assumed to be 1468 K measured by the actual measurement.
(2) The eutectic solidification start temperature (TES) was assumed to be 1418 K measured as the recalescence temperature.
As to the eutectic solidification end temperature (TEE), three different parameters were set to vary the eutectic temperature range (TE) as follows:
(a) Based on the Fe-C binary equilibrium phase diagram,
TEE was assumed to be 1417 K because the eutectic temperature is constant. Therefore, the minimum temperature difference was defined by subtractingTEE fromTES, i.e.,TE:TESTEE¼1K,
(b) Based on the Fe-C-Si ternary equilibrium phase diagram,2) T
EE was assumed to be 1408 K because Silicon content is taken into account on the eutectic temperature range, i.e.,TE:TESTEE¼10K, (c) Based on the multiple equilibrium phase diagram,TEE
was assumed to be 1403 K because contents of phosphorus, manganese, sulfur, etc. are also taken into account on the eutectic temperature range, i.e., TE: TESTEE¼15K.
ADSTEFAN Ver.11, a casting simulation software, was used for the calculation of molten metal flow and the temperature during solidification. Table 2 shows the properties of the cast
iron, the CE cup and the silica tube used for this experiment. Table 3 shows the parameters for the relationship between temperature and solid fraction. The results of the calculation are shown in Fig. 3 (a), (b) and (c).
2.3 Cooling curves at each measuring point
As shown in Fig. 1, nine measuring points were set in the following order:
(1) On the top of the silica tube (Point 1),
(2) At the final solidification part, which is 4 mm above Point 1 (Point 3),
(3) On the same level of Point 3, at seven points from Point 3 to the casting surface with 2 mm intervals (Point 4–10).
The cooling curves at each point were calculated individu-ally. Figure 4 shows the cooling curves at each point.
2.4 Observation of the microstructures
The graphite structure and the matrix structure of the cast irons were observed in order to estimate the solidification process and the cooling rate.
3. Results
3.1 Actual measurement
As shown in Fig. 2, the rapid temperature drop was measured in the final period of the eutectic solidification, as well as the common case of cast iron cooling. The range of the rapid temperature drop was from about 1393 K (1120C) to about 1360 K (1087C). The cooling rate during the rapid temperature drop was about 3 K/s.
[image:2.595.59.281.74.241.2]3.2 Comparison of latent heat emission patterns Comparisons between the cooling curves calculated by the three different parameters and the measured cooling curve are shown in Fig. 3. The cooling curves of TE ¼10K (Fig. 3(b)) and TE¼15K (Fig. 3(c)) obviously agreed with the measured cooling curve rather than the cooling
Table 1 Chemical composition of cast iron (mass%).
C Si Mn P S
3.32 2.05 0.739 0.051 0.087
−3.0 −2.0 −1.0 0.0 1.0 (900) (1000) (1100) (1200) (1300)
0 50 100 150 200 250 300
Cooling rate,K/s T emp,K( ° C) Time,s Measurement Differentiation 1573 1473 1373 1273 1173
Fig. 2 Cooling curve and differentiation curve for measured.
Table 2 Material properties.
Material Density
(g/cm3)
Thermal conductivity (cal/cmSdeg)
Specific heat (cal/gdeg)
Latent heat (cal/g)
Casting FC250 6.4 0.05 0.17 50
CE-cup Shell mold 1.7 0.0015 0.2 —
[image:2.595.303.548.84.162.2]Quartz glass Silica grass 2.21 0.0032 0.17 —
Table 3 Temp-solid fraction parameters.
TL TES TEE
(a)TE¼1K
Temp, K 1486 1418 1417
Solid fraction 0.00 0.33 1.00
(b)TE¼10K
Temp, K 1486 1418 1408
Solid fraction 0.00 0.33 1.00
(c)TE¼15K
Temp, K 1486 1418 1403
Solid fraction 0.00 0.33 1.00
Sect. A
−
A
P1 P3 P4 P5 P7 P8 P9 P10 P6A
A
[image:2.595.304.550.203.300.2] [image:2.595.51.283.284.508.2]curve of TE¼1K (Fig. 3(a)), especially on the final solidification period. Therefore, it is clear that there is a temperature range of the eutectic solidification. When comparing the temperature ranges of TE ¼10K and
TE ¼15K, the temperature ranges are almost the same. Considering all the information, we decided to use the cooling curve ofTE¼10K for further analysis.
The rapid temperature drop after the eutectic solidification was well simulated by the numerical analysis for this experiment although the recalescence at the graphite eutectic period was not simulated. The rapid temperature drop can be commonly observed on the cooling curves with small undercooling by excessive inoculation or with solidification into white iron. Therefore, we have concluded that the calculation of the rapid temperature drop would not be affected by the nonexistence of the undercooling phenom-enon.
3.3 Analyzing cooling curves for measuring points Figure 4 shows that the most outer point (Point 10) took a steady cooling rate in the eutectic solidification period while the temperatures at the more inner points were kept for the longer time at 1418 K (1145C) before the rapid temperature drop. In the final solidification period in the simulated cooling curve, the rapid temperature drop of about 30 K occurred as well as the measured cooling curve.
Figure 5 shows the cooling curve and the solid fraction curve for the final solidification part (Point 3) during the solidification period. As shown in Fig. 5, it is clear that the (1100)
(1140) (1180) (1220) (1260)
0 40 80 120 160
T e mp, K( ° C) Time,s 1413 1453 1493 1533 1373
0 40 80 120 160
Time,s Simulation Measurement Differentiation(Simulation) Differentiation(Measurement) −3.0 −2.0 −1.0 0.0 1.0
0 40 80 120 160
Cooling rate,K/s
Time,s
(a) ΔTE= 1K (b) ΔTE = 10K (c) ΔTE = 15K
Fig. 3 Cooling curves and the first differentiation curves for measured and calculated values.
(1100) (1120) (1140) (1160) (1180) (1200) (1220)
0 20 40 60 80 100 120 140 160 180
T emp,K( ° C) Time,s P3 P4 P5 P6 P7 P8 P9 P10 1373 1413 1433 1453 1473 1493 P7 P3 P10 1393
Fig. 4 Calculated cooling curves of each point (P3P10).
0 0.2 0.4 0.6 0.8 1.0
(1120) (1140) (1160) (1180) (1200)
20 40 60 80 100 120 140 160 180 Solid fraction T e mp,K( ° C) Time,s P3 Solidus ratio 1393 1413 1433 1453 1473
A type graphite
D type graphite Primary-γ
TL
TES
TEE
[image:3.595.89.509.71.340.2] [image:3.595.64.276.385.541.2] [image:3.595.322.533.386.608.2]rapid temperature drop in the final solidification period occurred even at the time when liquid phase remained inside the castings.
3.4 Structure analysis
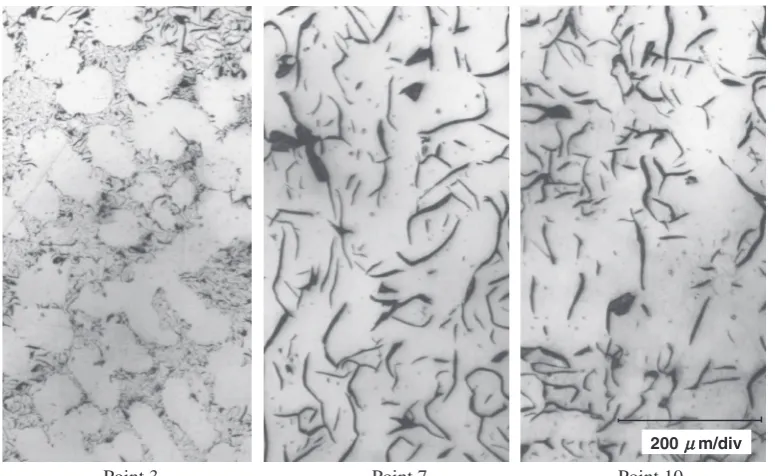
Figure 6 shows the graphite structures on the final solid-ification part (Point 3), the most outer point (Point 10) and the point in the middle of them (Point 7). On Point 3, moderately-cooled structure (i.e., A-type graphite) and rapidly-cooled structure (i.e., D-type graphite) appeared together in mottled structure. Figure 7 shows the image of the mottled structure by a low magnification. While Point 3 had some D-type graphite, Point 7 only had the A-type graphite. Even on the most outer point (Point 10), its main structure was the A-type graphite with the B-type graphite rather than the D-type graphite. The matrix structure of the D-type graphite area on the final solidification part was pearlite structure as shown in Fig. 8.
4. Analysis
The rapid temperature drops detected both on the measured and the simulated cooling curves for Point 1 were identified as the temperature drop during the eutectic solidification in the final solidification period. By calculating the cooling curves of the cast iron based on the temperature range of 10 K in the eutectic solidification, it has become clear that the temperature drop actually started not after but during the solidification when the molten iron partially remained in the phase of-Fe+G+L.
As the result of the graphite structure observations at the final solidification part, the mottled structure coexists with the A-type and the D-type graphite. It is considered that the mottled structure is an evidence to from the chilled structure by the rapid temperature drop in the liquid/solid phase. The cooling rate can be assumed to be faster than the general cooling rate for thin castings due to the evidence that the
Point 3 Point 7 Point 10
200μμm/div
Fig. 6 Graphite shape on Point 3, 7 and 10.
[image:4.595.105.493.70.308.2] [image:4.595.55.284.355.527.2] [image:4.595.312.540.357.526.2]matrix structure around the D-type graphite had pearlite structure without the transformation to be ferrite.
5. Conclusions
According to the cooling rate of both the measured cooling curve and the simulated cooling curve of cast iron, and microstructure observations, the following conclusions have been obtained:
(1) In analyzing the solidification process of cast iron, it is recommended to use the model that has a certain temperature range (approx. of 10 K) in the eutectic solidification in accordance with the Fe-C-Si ternary equilibrium phase diagram.
(2) The above-mentioned model enables us to confirm that the rapid temperature drop on the actual measurement occurs during the eutectic solidification.
(3) The matrix structure around the D-type graphite in the final solidification part shows pearlite structure. This fact supports the above-mentioned rapid cooling theory.
REFERENCES
1) Japan Foundry Engineering Society: Casting Defects and Their Remedies, (Japan Foundry Engineering Society, Tokyo, 2007) p. 171. 2) American Society for Metals: Metals Handbook —Properties and