We investigate wrinkled thin films by small angle light scattering and microscope, demonstrating that wrinkled thin films are gratings. The diversity of diffraction patterns is realized by a simple light path through wrinkles. Fourier transform is introduced to explain the position and pattern of diffraction orders. The analysis could be a fast and quantized characterization for complex wrinkles.
[doi:10.2320/matertrans.M2016287]
(Received August 19, 2016; Accepted October 3, 2016; Published November 28, 2016)
Keywords: wrinkle, diffraction pattern, Fourier transform (FT)
1. Introduction
Spontaneous wrinkle is usual in nature as fingerprints1),
flower petals2). Also its sinusoidally buckled surface with a
dominant periodicity3,4) keeps spurring interest in
engineer-ing. Researches can be roughly divided into two groups con-cerning to wrinkles application. First is to be the functional patterned surface, such as superhydrophobic coating5), high
light-harvesting efficiency device6), template for aligning
col-loidal particles7) and living cells8), tunable optical grating9)
and so on. Second is as a strategy for measuring thickness, elastic moduli, Poisson s ratio, and residual stress10,11) due to
its sensitivity to the mechanical and thermal properties of the system.
For wider application of wrinkles, various methods are in-troduced to guide them as pre-patterning the substrate before coating and mechanical stretching or compression.12,13) Thus
abundant and diversified morphologies inspired from basic bulking are displayed. Star-burst pattern are generated by us-ing stripes of UVO lines.4) Concave and convex structures
emerge while manipulation the adhesion at the interface.12)
Lamellar, hexagonal, herringbone and their variations can also be created by varying the physical properties.14)
An effective approach to extract quantitative information from extremely diversified wrinkles patterns is of paramount importance. Small-angle light scattering is a convincing way for automatic pattern recognition, founded on the basic phys-ical phenomenon diffraction.15) In addition, it is a
well-estab-lished system to get the averaged wavelength of wrinkles since it can minimize measurement error and quickly provide the indispensable information in spite of the diversity and complexity of samples for both off-line and in-situ observa-tion.5,16–19) However, wrinkle surface morphology could also
be predicted other than the wavelength by understanding the derivation mechanism from wrinkles to diffraction patterns, which is lacking at present.
In this paper, diffraction pattern and character wavelength and their relevance to several quintessential wrinkles were taken into considerations experimentally and theoretically. Several straightforward models were introduced for getting
the precise understanding. Fast Fourier transform (FFT) and inverse FFT (iFFT) was also introduced. We hope the analysis can provide a guidance to rapidly study both simple and com-plex wrinkles, and path the way for in situ observing the wrin-kle s evolution in small chambers for various preparations.
2. Experimental Methods
2.1 Wrinkles preparation
In this study, a one-step room-temperature and atmosphere pressure PECVD (Plasma enhanced chemical vapor deposi-tion) was employed to prepare a compressively stressed film with micro scale roughness, without any intentional heat or mechanical stretch. A high voltage power supply of 20 KHz was used for plasma generation between two parallel plate electrodes. Precursor gas of hexamethyldisiloxane (HMDSO, Si(CH3)3-O-Si (CH3)3) maintained at 25 C was carried by Ar
by bubbling, together with another two separate lines for Ar and O2, to a 40 m*40 mm*2 mm reaction chamber. All flow
rates were monitored using mass flow controllers. A 150-μ m-thick polyester (PET) film with moderately high Young s modulus (71.7 Gpa) was used as the substrate. By controlling gas proportion and power density applied, variously patterned wrinkles were prepared after 2 minutes. However, detailed and exact conditions to obtain a specific pattern were still un-der research.
2.2 Diffraction pattern observing
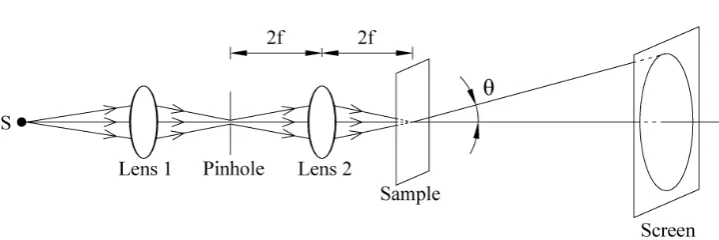
Schematic illustration for optical system to observe the transmission pattern is showed in Fig. 1. The light source came from a xenon lamp, with output wavelength ranging from 200 to 2000 nm. Firstly it was focused by the convex lens (lens 1) to a pinhole with a radius of 50 μm, and then again by the camera lens (lens 2). Distances from pinhole to lens 2 and from lens 2 to the plane of sample were set as dou-bled focal length to make sure the spot projected on the sam-ple keeps the size as pinhole. Transmittance patterns were observed on the white screen. A monochromatic light source with the wavelength of 632.8 nm was also applied to this sys-tem. Inasmuch as red laser light was much easier to focus, pinhole and camera lens were omitted and size of the spot il-luminated on samples was assured to keep the same radius as
*
white light.
2.3 Surface morphology characterization
After observing the specific diffraction patterns of wrin-kles, the exact locations were marked by slightly scratches from the backside of the substrate to be prepared for the anal-ysis of surface texture. Topography of the deposited films was then observed by an optical microscope. Periodic distances in wrinkles (lattice constant d) were measured from the micro-scope images for 50 times and then averaged. FFT from mi-croscope images and iFFT were carried out by Matlab.
3. Results and Discussion
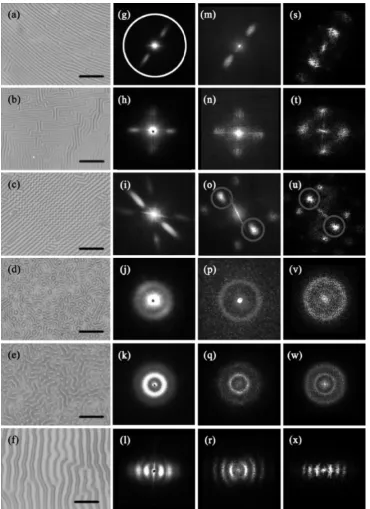
Surface morphology was observed by optical microscope and typical patterns of wrinkles are shown in Fig. 2 (a) to (f). Buckling with periodic distance within several micrometers and different orientations, as aligned structure, zigzag and isotropic ones, are chosen to be research objects. Obvious dispersion phenomenon in transmission patterns from white light, as in Fig. 2 (g) to (l), demonstrates the nature of wrinkle is the diffraction grating, the same as some previous works9,20).
For oriented lines in one and two directions, as Fig. 2 (a) and (b), two and four dots can be observed on the screen regard-less of the midst one, and for zigzags (Fig. 2 (c)), the diffrac-tion pattern is the array of six dots. Moreover, rings with dif-ferent numbers and diffraction angles (Fig. 2 (j) and (l)), to-gether with arcs (Fig. 2(l)), appeared when light was project-ed onto random wrinkles. Since diffraction pattern is the two-dimensional (2D) FT of the function of the aperture, FFT directly from microscope images are introduced to verify dif-fraction analyze in theory. The results, from Fig. 2(l) to (x), pictured here, are in good agreement with the diffraction pat-terns, which helps us to make sure the microscope images match well with diffraction patterns even though those two observations were carried out separately. Both transmission and FFT patterns reveal strong dependence on original micro-scope images.
For aligned wrinkles, simplest gratings, the evenly-spac-ing-dots along the direction perpendicular to wrinkle s orien-tation (Fig. 2(g) and (m)) are discovered. And the narrower the wrinkle (smaller d) is, the bigger the diffraction angle and the farther the dots to the center portion will be in diffraction pattern with the same wavelength incident light. Similarly, the wider the wrinkle is, the nearer the dots will be according to eq. (1).
d sinθ=mλ (1)
Average periodic distance in Fig. 2(a) is 2.221 μm and hence angle is 16.6 for the first-order diffraction with 632.8 nm red light illuminating. From Fig. 2(m), diffraction angle is around 16 , approximately the same as the calculat-ing result. And the correspondcalculat-ing FFT results directly from microscope images in the right side are scaled by kx here and it will have maximum while kx = 2π/d. For example, wave-length d in Fig. 2(a) is 2.22 μm and thus in FFT the first har-monic appears when kx = 0.9π um−1, as shown in Fig. 2(s). This also works for all following sample. And when it is as-sumed that wavelength of incident light is 632.8 nm as exper-imental laser, FFT can be deduced easily with rough agree-ment to diffraction patterns however which is ignored here.
And Fig. 2(b) shows the combination of wrinkles in both horizontal and vertical directions. Diffraction pattern be-comes four dots (Fig. 2(h) and (n)). The wider horizontal ar-ranged two dots are from the slightly narrower vertical wrin-kles (1.847 μm) while vertical laid dots are from horizontal slits (2.136 μm). Similarly, from eq. (1), we can get the dif-fraction angle θ as 20.0 and 17.2 individually. And white dots in FFT from microscope images are located at π um−1
and 0.9 π um−1.
From the lesson of Fig. 2(b), we come to realize that dif-fraction pattern of multi slits with different orientations should be the superposition of the dots from all directions. Here for zigzag pattern shown in Fig. 2(c), we can simply divide them into two individual groups of short wrinkles (lines) with different orientations. Thus it becomes easier to envision the diffraction pattern, which should be combination of the dots along the directions perpendicular to both parts of the zigzag s orientation. However, from the experimental re-sults, another two dots with strong intensity appeared, as the blue circled dots in Fig. 2(i) and (o). Therefore, we calculate the two-dimensional Fourier transform of the zigzag function by a simple model to analyze its diffraction pattern in detail.
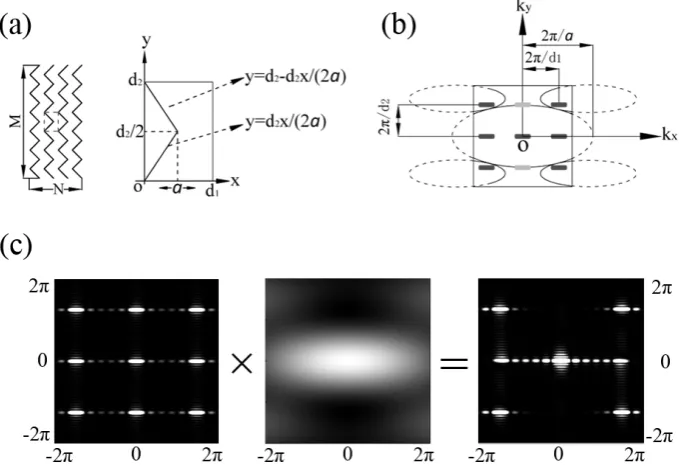
Simple zigzag model is as Fig. 3(a) and we let the aperture consist of a grating, that is, number N along the x direction and M along y of the parallel units of length d1 and of width
d2. Height of the zigzag a can be changed from 0 to d1 in the
x-axis while the inclining angle of each part in the zigzag keeps equal, β1 = β2, by fixing d2/2 in the y-axis, according to
the optical microscope image in Fig. 2 (c). The function of the grating can be defined as y1 = d2 − d2x/(2a) and y2 = d2x/
(2a) individually.
Fig. 1 Optical system for observing Fraunhofer diffraction pattern with white light. Light from a xenon lamp is focused into a pinhole through Lens1, and then illuminates the sample after further focused by a camera lens (lens 2). Diffraction pattern is observed on a white screen. Angle θ between optical axis and the line drawn from the spot center to a certain point in the screen plane is the diffraction angle.
[image:2.595.117.477.58.178.2]By integration, the results of the diffraction intensity, as following eqs. (2) to (4), are the production of interference factor IInt. and diffraction factor IDif., as well known.
I=IInt.IDif. (2)
IInt.∝
sin(kxd1N/2) sin(kxd1/2)
sin(kyd2M/2) sin(kyd2/2)
2
(3)
IDif.∝
sin
kxa+kyd22
2 kx+kyd22a
2
+cos(kyd2/2)
sinkxa−kyd22
2 kx−kyd22a
2 2
+[sin(kyd2/2)]2 sin
kxa−kyd22
2 kx−kyd22a
2
2 (4)
Typical pattern for interference intensity IInt. is the array of
[image:3.595.114.485.68.578.2]are not observed in experiment because of the weaker intensi-ty. Pattern for diffraction part IDif. is similar to ellipse as the
middle one in Fig. 3 (c) and its product with IInt. turns to be
finally result. Detailed and clear results are revealed in Fig. 3 (b), the rough contour from calculations, and from eq. (3) we can get the conclusion that distances between strongest inter-ference dots are affected by lattice constant d, here deter-mined by the 2π/d1 and 2π/d2 for x-axis and y-axis
individu-ally. And for diffraction apart, when we put kx = 0, ky = 0 separately and we can get the solution for IDif. = 0, kx = 2π/a and ky = 2π/d2 accordingly. In this case, a ≤ d1 < d2, it means
2π/d1 ≤ 2π/a. So that s why the two dots in blue circles in
Fig. 2 (i) & (o) appear here. And based on eq. (1), those two dots should lie at the diffraction angle of approximately 27.7 . Other four shinning dots on the diagonal are at the angle of 36.3 .
Since the Fourier transform preserves rotation, if the input pattern is rotated, the diffraction pattern is rotated as the same the angle but the remaining otherwise keeps unchanged. Then just rotating the simple zigzag model (Fig. 3(a)) and the result (Fig. 3(c)) 30 in the clockwise direction, it fits well with the experimental patterns, as showed in Fig. 2(i) and 2(o).
In above samples, oriented lines, explicitly or implicitly, are taken into discussion. However, in this section we will analyze the most common random wrinkles without any par-ticular orientations, as shown in Fig. 2 (d) and (e), for which transmission patterns tend to be one-ring or two-ring. It might be difficult to envision its diffraction pattern since we are easy to be disturbed by such irregular and isotropic domains. But fine and subtle features can be extracted by further observa-tion and explanaobserva-tion. Figure 4 is the contour line from isotro-pic wrinkles and several red arrows are drawn here since by elaborative observations several oriented buckling can be dis-covered in local range. In this sense diffraction pattern should be the dots lie in the direction perpendicular to the grating, as the red arrows, which would appear in several different
orien-tations. Hence from all wrinkles, diffraction dots could ap-pear from 0 to 360 . In addition spacing in frequency domain is always inversely proportional to the distance between adja-cent crests. So if the periodic distance remains consistent, the diffraction dots would appear in all the directions with the same spacing. Then rings will appear which can be proved by Fig. 2(d) and its diffraction pattern as Fig. 2(j), (p) and (v).
Quantitative analysis for random and isotropic wrinkles can draw lessons from above samples by decomposing them into local-scoped aligned lines as aforementioned. For sim-plifying the calculation, another hypothesis should be stated here. Distance between adjacent wrinkles from all directions is homogenous and always keeps a value. Then from eq. (1), location of the peak value of diffraction intensity could be easily derived. However, obvious difference appears in the results of both calculations and experiments for two similar microscope images, as shown in Fig. 2 (d), (e), (p) and (q). Meanwhile, d (distance between adjacent wrinkles) and the location of peak value kx in FFT results did not match the
Fig. 3 Simple Model for Zigzag and the results from the calculation. For (c), each parameter is from the real sample Fig. 2(c), d1 = 1.361, d2 = 1.175d1, a = 0.387d1, N = 6, M = 20.
Fig. 4 Explanation for diffraction pattern from irregular orientation wrin-kle. Black lines are the actual contour from part of Fig. 2(d). Red arrows show the possible directions for diffraction.
[image:4.595.128.468.72.305.2] [image:4.595.336.518.355.497.2]general rule kx = 2π/d during the calculations.
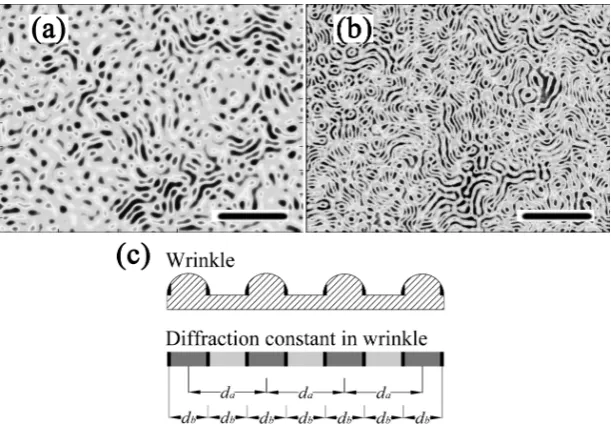
For getting an idea of the reason of two-ring and one-ring, part of the FFT spectrum was zeroed and then iFFT was car-ried out for the each ring in two-ring case. Figure 5 exhibits the detailed results while (a) and (b) are the iFFT results from the inner and outer halo in Fig. 5 (w) individually, from which we get the conclusion that the wrinkle might be composed of three parts with different transmittance, other than simply transparent and opaque ones, shown in Fig. 5 (c). In this case, two lattice constants can be obtained and then two rings ap-pear. The inner ring in Fig. 2(w) located at πμm−1 should be
the superstition of points from isotropic grain with a larger wavelength (1.865 μm) from 0–360 directions. And the outer ring at 2.3πμm−1 should be the combination of dots from
edges of the buckling (0.863 μm). Thus two-ring appears here because FFT is totally liner and the filtered image could be the superposition of all subsections. Same reasoning will go for Fig. 2 (d). However, only a bigger halo from edges of wrinkles can be observed here since it is not easy to extract the obvious difference of the wrinkle and flat parts.
Finally, last example in Fig. 2 would be explained quickly. Pattern in Fig. 2 (f) depicts a diffraction grating with a much wider d than any other examples and hence more oscillations could be observed, according to eq. (1). Here d owns a value of 5.293 μm and first diffraction angle locates at 6 when a red light was projected, and the second and third order angle at about 12 and 18 individually, as Fig. 2 (r). Another dis-tinct feature of this sample should be the arcs in both diffrac-tion pattern and calculated results which attributes to the winding grating instead of totally straight ones as in Fig. 2 (a), or isotropic ones in Fig. 2(d) and (e).
4. Conclusions
In this study various diffraction pattern are observed and detailed transform mechanism is discussed. For simply ori-ented wrinkles and isotropic ones, d = 2π/k or d = mλ/sinθ
can work well. But the periodic distance d is of paramount importance here and it is easy to make a faulty judgment with insufficient analysis. Meanwhile, how to expect wrinkle pat-tern from diffraction patpat-tern is fully explained here, which may be helpful to in situ observe wrinkles formation and evo-lution.
Acknowledgments
This work is supported by the Innovation Funding Program for Ph.D in Donghua University (CUSF-DH-D-2014010).
REFERENCES
1) M. Kucken: Forensic Sci. Int. 171 (2007) 85–96. 2) R.L.A. Kourounioti, et al.: J. R. Soc. Interface 10 (2013).
3) D.B.H. Chua, H.T. Ng and S.F.Y. Li: Appl. Phys. Lett. 76 (2000) 721– 723.
4) E.P. Chan and A.J. Crosby: Soft Matter 2 (2006) 324–328. 5) Y. Rahmawan, et al.: Langmuir 26 (2010) 484–491. 6) J.B. Kim, et al.: Nat. Photonics 6 (2012) 327–332.
7) C.H. Lu, H. Mohwald and A. Fery: Soft Matter 3 (2007) 1530–1536. 8) P. Uttayarat, et al.: J. Biomed. Mater. Res. A 75A (2005) 668–680. 9) C.J. Yu, et al.: Appl. Phys. Lett. 96 (2010).
10) C.M. Stafford, et al.: Nat. Mater. 3 (2004) 545–550.
11) J.Y. Chung, A.J. Nolte and C.M. Stafford: Adv. Mater. 23 (2011) 349– 368.
12) P.J. Yoo and H.H. Lee: Langmuir 24 (2008) 6897–6902.
13) Yague, J.L., et al.: Design of Ordered Wrinkled Patterns with
Dynami-cally Tuned Properties, Nineteenth European Conference on Chemical Vapor Deposition (Eurocvd 19), (2013). 46: pp. 40–45.
14) M. Guvendiren, S. Yang and J.A. Burdick: Adv. Funct. Mater. 19 (2009) 3038–3045.
15) G.G. Lendaris and G.L. Stanley: Proceedings of the Institute of Electri-cal and Electronics Engineers 58 (1970) 198.
16) M.D. Casper, et al.: Soft Matter 9 (2013) 7797–7803.
17) C.M. Chen, J.C. Reed and S. Yang: Soft Matter 9 (2013) 11007–11013. 18) S.J. Kwon, J.H. Park and J.G. Park: Phys. Rev. E Stat. Nonlin. Soft
Matter Phys. 71 (2005).
19) A.J. Nolte, R.E. Cohen and M.F. Rubner: Macromolecules 39 (2006) 4841–4847.
20) C. Harrison, et al.: Appl. Phys. Lett. 85 (2004) 4016–4018.
Fig. 5 Inverse FFT of different order of rings in Fig. 2 (w). (a) iFFT from the inner ring, (b) iFFT from the outer ring. Scale bar is 10 μm. (c) Lattice constant
[image:5.595.145.451.69.281.2]