Magnetostrictive Fe
Ga Wires for Application
in the High-Temperature Waveguide Device
Jiheng Li
+, Mingming Li
+, Xing Mu, Xiaoqian Bao and Xuexu Gao
State Key Laboratory for Advanced Metals and Materials, University of Science and Technology Beijing, Beijing 100083, PR China
(Fe83Ga17)99.4B0.6wires with 0.5 mm diameter were prepared by hot forging, rolling and combining hot and cold drawing. Strong©110ª
fiber texture was obtained in the as-drawn and annealed wires by alternating current with short time. Compared with the fracture elongation of about 0.1%in the as-drawn wire, the property increased to 16.1%in the annealed wire. The Young’s modulus of annealed wire was up to 174.3 GPa. In the annealed wires, the maximum twist angle of 206AA/cm and magnetostriction¦of¹48 ppm was achieved respectively. The obvious voltage signals of the torsional wave could be detected up to 400°C in the annealed wire, which was attributed to the high Curie temperature and highly thermal-stable magnetic properties of the FeGa alloy. The linear downward trend of the velocity of the torsional wave was observed from room temperature to around 250°C. The results indicate that (Fe83Ga17)99.4B0.6wire is suitable for the high-temperature waveguide device. [doi:10.2320/matertrans.M2017381]
(Received December 5, 2017; Accepted January 15, 2018; Published February 16, 2018)
Keywords: magnetostriction, FeGa alloy, Wiedemann effect, magnetostrictive displacement sensor
1. Introduction
Wiedemann effect is the phenomenon of twisting of a rod or wire due to the magnetostriction when the longitudinal and circumferential magnetic fields are applied simultaneously.1) Wiedemann effect as a kind of magneto-mechanical effect can be regarded as a special case of magnetostriction and has provided a basis for various transducers and for use in the design of devices, such as the magnetostrictive displacement sensors.2,3)Magnetostrictive displacement sensor, which is a
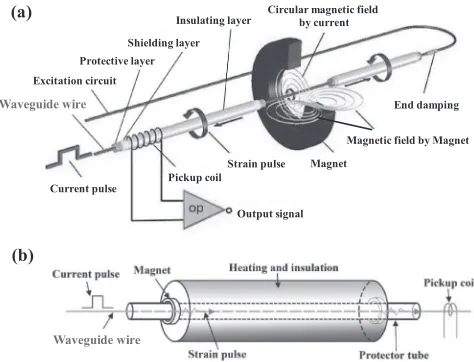
kind of important industrial sensor, has been widely used for the liquid level measurement, such as the oil and liquid chemical raw material depot, due to the advantages of non-contact, high sensitivity, good linearity, anti-jamming, multi-parameter measurement and good harsh environmental adaptability.46)Figure 1(a) shows the schematic diagram of the operational principle of the magnetostrictive displacement sensor. As is seen, the waveguide wire is the core component. Nowadays, FeNi wires have been widely used as waveguide wire in the magnetostrictive displacement sensors due to their magnetostriction and constant elasticity. However, the low magnetostriction value of about 25 ppm and low Curie temperature of just about 134°C7) significantly affect the
signal intensity and service temperature of sensors.
Borodin et al.8) have investigated the Wiedemann effect
of the ferromagnetic rod by measuring the maximum deformation of the helical springs made of the materials including FeCoV, FeNi, and Ni with saturation magnetostriction s=70, 25, and ¹26 ppm respectively. They found the greatest twisting in a specimen of material which possesses the largest saturation magnetostriction. It is necessary to investigate the Wiedemann effect of other materials with larger magnetostriction, such as TbDyFe alloys which have magnetostriction on the order of 1000 ppm,9) and NiMnGa ferromagnetic shape memory
alloys.10) However, the intrinsic brittleness of TbDyFe
and NiMnGa alloys make them impossible to be used as wires. Since 2000, FeGa alloys (named as Gafenol), have attracted great attention due to the combination of large magnetostriction at the low magnetic field, high Curie temperature and high mechanical strength, which are promising for applications in sensors, actuators and transducers.1114) However, the binary FeGa alloys cannot
be processed into long wires continuously for their brittleness of grain boundaries. Subsequently, the substitutional ele-ments of V, Al, Cr, Mo, and Nb have been proven to improve the ductility of polycrystalline binary FeGa alloys due to the change of fracture mode from intergranular to transgranular.1517) In our previous works, (Fe83Ga17)98Cr2
and Fe82Ga13.5Al4.5long wires were prepared by hot-working
processes, including hot forging, hot rolling or rotary swaging, warm and cold drawing. Unfortunately, in almost all cases, the substitutional elements have decreased the magnetostriction values from the binary FeGa alloy. It was
Current pulse
Output signal Pickup coil
Strain pulse Magnet
Magnetic field by Magnet Circular magnetic field
by current
End damping
Waveguide wire
Excitation circuit Protective layer
Shielding layer Insulating layer
(a)
(b)
Waveguide wire
Fig. 1 Schematic diagrams of (a) the magnetostrictive displacement sensor and (b) the measuring equipment for velocity of torsional wave with rising temperature.
+Corresponding authors, E-mail: lijh@ustb.edu.cn; limingming_0631@ 163.com
[image:1.595.308.545.325.506.2]owing to the long-range ordered DO3 structure which was
stabilized by the substitutional elements. However, many studies also have found that small addition of the interstitial element of B is one of the effective ways to improve both the mechanical and magnetostrictive properties of FeGa alloys.1820)Furthermore, the B-alloyed FeGa alloy has been used to prepare the thin sheets by rolling.21,22)
In this work, (Fe83Ga17)99.4B0.6wires of 0.5 mm diameter
were prepared by hot forging, rolling and combining hot and cold drawing. Strong©110ªfiber texture was obtained in the as-drawn and annealed wires. The Young’s modulus of the annealed wire was up to 174.3 GPa. The maximum twist angle of 206AA/cm was achieved. In the annealed wire, the obvious voltage signal of the torsional wave was detected up to 400°C. This work gives the possibility to improve the working temperature of the magnetostrictive displacement sensors.
2. Experimental
The as-cast (Fe83Ga17)99.4B0.6 alloy was prepared using
high pure Fe (99.9 mass%, purity), Ga (99.99 mass%, purity), and master alloy of FeB by induction melting under the protection of argon gas. The ingot was processed into wires of 3.5 mm diameter by hot forging, rolling, and drawing at 1150, 950 and 800°C, respectively, and then the diameter was further reduced to 0.5 mm by cold drawing. Subsequently, some as-drawn wires were annealed by 5A alternating current with short time.
Static tensile tests at a constant velocity of 1©10¹3s¹1 were employed at room temperature to investigate the mechanical properties of wires. Fracture morphologies of specimens were observed by scanning electron microscope (SEM). Electron backscatter diffraction (EBSD) patterns were captured and analyzed to obtain the inverse polefigure (IPF) map, IPF, and PF. The thermal analysis was performed on NETZSCH STA 449 C with a heating rate of 10°C/min. Magnetization hysteresis loops were measured by using a vibrating sample magnetometer (VSM). The magnetostriction was measured by using standard strain gauge techniques. The
Wiedemann twist was measured based on the principle of the optical lever. The schematic diagrams of the optical pathway and experimental setup for Wiedemann twisting measurement could be found in our previous work.7,23) An experimental setup, as shown schematically in Fig. 1(b), was used to detect the velocity of the torsional wave with rising temperature. A detail description of detection principle could be found in Ref. 7.
3. Results and Discussions
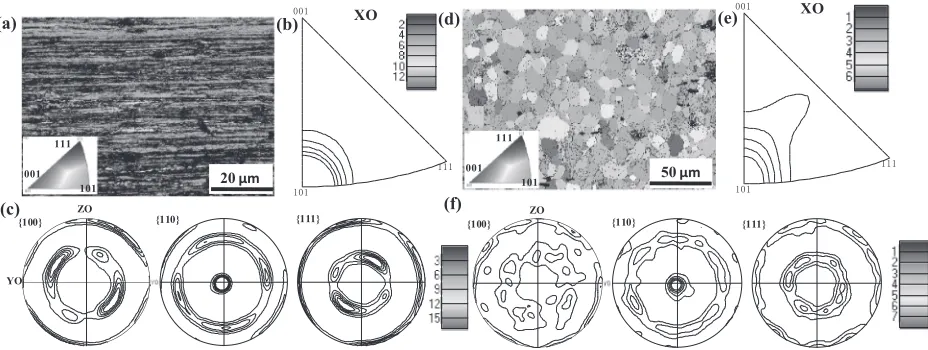
As well known, FeGa alloy exhibits a significant magnetostrictive anisotropy.24) The preferred orientation of
(Fe83Ga17)99.4B0.6 wires would significantly affect the
magnetostriction. Figure 2 shows the EBSD results which provide the detailed orientation information. Figure 2(a) shows the IPF map of the as-drawn wire along the drawing direction, and the corresponded IPF and PF is shown in Fig. 2(b) and (c), respectively. It can be seen that thefibrous structure with a strong©110ª texture parallel to the drawing direction is obtained after the cold drawing. During the deformation of metals, the change of grain orientation takes place as a consequence of shear on specific favorable oriented crystal planes and directions. In the case of body-centered cubic (BCC) iron alloys, slips mainly occur on {110}©111ª slip systems, and most grains rotate towards {110}©111ª orientation, then change to {112}©110ª along ¡-line (0°, 0°¼55°, 45°), which leads to a strong©110ªfiber texture. After the annealing by 5A alternating current with short time, the as-drawn wire is fully recrystallized, and the average grain size in the annealed wire is about 20 µm, as shown in Fig. 2(d). It is worth noting that the ©110ª fiber texture along the drawing direction is retained in the annealed wire, as shown in Fig. 3(e) and (f ). Based on the classical oriented-nucleation theory,25) for heavily deformed metals, the recrystallized grains have the same orientation as the sub-band, which serves as the point of origin of the nucleus in deformed grains. As a result, the deformation texture is retained after subsequently recovery and recrystallization by annealing.
50 μm
20 μm
XO XO
{100} ZO {110} {111}
YO
(a) (b)
(c)
(d) (e)
(f)
{100} {110} {111}
ZO 111
101 001
111
101 001
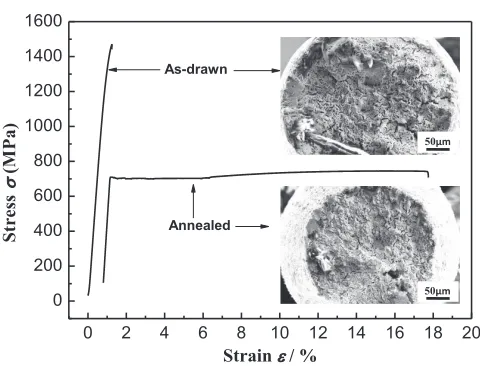
[image:2.595.67.531.71.246.2]In the magnetostrictive displacement sensor, magneto-strictive wires not only generate an elastic torsional wave but also act as the medium of wave propagation. Therefore, the mechanical properties of the wires, such as the tensile strength and the elastic modulus, also have an important influence on the performance of the sensor. Figure 3 shows the tensile stress-strain curves and the corresponded fracture morphology of the as-drawn and annealed (Fe83Ga17)99.4B0.6
wires. The fracture elongation is measured by an extensometer. Combined with the Table 1, it can be found that the tensile strength of as-drawn wire is as high as 1468 MPa, while the fracture elongation is very low, only 0.1%. After the annealing by 5A alternating current, the fracture elongation increases to 16.1%, meanwhile, the tensile strength of 744.7 MPa is obtained in the annealed wire. The fracture morphology shows that a large number of dimples appear on the fracture surface of the annealed wire and an obvious neck contraction is also observed. The small recrystallized grains and the elimination of internal stress, dislocations, and other structural defects lead to a significant increase of ductility. It is worth noting that Young’s modulus of the annealed (Fe83Ga17)99.4B0.6 wire is up to 174.3 GPa,
which higher than that of FeNi alloys. Some previous studies have indicated that Young’s modulus of the annealed FeNiCr(Ti) wires was below 160 GPa.26,27)Recently, Wang
[image:3.595.94.504.89.142.2]et al.28) have reported that the attenuation coefficient of the elastic torsional wave in FeGa wires was smaller than that in FeNi wires under the same test conditions. It may be attributed to the higher Young’s modulus of FeGa wires. In other words, FeGa wire is a potential candidate material for the large-scale magnetostrictive displacement sensor.
Figure 4 and 5 show the magnetic properties of the as-drawn and annealed (Fe83Ga17)99.4B0.6 wires. The magnetic
properties of waveguide wire play the key role in the magnetostrictive displacement sensors. From the Fig. 4(a), the magnetization loops indicate that compared with the as-drawn wire, the saturation magnetization of the annealed wire increases slightly. More importantly, the coercivity and residual magnetization decrease sharply after annealing, indicating the higher permeability and the lower hysteresis loss. It is associated with the recrystallized microstructure and the disappearing of a large number of defects and dislocations. Figure 4(b) gives the magnetostrictive curve of the annealed wire. As we’ve discussed before,23)the twist angle (dª) was
significantly affected by the tangential (circular) component
cof the magnetostriction, as shown in the top right corner inset of Fig. 4(b). So, the magnetostriction (¦) was measured when a magnetic field perpendicular to the wire axis direction was applied, as shown in the lower left inset of Fig. 4(b). As is seen, the magnetostriction¦of annealed (Fe83Ga17)99.4B0.6 wire is up to ¹48 ppm, which is nearly
twice that of FeNi wires. But, a high saturation magnetic field is also visible, which could be ascribed to the demagnetizingfield. Results of the Wiedemann twisting tests for the annealed (Fe83Ga17)99.4B0.6wire are shown in Fig. 5.
Effect of the axial magneticfieldHaon Wiedemann twisting is shown in Fig. 5(a). When the circumferential magnetic field Hc is kept constant, the twist angle increases to a maximum value sharply under smallHa, and then decreases sharply withHa increasing, indicating a reversal twisting at relative highHa. From Fig. 5(b), it is observed that keeping theHaconstant, the angle of twisting approximately linearly increases with increasing Hc. The maximum twist angle is 206AA/cm at 1350 A/m Ha and 1273 A/m Hc. However, with further increasing the Ha to 2025 A/m, the maximum twist angle slightly decreases. The characteristic accords remarkably well with results shown in earlier works.29) In
addition, it is worth to note that the twist angle could further increase with a higher Hc than 1300 A/m, as shown in Fig. 5(b). But, because the circumferential magneticfieldHc is generated by the direct current through the wire, the greater Joule heat induced by the larger direct current through the wire would deteriorate the Wiedemann effect. The theoretical analyses of the Wiedemann effect have been reported in several previous works.3032)Because the Wiedemann effect is regarded as a special case of magnetostriction, many efforts have been made to establish the relationship between the magnetostriction and Wiedemann effect. However, many studies have shown that magnetostriction is an important factor affecting the Wiedemann effect, but the relations between them is a complex, rather than a simple function.
0 2 4 6 8 10 12 14 16 18 20
0 200 400 600 800 1000 1200 1400 1600
Annealed As-drawn
Stress
(M
Pa)
Strain / %
50μm
50μm
Fig. 3 Stress-strain curves of as-drawn and annealed (Fe83Ga17)99.4B0.6 wires. The insets are the corresponding fracture morphology.
[image:3.595.49.289.184.367.2]In this work, the voltage signal generated by twist strain pulse was detected by the equipment schematically shown in Fig. 1(b). The annealed (Fe83Ga17)99.4B0.6 wire through the
center of the protector tube is straightened by a small spring. Two magnet rings for the providing of the axial magnetic field arefixed at both ends of the protector tube. As a current pulse is loaded on the (Fe83Ga17)99.4B0.6 wire, an instant
circular magnetic field is created around the wire. Together with the two axial magnetic fields at the position of the two magnetic rings, two twist strain pulses appear at the two positions due to the combined spiral magneticfields based on Wiedemann effect and propagate along the wire at a certain speed. The twist strain pulses are finally detected by the pickup coil and converted to a voltage signals by the oscilloscope linked with the pickup coil. The test conditions are set as Freq. (pulse frequency)=50.0 kHz, Prd. (pulse period)=20.0 µs. Figure 6 shows the detected signal voltage waveform. As shown in Fig. 6(a), it can be seen that there are 5 peaks of voltage signals, which in turn from left to right corresponds to the pulse current loopfield, the torsional wave
from the permanent magnetic ring near the detection coil, the echo signal of torsional wave at the fixed end, the torsional wave from the permanent magnetic ring and the echo signal of torsional wave at the far fixed end, respectively. Furthermore, the voltage signals of the torsional wave from magnetic rings at the near-end and far-end of the test coil are very strong, indicating the small signal attenuation after long-distance propagation. It is worth noting that when the test temperature is up to 400°C, the voltage signals of the torsional wave in (Fe83Ga17)99.4B0.6 wire are still strong,
as shown in Fig. 6(b). It is attributed to the high Curie temperature and the highly thermal-stable magnetization of the FeGa alloy.33)Generally, the service temperature of the magnetostrictive displacement sensors based FeNi wires is not higher than 125°C due to the low Curie temperature of FeNi alloy. This work gives the possibility to improve the working temperature of the magnetostrictive displacement sensors.
In addition to the magnetostriction and Wiedemann effect, the reason that FeNi wires have been widely used in
0 500 1000 1500 2000 2500 -50
-40 -30 -20 -10 0
M
agnetostriction (ppm
)
Magnetic field, H / Oe -8 -6 -4 -2 0 2 4 6 8
-200 -100 0 100 200
-0.15 -0.10 -0.05 0.00 0.05 0.10 0.15 -20
-10 0 10 20
M
agnetization (em
u
/g)
Magnetic field, H / kOe
As-drawn Annealed
H
(a) (b)
Condition Hc
(Oe) Ms
(emu/g) Mr
(emu/g) As-drawn 51.2 182.2 20.4 Annealed 10.2 186.4 5.1
λ
⊥
Fig. 4 (a) Magnetization hysteresis loops of the as-drawn and annealed (Fe83Ga17)99.4B0.6 wires and (b) magnetostrictive curve of the annealed wire. The insets in (a) illustrate the magnetic properties according to the loops and the enlarged magnetization loops at low magneticfields. The insets in (b) illustrate the effect of tangential magnetostriction (c) on twist and a photo of sample for
magnetostriction measurement.
0 1000 2000 3000 4000
-40 -20 0 20 40 60 80
Hc=382 Hc=573 Hc=764
0 200 400 600 800 1000 1200 1400
0 50 100 150 200
Ha=225 Ha=450 Ha=675 Ha=1350 Ha=2025
(a) (b)
Tw
is
t
θ
(
/c
m
)
Tw
is
t
θ
(
/c
m
)
Axial magnetic field, Ha/ A.m-1 Circumferential magnetic field, Hc/ A.m-1
A.m-1 A.m-1 A.m-1
A.m-1 A.m-1 A.m-1 A.m-1 A.m-1
[image:4.595.68.533.71.255.2] [image:4.595.86.510.334.506.2]magnetostrictive displacement sensors is due to their constant elasticity which leads to the constant velocity of the torsional wave in a certain temperature range. The experimental results of the velocity of the torsional wave with rising temperature in (Fe83Ga17)99.4B0.6wire are shown in Fig. 7. The velocity of
the torsional wave decreases gradually with increasing test temperature due to the temperature dependence of elastic modulus. In order to ensure the measurement accuracy at high temperatures, the velocity of a torsional wave of the waveguide wire should be set consistent with ambient temperature. It is worth to note that a linear downward trend is observed from room temperature to around 250°C, indicating the easily compensating and correcting. The results demonstrate that the service temperature of the magnetostrictive displacement sensors based FeGa wires could be up to 250°C, which is twice that of FeNi wires. The DSC curve illustrates an endothermic peak at around 700°C which corresponds to the transition from ferromagnetism to paramagnetism of A2 phase, as shown in the inset of Fig. 7. Such high Curie temperature also indicates that (Fe83Ga17)99.4B0.6 wire is suitable for the high-temperature
waveguide device.
4. Conclusions
(Fe83Ga17.5)99.4B0.6 wires with 0.5 mm diameter were
prepared by hot forging, rolling and combining hot and cold drawing. Strong ©110ª fiber texture was obtained in the as-drawn and annealed wires. Compared with the fracture elongation of about 0.1%in the as-drawn wire, the property increased to 16.1% in the annealed wire, and Young’s modulus of annealed wire was up to 174.3 GPa. In the annealed wires, the maximum twist angle of 206AA/cm and magnetostriction¦of¹48 ppm were achieved. The obvious voltage signals of the torsional wave could be detected up to 400°C in the annealed wire, which was attributed to the high Curie temperature and the highly thermal-stable magnetization of the FeGa alloy. The signal attenuation after long-distance propagation was small. The linear downward trend of the velocity of the torsional wave was observed in the temperature range from the room temperature to around 250°C. The results indicate that (Fe83Ga17)99.4B0.6 wire is
suitable for the large-scale and high-temperature waveguide device.
Acknowledgments
This study was financially supported by the National Natural Science Foundation of China (No. 51501006), State Key Laboratory for Advanced Metals and Materials (2017Z-11), Fundamental Research Funds for the Central Universities (FRF-GF-17-B2) and partly supported by a scholarship from the China Scholarship Council.
REFERENCES
1) G. Wiedemann: Lehre von der Elektrizität.3(1883) 680. 2) C.M. Van der Burgt: Philips Res. Rep.8(1953) 91. 3) J.A. Lewis:Quart. Appl. Math.20(1962) 13.
4) F.T. Calkins, A.B. Flatau and M.J. Dapino:J. Intell. Mater. Syst. Struct.
18(2007) 1057.
5) S. Fernando, M.M. José and R.J. Antonio: IEEE Trans. Instrum. Meas.
3(2009) 722.
6) H.F. Liu, Z.Y. Jia and F.J. Wang: Proc. IEEE Intern. Confer. Mech. Automation, 2011:1098.
7) M.M. Li, J.H. Li, X.Q. Bao, X. Mu and X.X. Gao:Mater. Des.135
(2017) 197.
Fig. 6 Detected pulse signal voltage of the annealed (Fe83Ga17)99.4B0.6 wire by an oscillograph at (a) room temperature (RT) and (b) 400°C. Freq. means the pulse frequency; Prd. means the pulse period.
0 50 100 150 200 250 300 350 400
2560 2580 2600 2620 2640 2660 2680 2700 2720
oC
Experimental data Linear fit
Propagation speed
v
(m
/s)
Temperature,T/
100 200 300 400 500 600 700 800
Endo.
Temperature,T / o
C
A2: ferro. parra.
[image:5.595.77.519.68.218.2] [image:5.595.52.287.275.459.2]8) V.I. Borodin, V.V. Ostanin and S.V. Zhakov: Phys. Met. Metallogr.56
(1983) 96.
9) G.P. McKnight and G.P. Carman:Mater. Trans.43(2002) 1008. 10) P. Lázpita, V.A. Chernenko, J.M. Barandiarán, J. Gutiérrez, H. Hosoda
and J.A. Rodríguez-Velamazán:Mater. Trans.54(2013) 1535. 11) A.E. Clark, J.B. Restorff, M. Wun-Fogle, T.A. Lograsso and D.L.
Schlagel: IEEE Trans. Magn.36(2000) 323.
12) S. Guruswamy, N. Srisukhumbowornchai, A.E. Clark, J. Restorffand M. Wun-Fogle:Scr. Mater.43(2000) 239.
13) A.E. Clark, K.B. Hathaway, M. Wun-Fogle, J.B. Restorff, T.A. Lograsso, V.M. Keppens, G. Petculescu and R.A. Taylor: J. Appl.
Phys.93(2003) 8621.
14) S. Hori, T. Okazaki, Y. Furuya, M. Simada, M. Yokoyama and M. Nakamura:Mater. Trans.53(2012) 963.
15) S.M. Na and A.B. Flatau:J. Appl. Phys.103(2008) 07D304. 16) J.H. Li, X.X. Gao, J. Zhu, J. Li and M.C. Zhang:J. Alloys Compd.484
(2009) 203.
17) A.E. Nolting and E. Summers:J. Mater. Sci.50(2015) 5136. 18) M. Huang, T.A. Lograsso, A.E. Clark, J.B. Restorffand M. Wun-Fogle:
J. Appl. Phys.103(2008) 07B314.
19) C. Bormio-Nunes, C.T. dos Santos, M.B. Dias, M. Doerr, S. Granovsky and M. Loewenhaupt:J. Alloys Compd.539(2012) 226.
20) C. Bormio-Nunes, C.T. dos Santos, I.F. Leandro, R.S. Turtelli, R.
Grossinger and M. Atif:J. Appl. Phys.109(2011) 07A934. 21) J.H. Li, X.X. Gao, J. Zhu, X.Q. Bao, T. Xia and M.C. Zhang:Scr.
Mater.63(2010) 246.
22) A.L. Sun, J.H. Liu and C.B. Jiang:J. Mater. Sci.49(2014) 4565. 23) Y.L. Zhao, J.H. Li, X.Q. Bao, X. Mu and X.X. Gao:Scr. Mater.141
(2017) 80.
24) H.D. Chopra and M. Wuttig:Nature521(2015) 340.
25) I.L. Dillamore, C.J.E. Smith and T.W. Watson:Met. Sci. J.1(1967) 49. 26) R. Shen, Y. Lu, Z.S. Feng, B.C. Yang and K. Cao: J. Fun. Mater.40
(2009) 918 (in Chinese).
27) T. Xia, X.X. Gao, J.H. Li and Y.F. Zhang: J. Mag. Mater. Devices39
(2008) 21 (in Chinese).
28) B.W. Wang, X.L. Xie, L.Y. Zhang, Y.F. Li and W.D. Zheng: Chin. J. Sci. Instru.38(2017) 813 (in Chinese).
29) J.H. Li, X.X. Gao, J. Zhu, X.Q. Bao, L. Cheng and J.X. Xie:Chin.
Phys. B21(2012) 087501.
30) M.E. Fromy:J. Phys. Radium7(1926) 13.
31) S.V. Zhakov, V.I. Borodin and V.V. Ostanin: Phys. Met. Metallogr.57
(1984) 36.
32) M. Yamamoto: Sci. Rep. Tohoku Univ.10(1958) 219.