Effect of Grain Boundary Segregation of Interstitial Elements
on Hall
Petch Coef
fi
cient in Steels
Setsuo Takaki
1,2,+, Daichi Akama
1,2, Nobuo Nakada
1,2and Toshihiro Tsuchiyama
1,21Department of Materials Science and Engineering, Kyushu University, Fukuoka 819-0395, Japan
2International Institute for Carbon Neutral Energy Research (WPI-I2CNER), Kyushu University, Fukuoka 819-0395, Japan
The yielding behavior of interstitial-free steels and low-carbon steels with varying amounts of C and N were investigated in connection with the HallPetch relation. The HallPetch coefficient is as small as 150 MPa·µm1/2in interstitial-free steels but it increases to 600 MPa·µm1/2 by adding solute carbon up to 60 ppm. Nitrogen does not have a significant effect on the HallPetch coefficient. The results of three-dimensional (3D) atom probe analysis indicated that carbon has 34 times greater segregation potential in comparison with nitrogen. The small effect of nitrogen on the HallPetch coefficient in steel is probably due to the small segregation potential of nitrogen. It was also confirmed that discontinuous yielding occurs when the difference between the yield stress and friction stress is increased by grain-refinement strengthening and that yielding occurs by dislocation emission from grain boundaries where primary dislocations have piled up. Carbon atoms segregated at grain boundaries seem to play a role in stabilizing dislocation emission sites at the grain boundaries, which enhances the HallPetch coefficient of iron. These results support the dislocation pile-up model of explaining yielding in polycrystalline metals. [doi:10.2320/matertrans.MA201314]
(Received August 21, 2013; Accepted September 26, 2013; Published November 9, 2013)
Keywords: grain refinement strengthening, HallPetch coefficient, interstitial elements, grain boundary segregation, dislocation pile-up, interstitial free steel, discontinuous yielding
1. Introduction
It is well known that the yield strength of polycrystalline metals,·y, increases in inverse proportion to the square root
of the grain size,d, and this relation is called the HallPetch relation (·y=·0+kyd¹1/2).1,2)In this equation, the constant, ·0, and the slope,ky, are referred to as the friction stress and
the HallPetch coefficient (HP coefficient), respectively. In
general, the HP coefficient increases with an increase in the
shear modulus of metals but the other effects have not been
clarified yet. In the case of steel, elements such as C and
N are contained interstitially and these elements have a
significant effect on yielding behavior. For example, a clear
yield point appears in mild steel containing a small amount of carbon and the yield point is reduced by removing carbon
and nitrogen using a wet hydrogen treatment.3) Therefore,
for a long time, a Cottrell locking mechanism has been accepted to explain the appearance of yield points in steels.
However, Tomimura et al. found that a yield point appears
even in an austenitic stainless steel with ultrafine grains less
than 1 µm.4) Recently, discontinuous yielding has been
reported in aluminum with an ultrafine-grained structure.5)
This suggests that the appearance of a yield point is a common phenomenon in polycrystalline metals strengthened by grain refinement.
The reduction of the yield point by purification, as
mentioned above, suggests that interstitial elements such as
C and N have some influence on the yielding behavior
of steel. In this paper, the effect of carbon and nitrogen was reviewed in terms of the yielding behavior of iron. The yielding mechanism of polycrystalline metals is also discussed in connection with the dislocation pile-up model
proposed by Hall and Petch.1,2)
2. Friction Stress and the HallPetch Relation in Interstitial Free (IF) Steels
Before discussing the influence of interstitial elements on
the yielding behavior of iron, the yielding behavior of pure
iron should be clarified. Figure 1 shows the change in yield
strength of single-crystal pure iron as a function of testing temperature. Since the iron used in this study was single crystal, the yield strength corresponds to the friction stress
in this figure. The measurements were taken in the tensile
direction between [100] and [110] at each testing
temper-ature.6) Therefore, in this figure, the crystal orientation
dependence of the yield strength is displayed by error bars. It was found that the crystal orientation dependence of the yield strength was minimal above room temperature and the yield
strength at 25°C was evaluated to be 5060 MPa. On the
other hand, the effect of (C+N) on the friction stress of iron
Temperature, T / °C
0 100 200
−100
Lower yield stress,
L
/ MPa
0 100 200 300 400
Strain rate: 4x10⁻³/s
25 °C
50~60MPa
σ
Fig. 1 Change in lower yield stress of single-crystal iron as a function of testing temperature. Each plot shows the average of specimens tensile deformed in the direction between [100] and [110].6)
+Corresponding author, E-mail: takaki@zaiko.kyushu-u.ac.jp
Special Issue on Strength of Fine Grained Materials®60 Years of HallPetch®
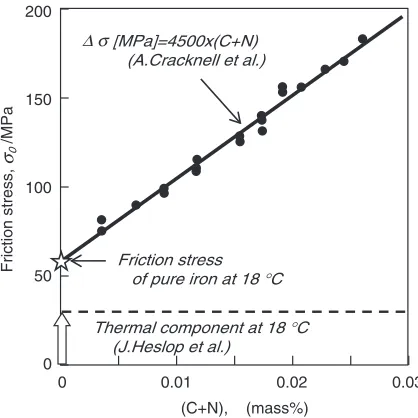
[image:1.595.320.534.358.520.2]at 18°C was investigated by Heslop7) and Cracknell8) and
their results are shown in Fig. 2. Friction stress of metals is composed of two components; thermal component which increases with lowering temperature and non-thermal com-ponent which is changeable depending on the amount of
solute alloying elements. In thisfigure, the value at 18°C is
represented for the thermal component. The friction stress in
this figure was determined by the respective HallPetch
relation. The friction stress is 60 MPa without C and N, which agrees well with the results shown in Fig. 1. The friction stress of iron is changeable depending on temperature and strain rate, but it can be concluded that the friction stress
of pure iron is 4060 MPa under conventional tensile testing
conditions, i.e., a temperature of 1030°C and a strain rate of 10¹410¹3/s.
As for the HallPetch relation in interstitial-free (IF) steel, a few experimental results have been reported and are
displayed in Fig. 3.9,10) A small difference is found in the
friction stress, but it is probably due to the solid-solution strengthening of excess Ti added to remove solute carbon and nitrogen as Ti(C,N), as well as the testing temperature and
strain rate. As a result, at room temperature, the following
HallPetch equation was obtained for IF steel:
·y½MPa ¼ ð5010Þ þ150d½m1=2 ð1Þ
The stressstrain curve of a specimen with a grain size of
30 µm is also displayed on the right side. The yielding of IF steel is characterized by continuous yielding. In the case of IF steel, the HP coefficient is as small as 150 MPa·µm1/2,
making it difficult to see the effect of grain-refinement
strengthening.
In terms of the effect of substitutional elements on the HP
coefficient, it is already known that chromium does not affect
it,11)that phosphorus decreases it slightly,12)and that nickel
increases it.9) It has not been clarified yet why nickel
increases the HP coefficient, but the addition of Ni is
effective for enhancing grain-refinement strengthening in
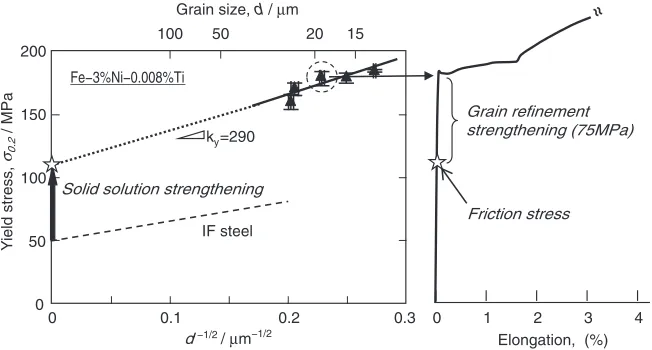
iron. For example, Fig. 4 shows the effect of 3%Ni addition
on the HP relation and the yielding behavior in IF steel. Nickel increases the friction stress of iron through
solid-solution strengthening and also enhances the HP coefficient.
It should be noted in the stressstrain curve that
discon-tinuous yielding appears and yield-point elongation occurs after yielding, even in IF steel. In comparison with Fig. 3, it was found that the difference between the yield stress
and friction stress is increased by the addition of 3%Ni.
This suggests that discontinuous yielding occurs when the difference between the yield stress and friction stress has
been increased by grain-refinement strengthening. This
confirms the claim that the presence of solute C or N is not
an essential condition for the occurrence of discontinuous yielding.
3. HallPetch Relation and Yielding Behavior in Steels Containing Interstitial Elements
In low-carbon steels represented by mild steel, many studies have been performed to discuss the HP relation. Figure 5 summarizes the data obtained in low-carbon
steels.1315) In 1966, Morrison13) systematically examined
HP relations in steels with various carbon concentrations
(0.0050.2%) and reported the identical HP coefficient of
600 MPa·µm1/2for every steel. This result indicates that there
0.03 0.02
0.01 0
(C+N), (mass%) 0
100 200
Thermal component at 18 °C (J.Heslop et al.)
[MPa]=4500x(C+N) (A.Cracknell et al.)
150
50 Friction stress of pure iron at 18 °C
Δ σ
Friction stress,
0
/MPa
σ
Fig. 2 Effect of solute (C+N) on friction stress of iron at 18°C.7,8)
Elongation, (%)
1 2 3 4
0
Grain refinement strengthening (28MPa)
Friction stress
0 20 40 60 80 100 120
0 0.1 0.2 0.3
d−1/2/μm−1/2 :this study :R.Matoba et al. :W.B.Morrison et al. Grain size, d /μm
25
100 11
IF steel (Fe−0.02%Ti)
ky=150
Y
ield strength,
0.2
/ MPa
σ
[image:2.595.64.273.347.556.2] [image:2.595.136.458.599.770.2]is no carbon-concentration dependence regarding
grain-refinement strengthening in steel, at least in the
carbon-concentration range above 0.005%. After that, the current
authors examined the HP relation in ultrafine-grained iron
with a grain size up to 0.2 µm and proposed the following equation for polycrystalline iron:1619)
·y¼100þ600d1=2 ð2Þ
In the grain size region up to 1 µm, much data were added as the result of national projects in Japan, and it was
recon-firmed that the above equation holds in 0.15%C steel up to
a grain size of 1 µm.14,15) As a result, it can be concluded
that the HP coefficient is approximately 600 MPa·µm1/2
in steels with more than 0.005% carbon. In Fig. 5, the HP
relation in IF iron is shown by a broken line in order to clarify the difference with low-carbon steels. This result
suggests some influence of a small amount of carbon on the
mechanism of grain-refinement strengthening.
On the other hand, Low et al. reported the effect of
purification on yielding behavior in mild steel and the results
are shown in Fig. 6.3)Purification was performed by a wet
hydrogen treatment at 725°C. As carbon and nitrogen are
removed from specimens as CO and NH3 by this treatment,
specimens are purified more with increasing holding time.
The yielding of the original material is characterized by discontinuous yielding, and the yield point is reduced by
the purification and finally disappears. Because the Cottrell
locking model provides a convenient explanation for this discontinuous yielding in steel, it has been accepted for a long time. However, the current authors recently found
that the HP coefficient is changeable in iron with less than
0.005%carbon.20)Figure 7 shows the effect of solute carbon
and nitrogen on the HP coefficient of iron. It was found that
the HP coefficient is large enough in iron with 41 ppm solute
carbon, but the coefficient decreases with decreasing amounts
of solute carbon. In contrast, nitrogen does not have a
significant influence on the HP coefficient. The difference
between carbon and nitrogen will be discussed later in relation to grain-boundary segregation behavior. For now, the behavior shown in Fig. 6 can be explained as shown in Fig. 8. Solute carbon enhances the friction stress slightly
but it has a greater effect on the HP coefficient. Thus, the
difference between yield stress and friction stress is increased by increasing amounts of solute carbon. In other words, the difference between yield stress and friction stress decreases
as a result of purification, which changes the yielding
behavior from discontinuous yielding to continuous yielding. Here, it should be noted that very small amounts of carbon 0.8 1.0
0.6 0.4 0.2 0
0 100 200 300 400 500 600 700
800 100 20 10 5 3 2 1
Grain size, d /μm
d−1/2/μm−1/2
ky=600
Matsukura et al. (1999)
Morrison (1966)
0.05C−1Si−1.5Mn−0.02Nb 0.05C−1Si−1.5Mn M. Etou et al. (2008)
0.09C 0.20C 0.005C
0.13C 0.05C0.15C 0.15C−0.74Mn
Low carbon steels (0.005 ~ 0.2%C)
IF steel
Y
ield strength,
y
/ MPa
σ
Fig. 5 HallPetch plots in low-carbon steels.1315)
Elongation, (%) 1
Grain refinement strengthening (75MPa)
Friction stress
0 2 3 4
100 50 20 15
Grain size, d / μm
0 0.1 0.2 0.3
d- −1/2/ μm−1/2 0
50 100 150 200
Y
ield stress,
0.2
/ MPa
ky=290
Fe−3%Ni−0.008%Ti
IF steel
Solid solution strengthening
σ
Fig. 4 HallPetch plot and stressstrain curve in IF3%Ni steel.
0.75h
1.5h
3h
0 10 20 30 40 50
300
0 100 200
Elongation, (%)
Fe−0.05%C
Holding time at 725 °C:5h
Nominal stress,
/ MPa
σ
[image:3.595.136.462.71.246.2] [image:3.595.318.534.288.447.2] [image:3.595.57.283.289.458.2]have a significant influence on yield strength by changing the
HP coefficient. Thus, in a discussion of the HP relation, the
true effect of substitutional elements cannot be evaluated under the coexistence with interstitial elements. In fact, completely different experimental results have been reported
for HP coefficients in FeCrC alloys21) and FePC
alloys,22) in contrast with our results in IF FeCr alloys11)
and IF FeP alloys.12)
4. Mechanism of Yielding in Polycrystalline Metals
The dislocation pile-up model is a reasonable model for explaining the yielding of polycrystalline metals, and some direct evidences showing dislocation emission from grain
boundaries has been reported.2325) In 1965, dislocation
emission from grain boundaries was found in optical
micrographs of an Fe3.65%Si alloy.23) In 304-type
auste-nitic stainless steel, dislocation emission from grain bounda-ries was dynamically observed with transmission electron
microscope (TEM).24) Recently, the current authors have
succeeded in observing dislocations emitted from a grain boundary to a neighboring grain in a high-nitrogen austenitic
steel.25) Figure 9 shows the TEM image of a specimen
with 0.2% tensile deformation. It was found that primary
dislocations pile up at grain boundaries and secondary dislocations are emitted from the area where primary
dislocations have piled up. It was also confirmed that such
Grain size, d / μm
100
0 200
0 0.1 0.2
d−1/2/ μm−1/2 d−1/2/ μm−1/2
100 30 20
(a) Fe−C
Solute carbon: 41ppmC
IF steel
17ppmC
150
50 250
0.3 100
0 200
0 0.1 0.2
100 30 20
(b) Fe−N
IF steel
Solute nitrogen: 48ppmN
20ppmN
0.3 250
150
50
Grain size, d / μm
Y
ield strength,
y
/ MPa
σ
Y
ield strength,
y
/ MPa
σ
Fig. 7 Effect of solute carbon (a) and nitrogen (b) on HallPetch coefficient. Specimens were water quenched from 700°C after holding for various lengths of time to control grain size.20)
Elongation, (%)
2 3 4
1 0 100
0 200
0 0.1 0.2
100 30 20
(a) Fe−C
Solute carbon: 41ppmC
IF steel
17ppmC 150
50 250
0.3 Grain size, d / μm
d−1/2/ μm−1/2
Y
ield strength,
y
/ MPa
σ
Fig. 8 HallPetch plots and stressstrain curves in IF iron and iron containing small amounts of solute carbon.
500nm G.B. Dislocations emitted from G.B.
Piled up dislocations
[image:4.595.109.488.70.232.2] [image:4.595.136.466.278.462.2] [image:4.595.312.542.503.694.2]microyielding takes place in each crystal grain and that the number of microyielded grains increases during macroscopic
yielding.23) The authors pointed out that macroscopic
yielding starts when the total amount of microyielded crystal
grains has reached 7080% in volume fraction.10)
According to dislocation pile-up models,1,2) the following
equation has already been proposed for explaining grain-refinement strengthening in shear stress"¸y:
¸y¼ ðGb¸=k³Þ1=2d1=2 ð3Þ
whereG,b,k,dand ¸*denote, respectively, shear modulus, the Burgers vector, a constant depending on the character of the dislocation, the grain size, and the critical grain boundary strength, which corresponds to the shear stress required for generating dislocations at grain boundaries. Grain boundaries
form barriers against dislocations generated from a Frank
Read source, whereas they work as dislocation sources
when the pile-up stress has exceeded ¸*. In bcc metals, the
following equation is constructed for the theoretical HP relation by including a Taylor factor of 2:
·y¼·0þ2ðGb¸=k³Þ1=2d1=2 ð4Þ
where·0is the friction stress. The HP coefficient,ky, is given
by ky=2(Gb¸*/k³)1/2 and, in steel, it has experimentally
been obtained as a function of solute carbon content, as
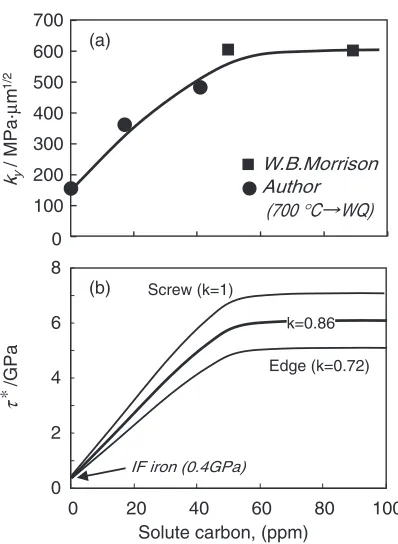
shown in Fig. 7. Figure 10 shows changes ofky and¸* that
were calculated from ky and eq. (4) as a function of solute
carbon content. In specimens water quenched from 700°C,ky
increased with increasing carbon content, and it became
constant at approximately 600 MPa·µm1/2 above 60 ppm
carbon. The value of¸*also increased with increasing carbon
content, corresponding to the change ofky. It should be noted
that¸*is as small as 0.4 GPa in IF steel, but it is significantly enhanced by adding small amounts of carbon. For instance,
¸* becomes about 6 GPa by adding 60 ppm carbon. The
carbon concentration at grain boundaries increases with increasing carbon content of steel. The above results suggest that dislocation emissions from grain boundaries become more prevalent when carbon has segregated at the grain boundaries. Thus, Wilson examined the effect of 90°C aging
on the value of kyin an Fe0.003%C alloy water quenched
from 700°C26) and Fig. 11 shows the results. In the
as-quenched specimen, ky is 310 MPa·µm1/2, and this is a
reasonable value in comparison with our results shown in Fig. 10. At 90°C, C atoms can move within a bcc Fe lattice
but it is difficult to form carbide precipitates. Here, it is
interesting thatkygradually increases with increased holding
time at 90°C, and it finally levels off at approximately
700 MPa·µm1/2. This result enables us to imagine that C
atoms segregated at grain boundaries during 90°C aging, which enhanced the stability of the dislocation emission site
at the grain boundaries. The value of¸*should be enhanced
by this stabilizing dislocation emission site at the grain
boundaries and lead to an increase of ky. In polycrystalline
iron, it is probable that yielding starts by dislocation emission at grain boundaries and that carbon has a significant influence
on the mechanism of grain-refinement strengthening.
5. Grain-Boundary Segregation of Carbon and Nitrogen
As mentioned above, carbon has the ability to increase the
HP coefficient but nitrogen does not. If the dislocation
pile-up model is acceptable as the mechanism of grain-refinement
strengthening, such a difference between carbon and nitrogen may occur depending on the grain-boundary segregation behavior of each element. Figure 12 displays the results of three-dimensional (3D) atom probe analysis showing the amount of C and N segregated at the grain boundaries in
FeC and FeN alloys.27) Each specimen was prepared to
have the same atomic fraction of C or N, 0.02 at%, and it was
confirmed that the amount of solute C and N was 0.0019 at%
in both specimens. However, apparent differences can be seen between carbon and nitrogen in terms of grain-boundary segregation behavior, in that carbon has an approximately 34 times greater segregation potential. In the FeN alloys, it should be noted that almost the same amount of C and N was detected at the grain boundaries, even though the bulk carbon content was only one-tenth that of the nitrogen content. This demonstrates that carbon has a greater potential
Fe−30ppmC
ky
/ MPa·
μ
m
1/2
600 700
500
400
300
200
100
0
101 102 103 104 105
Aging time at 90 °C, t/ min
IF steel
Slowly cooled from 700°C
[image:5.595.70.269.66.338.2]Water−quenched from 700 °C
Fig. 11 Effect of aging at 90°C on HallPetch coefficient, ky, of Fe 0.003%C alloy that was water quenched from 700°C.26)
0 20 40 60 80 100
Edge (k=0.72) Screw (k=1)
Solute carbon, (ppm) IF iron (0.4GPa)
0 2 4 6 8
k=0.86
(b) 100 200 300 400 500 600 700
ky
/ MPa·
μ
m
1/2
0 (a)
(700°C WQ)
Author W.B.Morrison
/GPa
τ
∗
[image:5.595.319.535.70.201.2]than nitrogen in terms of grain-boundary segregation. So far,
it is unknown whether nitrogen itself has a significant effect
on grain-refinement strengthening similar to carbon or not,
but it is clear that the effect of nitrogen on the HP coefficient of iron is difficult to determine owing to its small segregation potential.
If the HP relation is affected by the segregation of alloying elements, the grain-size dependence of the concentration at
the grain boundary, Xb, should be taken into consideration.
Xb will decrease with decreasing grain size,d, because the
grain boundary area per unit volume, Sb, increases with
decreasing grain size (Sb ;3=d). The results shown in
Fig. 12 do not give the value of Xb directly, but it can be
roughly evaluated as follows: The molar volume of bcc iron
is about 7.1 cm3/mol at room temperature, and therefore, the
number of Fe atoms per unit volume,NFe, is evaluated to be
85 atoms/nm3. The number of carbon atoms in the matrix is
calculated to be 0.016 atoms/nm3, which corresponds to a
solute carbon content of 41 ppm. The atomic density around grain boundaries must be smaller than that in the matrix but its actual value is unknown. Therefore, the current authors evaluated it by grain-boundary simulation using steel balls
and obtained a value of approximately 90% as the relative
atomic density at a grain boundary layer 1 nm thick. Thus, the number of Fe atoms around the grain boundary is estimated
to be 76 atoms/nm3. Since the number of excess C atoms at
the grain boundary was 7.6 atoms/nm2in the FeC specimen,
Xb can be evaluated as 0.10 [=(7.6+0.016)/76] by
presuming that C atoms are replaced with Fe atoms at the grain boundary and that C atoms are distributed uniformly within the 1-nm-thick grain boundary layer. On the other
hand, the volume fraction of the grain boundary,Vb, is given
by Vb=t·(3/d) under the conditiond ºt, where tdenotes
the thickness of the grain boundary layer. From a viewpoint of mass balance, the following equation should be realized betweenXb, the concentration in the matrix,Xm, and the mean
concentration, X0:
X0¼VbXbþ ð1VbÞ Xm ð5Þ
Here, the segregation coefficient, K(=Xb/Xm), is unknown
but the enrichment factor, ¡ (=Xb/X0), is given as 522
(=0.10/0.00019) for the FeC specimen. The value of
K must be slightly larger than that of ¡, so K=530 was
applied for calculating the relation between d and Xb. The
results obtained from eq. (5) are shown in Fig. 13. The grain
size dependence of Xb becomes significant below 20 µm
but it is small above 20 µm. This means that the carbon concentration at the grain boundaries is almost the same as far as grain size of specimens has been controlled to be larger than 20 µm. In our study, the HP relation was examined in the grain size region above 10 µm, as shown in Fig. 7.
It is concluded that the HP coefficient was reasonably
evaluated under the same conditions as the carbon concen-tration at the grain boundaries. It is understood that the results displayed in Fig. 13 are changeable depending on the carbon content of steels, but it is true that the carbon concentration
at grain boundaries is markedly reduced by grain refinement
to a sub-micron level. Regarding the discussion of the HP
relation in metals, especially in ultrafine-grained metals, we
should pay attention to the segregation behavior of alloying elements and impurities, which is changeable depending on grain size.
6. Conclusions
In this review, the yielding behavior of interstitial-free (IF) steel and low-carbon steels containing different C and N
amounts were discussed in connection with the HallPetch
relation and the following conclusions were obtained:
(1) The friction stress of pure iron is 50«10 MPa at room
temperature at a strain rate of 10¹410¹3/s, which is usually applied to tensile testing.
(2) The HallPetch coefficient in IF steel is as small as
150 MPa·µm1/2, but the value increases with increasing
amounts of solute carbon. It reaches 600 MPa·µm1/2 by
adding 60 ppm carbon but tends to level off at this value in the carbon concentration range above 60 ppm. The change of
yield strength by purification in low-carbon steel was
reasonably explained by the carbon-concentration depend-ence of the HallPetch coefficient.
Solute N: 0.0191 at% Solute C: 0.0191 at%
0 2 4 6 8 10
(a) Fe−56ppmC−11ppmN (Grain size: 20μm)
Δ
N, (atoms/nm
)
2
(b) Fe−5ppmC−54ppmN (Grain size: 20μm)
: C
: N 7.6
2.1
[image:6.595.55.285.68.271.2]1.5
Fig. 12 Results of 3D atom probe analysis showing the difference between carbon and nitrogen on grain boundary segregation.27)¦Ndenotes the number of excess atoms per unit grain boundary area. Specimens were held at 700°C for 90 s and then quenched in water.
Atomic fraction of C at grain boundary; Xb
Grain size, d /μm Xb
Segregation coefficient; K=530 (=Xb / Xm)
20μm
0 0.02 0.04 0.06 0.08 0.10 0.12
[image:6.595.317.533.73.211.2]0 10 20 30 40 50 60 70 80 90 100
(3) Discontinuous yielding is a common phenomenon that appears in polycrystalline metals when the difference between yield stress and friction stress has been increased
by grain-refinement strengthening. It is probable that the
yielding of polycrystalline iron is caused by dislocation emissions from grain boundaries where primary dislocations have piled up and segregated carbon atoms have stabilized the dislocation source at the grain boundaries. These results support a dislocation pile-up model to explain yielding in polycrystalline metals.
(4) In polycrystalline iron, carbon enhances the HallPetch
coefficient significantly but nitrogen does not.
Three-dimen-sional atom probe analysis showed significant grain boundary
segregation of carbon but little segregation of nitrogen in specimen that were water quenched from 700°C. It seems
that carbon has 34 times larger segregation potential in
comparison with nitrogen. The small effect of nitrogen on the
HallPetch coefficient in iron is probably due to the small
segregation potential of nitrogen.
Acknowledgment
This work was supported by Grant-in-Aid for Scientific
Research B Number 23360310.
REFERENCES
1) E. O. Hall: Proc. Phys. Soc. B64(1951) 747753. 2) N. J. Petch: J. Iron Steel Inst.174(1953) 2528.
3) J. R. Low and M. Gensamer: Trans. AIME158(1944) 207249.
4) K. Tomimura, K. Nagamori, S. Takaki and Y. Tokunaga: J. Jpn. Inst. Metals55(1991) 376382.
5) N. Kamikawa, X. Huang, N. Tsuji and N. Hansen:Acta Mater. 57
(2009) 41984208.
6) T. Takeuchi:Jpn. J. Appl. Phys.8(1969) 320328.
7) J. Heslop and N. J. Petch:Philos. Mag.1(1956) 866873.
8) A. Cracknell and N. J. Petch:Acta Metall.3(1955) 186189.
9) W. B. Morrison and W. C. Leslie:Metall. Trans.4(1973) 379381.
10) R. Matoba, N. Nakada, Y. Futamura, T. Tsuchiyama and S. Takaki:
Tetsu-to-Hagané93(2007) 513517.
11) A. Hironaka, N. Nakada, T. Tsuchiyama and S. Takaki:Mater. Sci. Forum706709(2012) 21302133.
12) N. Nakada, M. Fujihara, T. Tsuchiyama and S. Takaki: ISIJ Int.51
(2011) 11691173.
13) W. B. Morrison: Trans. Am. Soc. Met.59(1966) 824846. 14) M. Matsukura and S. Nanba: CAMP-ISIJ12(1999) 373.
15) M. Etou, S. Fukushima, T. Sakai, Y. Haraguchi, K. Miyata, M. Wakita, T. Tomida, N. Imai, M. Yoshida and Y. Okada:ISIJ Int.48(2008) 11421147.
16) Y. Kimura and S. Takaki: Proc. 1988 PM World Congress, Nano-crystalline Materials, (1998) pp. 573578.
17) S. Takaki and Y. Kimura: J. JSPPM46(1999) 12351240. 18) Y. Kimura and S. Takaki: J. JSTP41(2000) 1317. 19) S. Takaki: Netsushori40(2000) 292298.
20) K. Takeda, N. Nakada, T. Tsuchiyama and S. Takaki: ISIJ Int. 48
(2008) 11221125.
21) Y. Funakawa and T. Ujiro:Tetsu-to-Hagané96(2010) 162171.
22) W. A. Spitizig:Metall. Trans.3(1972) 11831188.
23) W. E. Carrington and D. McLean:Acta Metall13(1965) 493499.
24) Z. Shen, R. H. Wagoner and W. A. T. Clark:Acta Metall.36(1988) 32313242.
25) T. Tsuchiyama, Y. Fujii, Y. Terazawa, T. Ando and S. Takaki:ISIJ Int.
48(2008) 861867.
26) D. V. Wilson: Met. Sci. J.1(1967) 4047.