Solidi
fi
cation Microstructures and Quench
/
Temper Hardness
of Tantalum Added High-Carbon High-Speed Steel Type Cast Alloy
+1Ichihito Narita
1,+2, Souichi Sakamoto
1,+3, Hirofumi Miyahara
1,+2,
Kaoru Yamamoto
2, Kazunori Kamimiyada
3and Keisaku Ogi
41Department of Materials Science and Engineering, Kyushu University, Fukuoka 819-0395, Japan
2Department of Materials Science and Engineering, Kurume National College of Technology, Kurume 830-8555, Japan 3Nippon Steel & Sumikin Rolls Corporation, Kitakyushu 804-0002, Japan
4Oita National College of Technology, Oita 870-0152, Japan
The influence of Ta addition on the solidification microstructure, solute distribution and hardness after quenching and tempering treatments was investigated for a high-carbon high-speed steel type cast alloy (Fe1.9%C0.5%Mn4.9%Cr5.0%Mo5.07.2%V0.41.4%Ta). The compositions of V and Ta were systematically changed to improve the distribution of hard MC carbides in the hypoeutectic range. Electron probe micro-analysis (EPMA) and X-ray diffraction (XRD) identified an oval microstructure as MC carbides containing mainly V and Ta, and a lamellar structure as M2C carbides containing mainly Fe and Mo among the austenite (£) dendrites. Redistribution of alloying elements during
the solidification sequence of primary£,£+MC and M2C eutectic structure could be calculated from the Scheil-Gulliver equation and the initial
composition. The macro-hardness of the quenched specimens gradually increased with increasing quenching temperature until a maximum was reached. This indicates that macro-hardness of the quenched specimens depends on both the amount and hardness of martensite matrix. All specimens which were tempered at 723873 K showed secondary hardening. Furthermore, hardening of the specimens was most apparent when specimens containing large amounts of retained£were tempered at an optimum temperature. For example, the hardness of specimens with added Ta increased to around 900 HV after tempering at 823 K. These results suggest that the macro-hardness of tempered specimens is governed by the maximum amount of carbon in the£matrix at quenching temperature, the degree of transformation from retained£to martensite, and the precipitation and distribution of secondary carbides. [doi:10.2320/matertrans.F-M2011836]
(Received December 7, 2010; Accepted July 5, 2011; Published January 18, 2012)
Keywords: high-carbon high-speed steel, cast iron, carbide, heat treatment, wear resistance, solidification, eutectic structure
1. Introduction
High-chromium cast irons and Ni-hard type cast irons have been used as appropriate alloy materials in cast rolls for steel mills in many steel plants since around 1980. More recently (since around 1990), high-carbon high-speed steel type cast alloys (HCHS) which have hard carbides like MC, M2C and
M7C3in the matrix have been used in cast rolls, because of
the attractive thermal resistance and wear resistance imparted by the carbides.14) However, further improvement of the durability of cast rolls under a high-pressure environment is still required, to decrease the replacement costs of the rolls as much as possible. Investigating the effect of additive elements which generate carbides in the matrix is important to improve the mechanical and thermal properties of HCHS. However, there are not enough phase diagrams explaining multielemental composition like HCHS, making it is difficult to design a suitable composition of HCHS for cast rolls without experimental evaluation of solidification structures.
Miyasaka,5) Wu,6,7) Yamamoto8) and Ichino9) have all
studied the influence of additive elements such as V, Nb, Mo, W, Cr, etc. on the mechanical and thermal properties of HCHS. Hard carbides of MC, M2C and M7C3are generated
in the matrix of HCHS during the solidification process when
elements from groups VAand VIAin the periodic table are
added. These carbides significantly improve the mechanical and thermal properties of HCHS. On these additive elements, vanadium was particularly efficient at generating large amounts of MC type carbides (to give samples with overall macro-hardness of 21002800 HV). MC type carbides are harder than other carbides like M2C (11502250 HV) and
M7C3(16002410 HV). These results suggest that Ta, which
belongs to same group as V in the periodic table, would also be a suitable additive element for generation of hard MC carbides in the matrix and hence improve the mechanical and thermal properties of HCHS.
In the present study, solidification structures and quench/ temper hardnesses of HCHS with added Ta were investigated to evaluate the effects of Ta addition. The new compositions were compared with that containing additional V only to determine the compositions and heat treatments which may provide steels with the excellent mechanical and properties required for application to HCHS rolls.
2. Experimental Methods
2.1 Solidification structure of HCHS
The following procedure was carried out to prepare HCHS specimens: Fe5.3 mass% C (hereby abbreviated to %), Cr (99.99%purity) and ferroalloys (Fe83%V, Fe62%Mo and Fe31%Ta) were put into an alumina crucible in the requires quantities, and then the specimens were melted in a carbon resistance furnace at 1723 K in an argon atmosphere. The melted specimens were cast into sand molds (10 mm© 40 mm©80 mm) which were preheated to 1173 K. The
+1This Paper was Originally Published in Japanese in J. JFS82(2010) 659
666.
+2Corresponding authors, E-mail: [email protected], miyahara@
zaiko.kyushu-u.ac.jp
+3Graduate Student, Kyushu University. Present address: Institute of
Scientific and Industrial Research, Osaka University, Ibaraki 567-0047, Japan
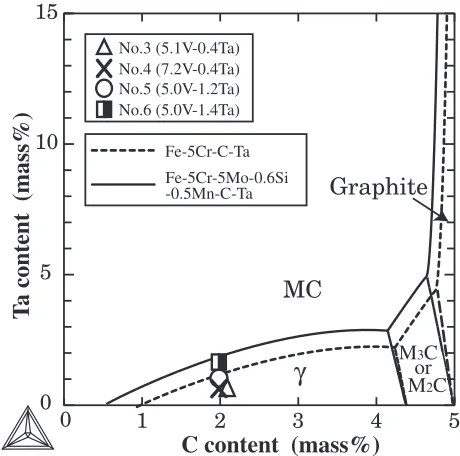
chemical compositions of as-cast specimens are listed in Table 1. The amounts of Ta or V added were decided using liquidus surface diagrams which were calculated by phase diagram software (Thermo-Calc, Thermo-Calc Software, Sweden) with standard databases SSOL and Fe-data. In this work, MC carbides should be dispersed in the matrix of HCHS to increase the hardness, however growing of primary MC carbides which can move in the liquid should be avoided, since it become a segregation by centrifugal casting. Therefore, MC carbides should be uniformly dispersed among primary £ dendrite as eutectic MC to decrease the crystallization of primary MC by controlling the V and Ta contents. We initially tried to calculate phase diagrams for the FeCVTa alloy, but this calculation failed due to unknown causes. So, phase diagrams of FeCV and FeCTa, which are shown in Figs. 1 and 2 respectively, were calculated to decide the compositions of the HCHS. The amount of added Ta was selected to be 01.5% with 5.08.0%V to disperse hard MC carbides in the HCHS matrix in the hypoeutectic range.
The as-cast specimens were polished smooth with SiC sheets and diamond paste, and etched using Murakami’s solution prior to metallographic examination. Optical micros-cope observations were carried out to obtain statistics on the
area ratio of MC and M2C carbides. Furthermore, chemical
compositions of each alloying element were measured by EPMA (Shimadzu Co. Ltd., EPMA-1600). Then the ZAF method was used to get accurate compositions from the relative intensities. XRD analysis was also carried out to identify the crystal structures of the specimens.
2.2 Solidification process of HCHS
The liquidus temperatures of each phase were measured and the solidification sequences were evaluated in a SiC electric resistance furnace. 30 g of as-cast specimen was placed in an alumina-silica crucible, and then melted at 1773 K in an argon atmosphere. After holding for 600 s, the specimens were slow cooled at 0.17 K/s until the solidus temperature was passed, and subsequently quenched into water. The solidification process was investigated based on these temperature profiles and also on the microstructures which were quenched from each crystallization temperature after holding for 3600 s to prevent microsegregation. The partition coefficient was estimated from the composition ratio of liquid and solid phases at the solid/liquid (S/L) interface.
2.3 Temper hardening of HCHS
[image:2.595.312.542.71.299.2]Specimens of 5 mm©5 mm©7 mm were cut off from the as-cast specimens, and heated at 12231423 K for 3600 s in an argon atmosphere using a SiC electric resistance furnace, and then quenched into an oil bath. In addition, tempering treatments were performed on the specimens twice at 723 873 K for 3600 s in an argon atmosphere, followed by air cooling. Vickers macro-hardness was measured for all as-cast and tempered specimens by applying a load of 490.5 N (50 kgf) for 10 s. XRD was used to measure the amounts of retained£after temper treatments. The apparatus had a swing mechanism which rotated the specimens at 60 rpm, used Mo-K¡ radiation and scanned the scattering angles above approximately 30 degrees (2ª).
Table 1 Chemical compositions of specimens.
(mass%)
C Si Mn Cr Mo V Ta
No. 1 1.86 0.64 0.52 4.97 4.77 5.29 ®
No. 2 1.88 0.67 0.51 4.75 4.52 7.42 ®
No. 3 1.86 0.65 0.50 4.84 4.56 5.13 0.43
No. 4 1.93 0.66 0.47 4.60 4.39 7.24 0.41
No. 5 1.85 0.61 0.51 4.90 4.61 4.95 1.17
No. 6 1.85 0.54 0.50 4.87 4.65 5.00 1.36
0
5
10
15
V content (mass%)
0
1
2
3
4
5
C content (mass%)
γ
δ
MC
M3C or M2C No.1 (5.3V)
No.4 (7.2V-0.4Ta) No.3 (5.1V-0.4Ta) No.2 (7.4V)
No.5 (5.0V-1.2Ta) No.6 (5.0V-1.4Ta) Fe-C-V
Fe-5Cr-5Mo -0.6Si-0.5Mn -C-V
Fe-5Cr-5Mo -5W-C-V (experimental10))
Fig. 1 Calculated liquidus surface diagram of FeCV alloy and Fe5Cr 5MoCV alloy. The experimental result for the Fe5Cr5Mo5WCV alloy is also shown.
M2C 0
5 10 15
T
a
content (mass%)
0 1 2 3 4 5
C content (mass%)
γ
MC
No.4 (7.2V-0.4Ta) No.3 (5.1V-0.4Ta)
No.5 (5.0V-1.2Ta) No.6 (5.0V-1.4Ta)
Graphite
M3C
or
Fe-5Cr-C-Ta
Fe-5Cr-5Mo-0.6Si -0.5Mn-C-Ta
[image:2.595.51.285.163.447.2]3. Results and Discussion
3.1 Identification of crystallized carbides
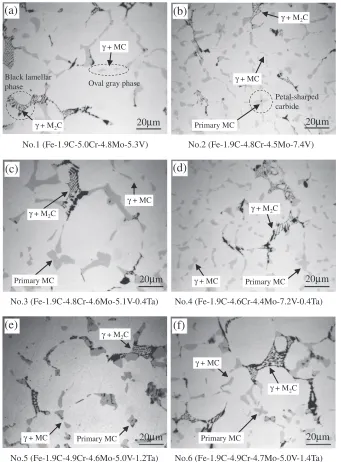
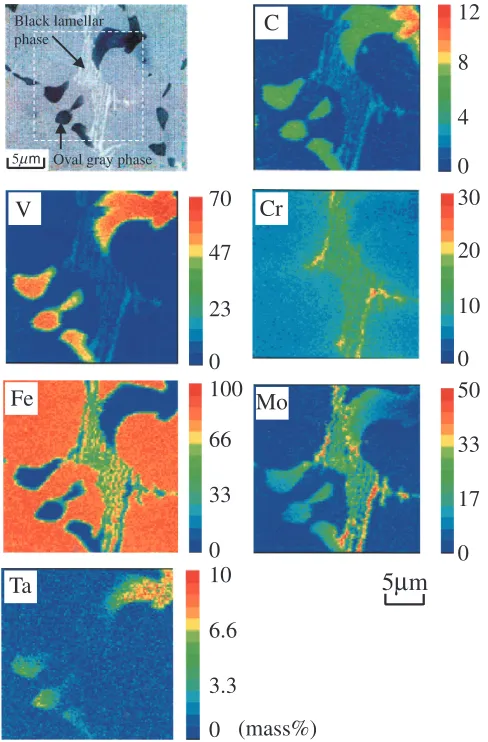
Optical microstructures of as-cast specimens are shown in Fig. 3. There are two types of carbides among the£phases: one is the black lamellar phase and the other is the oval gray phase. In addition, small amounts of petal-sharped carbides are observed in the optical images except for specimen No. 1. To identify the chemical composition of these phases, EPMA elemental mapping and spot analysis were performed on specimen No. 3, and the results are shown in Fig. 4. The black lamellar regions were carbides containing 20%Mo and 10%Cr, and the oval gray regions were also carbides containing 50%V and 5%Ta. Figure 5 shows the XRD analysis of specimen No. 1 which is a standard specimen without Ta. The pattern shows distinct peaks at the scattering angles corresponding to M2C and MC carbides. Therefore,
the lamellar phases were£+M2C eutectic consisting mainly
of Fe and Mo, and the oval phases were MC carbides containing large amounts of V and Ta. There were no
signi-ficant changes in carbide type upon Ta addition compared to V-only addition, and only MC and M2C carbides were
crystallized in all specimens. The EPMA results show that the petal-shaped carbides are primary MC carbides.
As shown in Fig. 1, the£+MC eutectic line of Fe5%Cr 5%Mo0.6%Si0.5%MnCV (full line) was calculated at lower V content than that of the FeCV ternary alloy (dashed line). Furthermore, Ogi et al.10) reported that the
£+MC eutectic line of Fe5%Cr5%Mo5%WCV is at lower V contents for the carbon content range below about 2.5% than the present alloy as experimental data. From the calculation and experimental data, additive elements like Mn, Cr, Mo and W decrease the area of £ phase in the phase diagram. Consequently, Ta additions would make the
£+MC eutectic line move to the lower V content side and decrease the area of£phase.
(a)
(b)
(c)
(d)
(e)
(f)
20μm 20μm
20μm 20μm
20μm 20μm
No.1 (Fe-1.9C-5.0Cr-4.8Mo-5.3V)
No.3 (Fe-1.9C-4.8Cr-4.6Mo-5.1V-0.4Ta)
No.5 (Fe-1.9C-4.9Cr-4.6Mo-5.0V-1.2Ta) No.6 (Fe-1.9C-4.9Cr-4.7Mo-5.0V-1.4Ta) No.4 (Fe-1.9C-4.6Cr-4.4Mo-7.2V-0.4Ta)
No.2 (Fe-1.9C-4.8Cr-4.5Mo-7.4V) γ + MC
γ + M2C
γ + M2C
γ + MC
Primary MC
γ + M2C
Primary MC
γ + MC
Primary MC
γ + M2C
γ + MC
γ + MC Black lamellar
phase Oval gray phase
Petal-sharped carbide
Primary MC
γ + M2C
Primary MC
γ + M2C
γ + MC
[image:3.595.129.470.69.531.2]3.2 Influence of Ta addition on the amount of crystal-lized carbides
From the microstructure observation of as-cast specimens, the MC carbides seem to be greater in number and more uniformly distributed in the V rich specimens No. 2 and No. 4. The volume fraction of crystallized MC and M2C
carbides were measured from the area ratio of optical microscope images as shown in Fig. 6. The amount of MC
carbides was approximately 4 vol% greater in specimens No. 2 and No. 4, compared with the standard specimen No. 1. On the other hand, significant increase in the amount of MC carbides was not observed for the specimens that only contained additional Ta, without additional V (Nos. 3, 5 and 6), in contrast with specimen No. 4. The amount of crystallized MC carbides increased by approximately 0.18 vol% and 0.09 vol% with a 1 mass% of addition of V and Ta, respectively. V addition was twice as effective as Ta. On the other hand, neither V nor Ta had a significant influence on the amount of M2C carbide, because the M2C
carbide consisted mainly of Fe and Mo, and the initial Mo contents were all about 5%.
3.3 Thermal analysis of solidification process
The solidification processes of specimens Nos. 1, 2 and 5 were investigated. The cooling curves at 0.17 K/s are shown in Fig. 7. The three transformation points observed in each of the cooling curves correspond to primary£,£+MC eutectic and £+M2C eutectic solidification. As shown in Fig. 1, £+MC eutectic temperature was calculated higher than the £+M2C, and the £+M2C eutectic solidified among £+MC eutectics in Fig. 3. Therefore, the eutectic reaction of (L¼£+M2C) occurred after the crystallization of
(L¼£+MC). From the calculated phase diagrams shown
0
0
0
0
3.3
6.6
10
17
50
33
10
30
20
4
12
8
(mass%)
0
33
100
66
5
μ
m
0
23
70
47
5C
Cr
Mo
V
Fe
Ta
μm
Black lamellar phase
Oval gray phase
Fig. 4 Solute distribution in eutectic carbides of Ta-containing specimen No. 3.
Scattering angle, 2θ / deg
30 40 50 60 70 80 90 100
γ
MC M2C
Intensity (-)
Fig. 5 X-ray diffraction analysis of standard specimen No. 1.
0 4 8 12
No.1 (5.3V)
No.2 (7.4V)
No.3 (5.1V-0.4Ta)
No.4 (7.2V-0.4Ta)
No.5 (5.0V-1.2Ta)
No.6 (5.0V-1.4Ta) MC carbide M2C carbide
V
o
lume fraction of carbides (%)
Fig. 6 Volume fraction of MC and M2C eutectic carbides in specimens.
Time, t/s
T
emperatur
e, T/K
0.5ks
C(1429K)
F(1456K)
I(1440K) H(1573K) G(1604K)
E(1587K) D(1613K)
B(1556K)
1673
1573
1473
1373
1273
(a) A(1608K)
No.1(5.3V) No.2(7.4V) No.5(5.0V-1.2Ta)
(b)
(c)
(g)
(h)
(i)
γγ
A, D, G: L→ B, E, H: L→ C, F, I: L→
+MC
γ+M2C
[image:4.595.49.293.71.442.2] [image:4.595.321.529.71.244.2] [image:4.595.318.533.286.442.2] [image:4.595.56.281.492.645.2]in Figs. 1 and 2, the primary MC should crystallize earlier than the primary £. However, transformation points did not appear in any of the cooling curves in Fig. 7. This may be because the amount of primary MC was too small to produce detectable changes in calorific value.
Specimens No. 2 and No. 5 had shorter solidification times for primary £and higher starting temperatures for the eutectic reaction (L¼£+MC) compared with specimen No. 1. The composition of the specimen No. 2 was near the
£+MC eutectic line in the calculated phase diagram indicated in Fig. 1, so that the volume fraction of primary
£decreased, and the concentration of solute elements quickly increased and the composition reached the£+MC eutectic line because of microsegregation. Furthermore, the£+MC eutectic temperature was elevated as the V content increased along with the eutectic line as shown in Fig. 1. Therefore, the eutectic reaction of (L¼£+MC) started at a high temperature than for specimen No. 1. Specimen No. 5, which has a high Ta content compared with specimen No. 1, also started the eutectic reaction (L¼£+MC) at a higher temperature.
Subsequently, specimens No. 1 and No. 5 were kept at each of the temperatures indicated in Figs. 7(a)7(c) and 7(g)7(i) for 3600 s and then quenched to investigate the redistribution process of alloying elements in primary £,
£+MC eutectic and £+M2C eutectic. The quenching
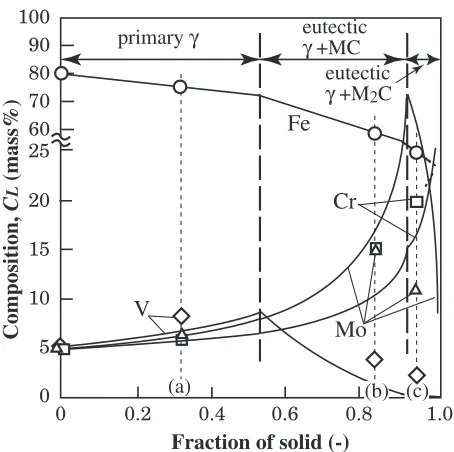
specimens included liquid phase and crystallized phase, so the concentration of alloy elements was measured at the liquid phase near the S/L interface. The composition profiles of alloying elements in the residual liquid are plotted in Figs. 8 and 9 as a function of the solid fractions. For specimen No. 1, the concentrations of V, Cr and Mo increased in the residual liquid with growth of primary £. Partition coefficients of each crystallized phase are shown in Table 2. These values were estimated from the ratios of the concentrations of alloying elements in the solid and liquid around the S/L interface. Partition coefficients of V, Cr and
Mo were 0.33, 0.64 and 0.31, respectively. Therefore, the concentrations of V, Cr and Mo rose in the primary £, as shown in Figs. 8 and 9. Changes in concentration were calculated using the initial composition and the Scheil-Gulliver equation, and are shown by full lines in Figs. 1 and 2. As the primary£grows, the V and C content increased in the residual liquid and the composition moved to the
£+MC eutectic line in the FeCV phase diagrams. When the composition reached the £+MC line, the reaction of (L¼£+MC) started. In Fig. 8, only the V concentration decreased during the solidification process of the £+MC eutectic, because the partition coefficient of V is bigger than unity (see Table 2). On the other hand, the concentrations of Mo and Cr rose in the liquid phase since their partition coefficients are smaller than unity. During the final solid-ification process, £+M2C eutectic crystallized in the
residual liquid with elevation of Mo concentration and decreasing V concentration, as shown in Fig. 8. Although the amounts of V and Mo decreased in the process, the amount
eutectic
γ +MC
0 0 5 10 15 20 25
0.2 0.4 0.6 0.8 1.0
Fe
Cr
Mo
V
Fraction of solid (-)
Composition,
C
L
(mass%)
(a)
60 70 80 90 100
primary γ
eutectic
γ +M2C
(b) (c)
Fig. 8 Redistribution of alloying elements in residual liquid of specimen No. 1.
0 5 10 15 20 50 60 70 80 90
(g)
(i)
100
Fe
Cr
Mo
V
Ta
0 0.2 0.4 0.6 0.8 1.0
Fraction of solid (-)
Composition,
C
L
(mass%)
primary γ
eutectic
γ +M2C
eutectic
γ +MC
(h)
Fig. 9 Redistribution of alloying elements in residual liquid of Ta-containing specimen No. 5.
Table 2 Partition coefficients of V, Cr, Mo and Ta in primary£and eutectic structures.
No. 1(5.3V)
Phase Partition coefficient
kV kCr kMo
£ 0.33 0.64 0.31
£+MC 2.91 0.55 0.30
£+M2C 1.78 0.65 1.41
No. 5(5V1.2Ta)
Phase Partition coefficient
kV kCr kMo kTa
£ 0.27 0.67 0.42 0.09
£+MC 2.87 0.80 0.80 1.96
[image:5.595.56.283.68.294.2] [image:5.595.312.541.70.286.2]of Cr increased with the growth of £+M2C eutectic. The
partition coefficients of V, Cr and Mo with eutectic M2C are
1.78, 0.65 and 1.41, respectively. These values of partition coefficients imply that the concentration of residual liquid will change as the solidification proceeds.
For the Ta-containing specimen No. 5, the changes in V, Cr, and Mo concentration during solidification (as shown in Fig. 9) were almost same as for specimen No. 1. The partition coefficients of Cr and Mo were approximately 0.8 for £+MC eutectic, and hence the concentration did not change greatly in the residual liquid. Addition of Ta has a tendency to reduce the partition coefficient of V and to raise those of Cr and Mo during£+MC eutectic solidification as well as during the primary£solidification. This suggests that Ta addition increases the homogeneity of solute distribution in£+MC eutectic region. On the other hand, the partition coefficient of Ta itself was 0.09 in the primary£as indicated in Table 2. Although Ta segregation was expected, significant changes in Ta concentration were not observed in the primary
£, as shown in Fig. 9. Consequently, the concentrations of each alloying element corresponded to the changes of partition coefficients in the residual liquid.
3.4 Influence of Ta on quench/temper hardness in HCHS
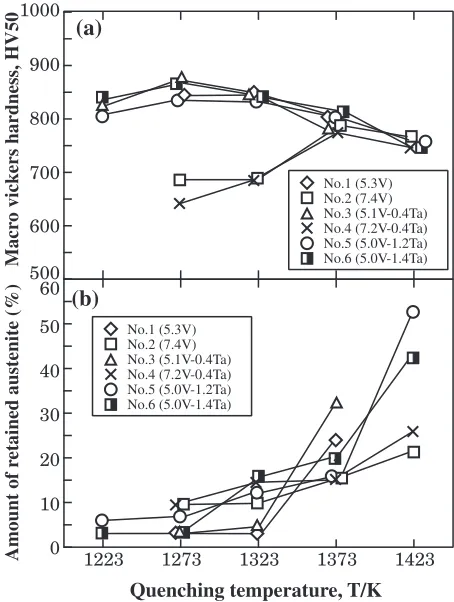
Macro Vickers hardness and amount of retained £ are plotted for each quenching temperature in Fig. 10(a). Quenched hardness increased in all specimens with elevation of quenching temperature. Specimens No. 1 and No. 2 produced their maximum values of quenching hardness at 1323 K and 1373 K, respectively. The maximum hardness for specimens Nos. 3, 5 and 6 was obtained at 1273 K. As shown in Fig. 6, the area fractions of carbides were in the range of 1216 vol%, and so 8488 vol% of specimen corresponded to the matrix which consists of primary £ and £ phases of
£+MC and £+M2C eutectic. Therefore, the quenched
hardness mostly depends on the matrix hardness as shown in Fig. 10(a).
Furthermore, the quenched martensite structure becomes hard with increase of carbon content up to 0.8%C. Therefore, from the chemical compositions of each specimen, the carbon solid solubility limits in £ phase were calculated at each quenching temperature using Thermo-Calc software, and the results are summarized in Fig. 11. The carbon content increased in £ phase with elevation of the quenching temperature and composition. In particular, Ta addition was effective in increasing the carbon content. On the other hand, when large amounts of V were added, the carbon content in£ phase decreased. The effect of carbon content (also calculated using Thermo-Calc software) on the experimental quenched hardness of all specimens is summarized in Fig. 12. The Vickers macro-hardness increased with an increase in carbon content in£ phase and then decreased from around 0.6%C. Although the quenched martensite becomes harder as the carbon content increases, excessive carbon will decrease the amount of martensite and increase the amount of retained£as shown in Fig. 10(b). The specimens with added Ta showed relatively high hardness compared with the other samples. This is because Ta addition increases the carbon solid solubility limit in£phase as shown in Fig. 11. That increase
enhances the opportunity to increase the hardness of matrix martensite. Furthermore, part of the MC carbides become TaC instead of VC when Ta is added. The solid solubility of carbon is 6.2%in TaC, much lower than that for VC (19.1%). This decrease in the amount of carbon within the MC carbides enables an increase in carbon content in the£phase. In Fig. 10(a), V rich specimens (No. 2 and No. 4) recorded their maximum hardnesses at 1373 K, which is quenched at a higher temperature than the other specimens. V addition decreases the carbon content in £ phase, so a higher
500 600 700 800 900 1000
Macr
o
vick
ers hardness, HV50
(a)
0 10 20 30 40 50 60
1223 1273 1323 1373 1423
Quenching temperature, T/K
Amount of r
etained austenite (%)
No.1 (5.3V) No.2 (7.4V) No.3 (5.1V-0.4Ta) No.4 (7.2V-0.4Ta) No.5 (5.0V-1.2Ta) No.6 (5.0V-1.4Ta)
No.1 (5.3V) No.2 (7.4V) No.3 (5.1V-0.4Ta) No.4 (7.2V-0.4Ta) No.5 (5.0V-1.2Ta) No.6 (5.0V-1.4Ta)
[image:6.595.313.540.71.372.2] [image:6.595.313.540.426.614.2](b)
Fig. 10 Influence of quenching temperature on macro-hardness (a), and amount of retained£(b).
0 0.2 0.4 0.6 0.8 1.0
C content in austenite (mass%)
1223 1273 1323 1373 1423
Quenching temperature, T/K
5V
7V 5V+Ta
No.1 (5.3V) No.2 (7.4V) No.3 (5.1V-0.4Ta) No.4 (7.2V-0.4Ta) No.5 (5.0V-1.2Ta) No.6 (5.0V-1.4Ta)
quenching temperature is needed to produce maximum hardness.
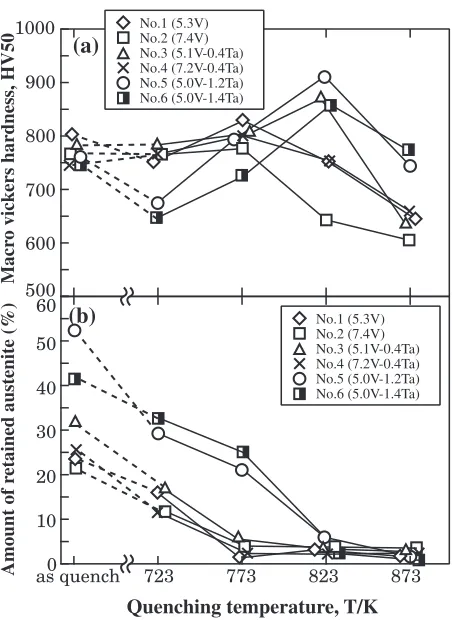
In a further step, specimens containing large amounts of retained £ (i.e., specimen Nos. 1 and 3 quenched at 1373 K and specimen Nos. 2, 4, 5 and 6 quenched at 1423 K) were tempered at 723873 K, and the macro-hardness and amount of retained £ were evaluated at each tempering temperature (Fig. 13). All specimens which were tempered at 723873 K showed secondary hardening. Maximum macro-hardness values were obtained at 773 K (Nos. 1, 2 and 4) or 823 K
(Nos. 3, 5, and 6). However, when the temperature elevated above these maximum temperatures, the macro-hardness decreased because of softening of martensite and initiation of growth of carbides. The maximum values of tempered hardness for Ta added specimens (Nos. 3, 5 and 6) were higher than that of specimen No. 1. Large amounts of retained £were present in the Ta added specimens just after quenching, so that amounts of martensite could increase when the specimens were cooled down from each tempered temperature as shown in Fig. 13(b). The relationships between macro-hardness and amount of retained £ in tempered specimens are shown in Fig. 14. Tempered hard-ness reached its maximum value when the amount of retained
£was 57%. The specimens containing larger retained£have low Vickers hardness because of the soft retained £. The hardness was also lower for samples with less than 5% of retained£. The specimens containing less than 5%retained£ were prepared by holding at high tempering temperature. Therefore, though the amounts of retained £ were low, the macro-hardness could decrease because of softening of martensite and growth of carbides due to excessive heat treatment.11) Specimens containing more than 1.2% of Ta
gave higher macro-hardnesses for a given amount of retained
£compared with specimens without Ta. For specimen Nos. 3 and 4, the Ta addition did not have a great effect on the macro-hardness, since the amounts of Ta were small. In the case of V rich specimens, the amount of retained£was small in the as-cast specimen, and hence the extents of precip-itation, secondary hardening and improvement of macro-hardness were also relatively low.
So the influence of Ta addition may be summarized as: the carbon solid solubility limit was expanded in retained£phase and the matrix became harder; the amount of retained £ increased in the as-cast specimens, and the amount of carbon which was needed to generate carbides decreased due to the increasing content of TaC. In addition, secondary hardening occurred at a low tempering temperature. Thus, HCHS with added Ta would show its maximum value of tempering hardness when a second tempering treatment at 773823 K was carried out on as-quenched specimens containing large amounts of retained£.
200 400 600 800 1000
0 0.2 0.4 0.6 0.8 1.0
C content in austenite (mass%)
Macr
o vick
ers hardness in matrix, HV50
Martensite hardness of steel
5V
7V 5V+Ta
[image:7.595.312.540.69.244.2]No.1 (5.3V) No.2 (7.4V) No.3 (5.3V-0.4Ta) No.4 (7.2V-0.4Ta) No.5 (5.0V-1.2Ta) No.6 (5.0V-1.4Ta)
Fig. 12 Influence of C content on Vickers macro-hardness of£matrix.
500 600 700 800 900 1000
Macr
o vick
ers hardness, HV50
(a)
0 10 20 30 40 50 60
as quench 723 773 823 873
Quenching temperature, T/K
Amount of r
etained austenite (%)
No.1 (5.3V) No.2 (7.4V) No.3 (5.1V-0.4Ta) No.4 (7.2V-0.4Ta) No.5 (5.0V-1.2Ta) No.6 (5.0V-1.4Ta)
(b)
No.1 (5.3V) No.2 (7.4V) No.3 (5.1V-0.4Ta) No.4 (7.2V-0.4Ta) No.5 (5.0V-1.2Ta) No.6 (5.0V-1.4Ta)
Fig. 13 Influence of tempering temperature on macro-hardness (a), and amount of retained£(b).
0 10 20 30 40
Amount of retained austenite (%) 500
600 700 800 900 1000
Macr
o vick
ers hardness in matrix, HV50
No.1 (5.3V) No.2 (7.4V) No.3 (5.1V-0.4Ta) No.4 (7.2V-0.4Ta) No.5 (5.0V-1.2Ta) No.6 (5.0V-1.4Ta)
5V 7V
[image:7.595.56.281.70.248.2]5V+Ta
[image:7.595.57.283.300.610.2]4. Conclusion
The influence of Ta addition on the solidification sequence and hardness after quenching and tempering treatments was investigated for HCHS (Fe, 1.9%C, 0.5%Mn, 4.9%Cr, 5.0%Mo, 5.07.2%V and 0.41.4%Ta) compared with the alloy with added V only, and the following conclusions were obtained:
(1) In the range of 57%V and 01.4%Ta, MC and M2C
carbides were crystallized in all specimens. There were no significant changes in carbide type and solidification process compared with the alloy with added V only. (2) Although the amount of MC carbides was increased by
the addition of V and Ta, the improvement produced by 1 mass%V is greater than that produced by 1 mass%Ta. On the other hand, neither V nor Ta have a significant influence on the amount of M2C carbides.
(3) The partition coefficients of V and Ta were 0.27 and 0.09 for primary£, respectively. Very little Ta occurred in the £ phase, so almost all Ta was present in the form of MC or M2C carbides. Adding Ta causes the
partition coefficients of Cr and Mo to become close to unity, leading to greater homogeneity of the solute distribution.
(4) Carbon solubility increased in retained£with elevation of the quenching temperature up to 1423 K, so that martensite hardness was improved. Because the amount of retained£also increased at the same time, changing the quenching temperature for each alloy composition is necessary to enhance the macro-hardness.
(5) Specimens that contain large amounts of retained £ were tempered twice at 723873 K. After the tempering
treatments, the specimens which included 57% of retained£gave the maximum macro-hardness of all the samples in this work. However, if too high a tempering temperature is used, softening of the martensite in the HCHS will occur.
Acknowledgments
We are grateful to Mr. Wakasugi Kozo for his help with XRD and EPMA analysis, and Mr. Shinya Ishikawa for his experimental assistance.
This work was supported by Japan Society for the Promotion of Science (JSPS) KAKENHI (Grant-in-Aid for Challenging exploratory research 23656480, and Grant-in-Aid for Young Scientists (B) 23760714).
REFERENCES
1) K. Goto, Y. Matsuda, K. Sakamoto and Y. Sugimoto: ISIJ Int. 32
(1992) 1184.
2) T. Kudo, S. Kawashima and R. Kurahashi:ISIJ Int.32(1992) 1190.
3) Y. Sano, T. Hattori and M. Haga:ISIJ Int.32(1992) 1194.
4) M. Hashimoto, S. Otomo, K. Yoshida, K. Kimura, R. Kurahashi, T. Kawakami and T. Kouga:ISIJ Int.32(1992) 1202.
5) Y. Miyasaka, K. Enami and T. Tanikawa: J. FES69(1997) 201. 6) H. Wu, N. Sasaguri, M. Hashimoto and Y. Matsubara: J. FES69(1997)
917.
7) H. Wu, N. Sasaguri, M. Hashimoto and Y. Matsubara: J. FES70(1998) 722.
8) K. Yamamoto, N. Miyakawa and K. Ogi: J. FES72(2000) 163. 9) K. Ichino, S. Ishikawa, Y. Kataoka and T. Toyooka: ISIJ Int.89(2003)
680.
10) K. Ogi, Y. Ono, H. Zhou and H. Miyahara: ISIJ Int.81(1995) 912. 11) N. Sasaguri, K. Yamamoto, Y. Yokomizo, M. Hashimoto and Y.