Munich Personal RePEc Archive
A New Method to Build Gene
Regulation Network Based on Fuzzy
Hierarchical Clustering Methods
Maghsoodi, Masoume
Islamic Azad University, Iran
1 June 2016
Online at
https://mpra.ub.uni-muenchen.de/79743/
169
A New Method to Build Gene Regulation Network Based on
Fuzzy Hierarchical Clustering Methods
Masoume Maghsoodi
Graduate student, Computer, Software, Islamic Azad University, Zanjan Branch, Department of Engineering and Technology, Zanjan, Iran
Abstract
The construction of genetic regulatory networks is understanding the relationship among genes or circuits which regulate the conditions of cells in response to internal or external stimuli. In fact, the objective is to understand the network of relationship among genes which determine which genes are responsible for activating other genes. The understanding of relationships may help to identify the genes which are involved in a disease and design the drugs. The most important limitations in gene regulatory network inference are low number of samples, noise penetration possibility, and large number of genes. There are different models to build gene regulatory network. This study used fuzzy hierarchical clustering method to infer gene regulatory network. Using clustering, the similar genes will be in a cluster. Many edges therefore will be removed. The final assessments showed that the genes clustering increased the efficiency of gene regulation network inference methods.
Keywords
: Principal Component Analysis, Head Cluster, Clustering, Gene Regulation Network.Introduction:
International Academic Journal of Science and Engineering, Vol. 3, No. 6, pp. 169-176.
170
needed. In differential networks, the number of considered edges is too high and makes low the detection rate in edges creation. The proposed method requires prior knowledge. The data clustering and obtaining the representatives of each cluster lead to obtaining optimal edges. The common methods of gene regulation network building include BMALR, GINIE3, PCA-CMI, and CLR. In BMALR method, the Bayesian network and linear regression are widely used in reconstruction of regulation networks. Huang and Zhik [3] studied the mean cell regulatory network inference of Bayesian model for BMALR linear regression. The [4] used BMALR method to infer the biological systems interaction. The MRNET method uses mutual information of gene expression profile and a method of feature selection (reduce redundancy – enhanced relationship of MRMR) to derive the interaction between genes [5]. The GENIE method is similar to MRNET method in that a gene plays the target role and the remaining genes play the role of regulators and in using feature selection method. Unlike MRNET method, however, it uses random forests and additional trees for regression and feature selection. Patrick and colleagues [5] studied the inference from gene networks using backward elimination. In CLR method, the MI values of RN method were developed with regard to background distribution. In this method, the possible interactions are those which have more deviation of background distribution. A maximum z-score is calculated for each gene (i) as follows. Yazdanpanah and colleagues [6], [7] studied the tuning of PID gains in Fuzzy
PID controllers. In their methods, the controllers’ gains can be optimized to reduce the time and cost of path planning for aerial and surface vessels. Huneh [8] studied the regulatory network inference from data expression using a tree-based method.
) ) , ( , 0 ( max
i i j i j i
X X I Z
)1(
The identification of gene relationships is applicable not only to understand the disease, but also to provide appropriate treatment. The clustering techniques are helpful in this regard. In the proposed method, first the genes are divided into a number of clusters. The hierarchical classification method is used to build clusters. In the next step, the gene regulation network is built on each cluster individually based on existing methods such as correlation. To connect different clusters and the networks of each cluster, an appropriate agent should be selected for each cluster and the agents should be connected to each other. The principal component analysis is used to calculate the head clusters. Sinai e al [10] used fuzzy clustering law for gene expression data. Shelens [11] studied the teaching of main component analysis. After calculating head clusters based on calculating the correlation between head clusters, the head clusters with correlations above 0.7 were bound to each other.
The gene expression is the proposed method input of matrix. Based on Multifactorial data, this matrix is a 100 in 100 matrix which includes the expression of 100 genes in 100 samples. The objective is to build a network which includes 100 nodes. Each node represents a gene. The edges among nodes represent the regulatory relationships among genes [12].
171
Fuzzy clusters:
The complexity of biological networks and large numbers of genes in microarray data sets have caused many challenges in analysis of gene expression data. The clustering technique is one of the methods to overcome these challenges; the similar genes are grouped in a cluster to analyze the function of genes. Because of the overlap among biological groups and existence of noise data in microarray data sets, the fuzzy clustering is the most suitable method to analyze gene expression data.
The fuzzy clustering method divides the data into several clusters. Any data in data set belongs to all or some of clusters with a degree of membership. The data that is close to center of a cluster has higher membership degree than the data which are away from center. In fact, the data which are far from center have smaller membership degree.
The clustering aims to place the data set X = {x1, x2, .... , XN} in clusters with cluster center as V = {vi,
1≤ i ≤C}. Assume that Uij refers to data degree of membership of xi in cluster vi. Therefore, the matrix U
with C components on given data set is defined as following. } 1
, 1 |
{u i C j N
U ij )2(
Also, the wik weight is attributed for every gene for more accurate clustering procedure. This weight shows the importance of K-th gene in i-th cluster. These weights are determined by weight matrix W =
{wik | 1 ≤ i ≤ C, 1 ≤ k ≤ D}. In this matrix, D is the dimension of data and C is the number of classes. According to above definitions, the function in fuzzy clustering should be below minimum.
J=
N
j C
i
D
K
ik jk ik m
ij w x
u J
1 1 1
2
) (
)3(
1 ,
1 0
1
D i
ij ij W
W
و
C
i ij ij U
U
1 1 ,
1 0
)4(
So, the following equation is used for fuzzy weighting and membership degree.
D
k
ik jk ik ij w x
d
1
2 ) (
)5(
N j
m ij N j
jk m ij ij
u x u
1 1
International Academic Journal of Science and Engineering, Vol. 3, No. 6, pp. 169-176.
172
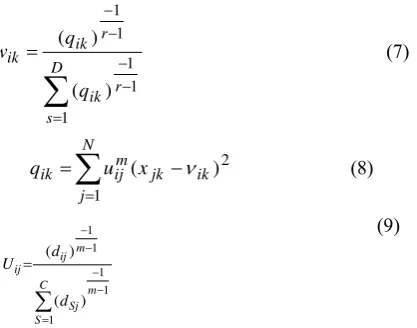
D s r ik r ik ik q q w 1 1 1 1 1 ) ( ) ( )7(
N j ik jk m ij ik u xq
1
2 )
(
)8(1 1 1 1 1 ) ( ) (
m C S Sj m ij ij d d U )9(In fact, the mean of cluster centers are taken to calculate the membership of other data in adjacent clusters. By calculating the distance of each data to centers of each cluster, the cluster fuzzy membership function is obtained. In fact, this represents the degree of membership of data in cluster.
Data set:
The DREAM3 challenge dataset was used in this study to infer silico regulation network. Evaluation criteria:
The proposed method assigns weight to each possible binding between genes. The precision-recall curve (PR) and ROC curve were used to assess these weights.
Evaluation and results:
[image:5.544.172.381.79.243.2]The DREAM3 dataset was used to assess the proposed method. This data set includes five networks. In every network, there are 100 genes and the gene expressions have been obtained in 100 different times. According to proposed method, the input is a matrix of 100 by 100.
173
Importance of clustering:
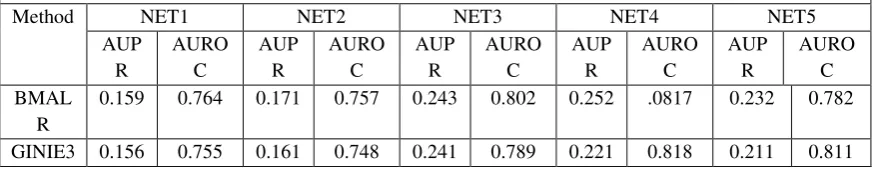
[image:6.544.48.510.240.340.2]The common gene regulation network construction methods including BMALR, GINIE3, PCA-CMI, and CLR are applied on entire gene expression matrix to show the importance of clustering. Table 1 and Figure 2 show the results of gene regulation network construction using these methods. Table 2 and Figure 3 show the results of gene regulation network construction using clustering and BMALR, GINIE3, PCA-CMI, and CLR methods.
Figure 2. Results of common gene regulation network inference methods without clustering Table 2. Evaluation of common gene regulation network inference methods with genes clustering
NET5 NET4
NET3 NET2
NET1 Method
AUROC AUPR
AUROC AUPR
AUROC AUPR
AUROC AUPR
AUROC AUPR
0.782 0.232
.0817 0.252
0.802 0.243
0.757 0.171
0.764 0.159
BMALR
0.811 0.211
0.818 0.221
0.789 0.241
0.748 0.161
0.755 0.156
GINIE3
0.742 0.191
0.722 0.179
0.725 0.203
0.683 0.114
0.721 0.131
PCA-CMI
0.741 0.192
0.753 0.195
0.762 0.212
0.712 0.147
0.738 0.155
[image:6.544.156.385.384.533.2]International Academic Journal of Science and Engineering, Vol. 3, No. 6, pp. 169-176.
[image:7.544.157.386.87.237.2]174
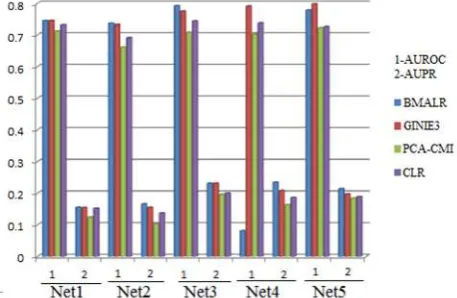
Figure 3. Results of common gene regulation network inference methods with clustering
As it can be seen, the AUPR and AUROC criteria increased in all methods. The reason for this increase is that using data clustering, many edges are deleted. Given that gene regulation network is in dispersed space in terms of number of edges, the method worked well. It should be noted that the number of cluster was considered to be 10 clusters; this number is obtained based on multiple tests. When the number of
clusters is 10, the evaluation criteria are better. The clustering method is one of the important parameters in proposed method. The K-means and c-means were clustered to identify the best method of clustering gene expression data using hierarchical clustering methods. The results of clustering methods with gene regulation networks construction methods are displayed in table below.
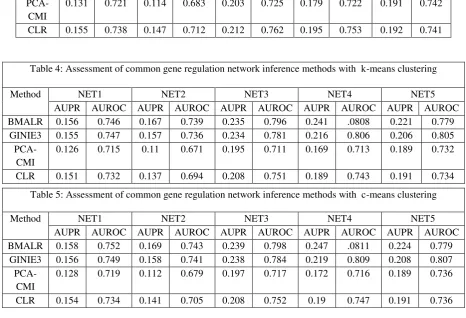
Table 3: Assessment of common gene regulation network inference methods with hierarchical clustering
NET5 NET4
NET3 NET2
NET1 Method
AURO C AUP
R AURO
C AUP
R AURO
C AUP
R AURO
C AUP
R AURO
C AUP
R
0.782 0.232
.0817 0.252
0.802 0.243
0.757 0.171
0.764 0.159
BMAL R
0.811 0.211
0.818 0.221
0.789 0.241
0.748 0.161
0.755 0.156
[image:7.544.57.495.351.436.2]175
According to above tables, it is clear that the hierarchical clustering method is better than other clustering methods. According to results shown in table, it is also clear that in all clustering methods, the evaluation criteria improved compared with when the clustering was not performed. These results showed that clustering is effective in gene regulation network construction.
Conclusion:
The understanding of relationships among genes may help to detect the genes which are involved in a disease and design drugs. This study proposed a gene regulation network inference method. In this method, first the genes are divided into different clusters; this makes a lot of edges in network to be removed. According to evaluations, the hierarchical approach is better than other methods. The gene regulation are built in networks based on common procedures. The head clusters should be obtained to converge and connect the achieved networks in each cluster.
The final evaluation showed that the clustering of genes improved the efficiency of gene regulation network inference methods.
[image:8.544.41.508.81.399.2]0.742 0.191 0.722 0.179 0.725 0.203 0.683 0.114 0.721 0.131 PCA-CMI 0.741 0.192 0.753 0.195 0.762 0.212 0.712 0.147 0.738 0.155 CLR
Table 4: Assessment of common gene regulation network inference methods with k-means clustering
NET5 NET4 NET3 NET2 NET1 Method AUROC AUPR AUROC AUPR AUROC AUPR AUROC AUPR AUROC AUPR 0.779 0.221 .0808 0.241 0.796 0.235 0.739 0.167 0.746 0.156 BMALR 0.805 0.206 0.806 0.216 0.781 0.234 0.736 0.157 0.747 0.155 GINIE3 0.732 0.189 0.713 0.169 0.711 0.195 0.671 0.11 0.715 0.126 PCA-CMI 0.734 0.191 0.743 0.189 0.751 0.208 0.694 0.137 0.732 0.151 CLR
Table 5: Assessment of common gene regulation network inference methods with c-means clustering
International Academic Journal of Science and Engineering, Vol. 3, No. 6, pp. 169-176.
176
Reference:
[ 1
] J. DeRisi 1 and V. Iyer 2 and P. Brown 3 ,’’ Exploring the metabolic and genetic control of gene
expression on a genomic scale ’’, Science 1997 ,pp. 680-686.
]2[ T. Schlitt 1 and A Brazma 2 ,’’ Current approaches to gene regulatory network modelling ’’, BMC Bioinformatics 2007
[3] X. Huang 1 and Z.Zhike 2 ,” Inferring cellular regulatory networks with Bayesian model averaging for
linear regression (BMALR)”, Mol. BioSyst., 2014, pp. 2023-2030.
[4] X. Huang 1 and Z. Zhike ,” Inferring cellular regulatory networks with Bayesian model averaging for
linear regression (BMALR)”, Mol. BioSyst , 2014.
[5] E. Patrick 1 and et al,” Information-Theoretic Inference of Gene Networks Using Backward
Elimination”, BMC Bioinformatics, 2010,
[6] V. A. HuynhThu 1,” Inferring Regulatory Networks from Expression Data Using Tree-Based
Methods ”, PLoS ONE,2011.
[7] E. Abbasi, M.J. Mahjoob and R. Yazdanpanah. “Controlling of Quadrotor UAV Using a Fuzzy
System for Tuning the PID Gains in Hovering Mode,” International Workshops in Electrical-Electronics Engineering, ACE-2013, Koc University, 5-7 September 2013.
[8] R. Yazdanpanah, M. J. Mahjoob, and E. Abbasi. "Fuzzy LQR Controller for Heading Control of an Unmanned Surface Vessel." International Conference in Electrical and Electronics Engineering, ACE 2013, Koc University, September 2013.
[9] Faith 1 and B.Hayete 2 and J. Thaden 3 ,’’ Large-scale mapping and validation of escherichia coli
transcriptional regulation from a compendium of expression profiles’’, PLoS Biol 2007.
[10] M. Sinaee 1 and G .Eghbal 2 and Mansoori 3 , “Fuzzy Rule Based Clustering for Gene Expression
Data”,4th International Conference on Intelligent Systems, Modelling and Simulation, IEEE 2013.
[11] J. Shlens 1 ,”A TUTORIAL ONPRINCIPAL COMPONENT ANALYSIS”, Derivation, Discussion
and Singular Value Decomposition. 20…, pp.