Development of Interatomic Potential for Zr-Ni Amorphous Systems
T. Kumagai
*, D. Nikkuni
*, S. Hara, S. Izumi and S. Sakai
Mechanical Engineering, School of Engineering, The University of Tokyo, Tokyo 113-861, Japan
This study develops a way of determining the interatomic potential of Zr-Ni using an embedded atom method for binary systems that can reproduce the material properties of its amorphous states. In order to ensure the robustness of the developed interatomic potential, the potential energies and lattice constants of Zr crystals, Ni crystals, and Zr-Ni binary crystals that involve a wide range of local atomic environments are employed for fitting. The elastic properties of some such crystals are also employed. In addition, in order to reproduce Zr-Ni amorphous properties, the radial distribution function of Zr70Ni30amorphous structures and the defect formation energies of Zr-Ni structures are employed.
By fitting to a portion of the material properties that requires relatively little computation time, optimization using genetic algorithms is carried out as a first step. As a result, several potential parameter sets are generated. The final potential parameter set, which can reproduce all the material properties used for fitting, is selected from them. The developed potential can reproduce the material properties used for fitting which
involve the radial distribution function of the Zr70Ni30amorphous structure. [doi:10.2320/matertrans.MF200602]
(Received December 8, 2006; Accepted February 13, 2007; Published May 25, 2007)
Keywords: amorphous metals, zirconium, nickel, embedded atom method, interatomic potential
1. Introduction
Amorphous metal shows excellent mechanical properties, such as high tensile strength and large elastic strain.1) In recent years, amorphous metals that have a stable under-cooled liquid phase have been discovered by Inoueet al.2,3) That such amorphous metals can be obtained at a cooling rate from 0.1 to 100 K/sec allows the fabrication of large-size samples. These amorphous metals are referred to as ‘‘metallic glasses’’. However, the formation mechanism of such me-tallic glasses remains undetermined. The molecular dynam-ics (MD) approach is expected to clarify these glass’s formation mechanism from an atomic viewpoint.
Two-body interatomic potentials have been used for the MD calculations of amorphous metals since atomic radius and mixing energy can easily be expressed using these potentials.4,5) However, their applications are limited to qualitative discussions,4–6) since other material properties such as elastic constants cannot be reproduced. On the other hand, MD calculations employing embedded atom method (EAM) interatomic potentials can reproduce metallic glass more accurately than can those of two-body interatomic potentials,4,5) since they can reproduce many more material properties than can two-body interatomic potentials. There-fore, EAM interatomic potentials are thought to be suitable for the quantitative description of metallic glass.
based metallic glasses such as Ni-Al, Cu-Al, Zr-Ni-Cu-Al, and Zr-Ti-Ni-Cu-Al systems have high glass forming ability. In order to understand the formation mechanism of such metallic glasses, MD simulations for Zr-Ni amorphous systems can be considered as starting points. Aihara et al.7–12) has investigated Zr-Ni amorphous alloys using Finnis-Sinclar type interatomic potential devel-oped by Massobrio.13)Although their calculations reproduce various properties of Zr-Ni amorphous structures, quantita-tive comparisons of structural properties have not been performed. Zhouet al.have developed the Generalized EAM (GEAM) interatomic potential, which can deal with Zr-Ni systems.14,15) Once potential parameter sets for single
component systems have been developed, any combinations of them can be dealt with within the framework of GEAM. However, we have found that the radial distribution function (RDF) of the Zr70Ni30 amorphous structure cannot be
reproduced by MD calculations employing GEAM inter-atomic potential.16) Therefore, the purpose of the present study is to develop an EAM interatomic potential for Zr-Ni binary systems that can reproduce the material properties of Zr-Ni amorphous structures. Among these properties, we pay special attention to the RDF of the material’s amorphous structure.
2. The Method for Making Interatomic Potentials
Our method for making interatomic potentials involves the following four processes: 1) detection of a function form, 2) selection and collection of fitting material properties, 3) optimization of potential parameters, and 4) final selection of potential parameter set.17)
In the ‘‘detection of a function form’’, a suitable potential function form regarding the material’s bonding nature (i.e., covalent bonds, metallic bonds, ionic bonds, and mixed bonds) is detected.
In the ‘‘material properties used for fitting are selected and collected’’. Interatomic potentials depend on local atomic environments, such as bond length, bond angle, and coordination number. Therefore, if MD calculation would meet unexpected local atomic environments that were not taken into account in the fitting procedure, the behaviors of the MD system cannot be guaranteed. In addition, a potential should reproduce the key material properties of a particular system in response to the purpose of the study. In order to take into account these two requirements, we propose two types of material properties that are used for fitting. These are referred to as ‘‘standard fitting data’’ and ‘‘optional fitting data,’’ respectively.
In order to ensure the robustness of the potential, since interatomic potentials depend on local atomic local environ-ments, energy curves as a function of such local atomic environments should be reproduced. Therefore, basically the basic values of the potential energy of atomic configurations
*Graduate Student, The University of Tokyo
Special Issue on Materials Science of Bulk Metallic Glasses-VII
that involve a wide range of such local atomic environments should be selected. However, it is difficult to reproduce the energy curves of a part of local atomic environments by fitting them to such material properties directly. In such cases, as an alternative, material properties that describe derivatives of potential energy with respect to a local atomic environment should be selected for fitting. For example, in order to reproduce an energy curve as a function of bond length, potential energy, and bulk modulus at the equilibrium state can be selected. In the present method, these material properties for ensuring robustness are referred to as ‘‘standard fitting data.’’
In order to reproduce key material properties for the purpose of MD calculation, ‘‘optional fitting data’’ are used for fitting.
Only established experimental data are employed as material properties for fitting. Other unestablished data and the material properties of hypothetical configurations are obtained from first principles calculations.
Potential parameters are optimized using a multi-dimen-sional optimization method. In order to avoid the local minimum problem, potential parameters are optimized using a global-search procedure. Especially, genetic algorithm (GA)18)is thought to be suitable for optimization of potential parameters, since it is not necessary to calculate the trouble-some differentials of potential energy with respect to potential parameters in the fitting procedure. In addition, optimization of potential parameters can be restarted from potential parameter sets obtained from previous optimiza-tions. By fitting to standard fitting data and part of optional fitting data, which takes little computation time, optimization is carried out as a first step. As a result, several potential parameter sets are generated. Optimization function of a potential parameter set is defined as sum of polynomials of differences between material properties used for fitting and those obtained using the potential parameter set:
fðPÞ ¼X i
X
j
wi;jjfiti
P
i j
j; ð1Þ
where, P is a potential parameter set, fðPÞis optimization function forP,fiti isith material property used for fitting,Pi
is that obtained usingPandwi;jis weight ofjth power forith
material property used for fitting. wi;j should be adjusted
during fitting process.
The potential parameter set, which can reproduce all material properties used for fitting (including standard fitting data and all of optional fitting data), is finally selected from potential parameter sets generated in the optimization of potential parameters process.
3. Development of Zr-Ni Interatomic Potential
3.1 Potential function form
In this study, the interatomic potential function, whose function form is a form of improved GEAM potential function,14,15)is based on the EAM framework.19–21)The total energyEof the system is written as eq. (2),
E¼1
2
X
i
X
jð6¼iÞ
aiajðrijÞ þ X
i
FaiðiÞ; ð2Þ
whereiandjindicate atomic index,aiindicates the atomic
species of atomi,rijdenotes the interatomic distance between
atomi and j,i denotes the background electron density at
atomi,abðrÞ is the pair potential function between atomic
speciesaand atomic species b, andFaðÞis the embedding
function of atomic speciesa.
Pair function termabðrÞis defined as eq. (3),
abðrÞ ¼ f;abðrÞAabexp ab
r
re;ab 1
f;abðrÞBabexp ab
r
re;ab 1
; ð3Þ
whereAab,Bab,ab,ab, and re;ab are potential parameters
between atomic speciesaandb, and f;abðrÞand f;abðrÞare
cutoff functions between atomic speciesa and b. This pair function term depends on interatomic distance, the chemical order of the atomic pair, and the number of neighboring atoms (i.e.,Pjð6¼iÞ).
Two cutoff functions f;abðrÞ and f;abðrÞ are defined as
eq. (4) and eq. (5), respectively,
f;abðrÞ ¼
1; rabre;ab
1
1þ
r
re;ab
ab
N;ab; r> abre;ab 8
> > > < > > > :
ð4Þ
f;abðrÞ ¼
1; rabre;ab
1
1þ
r re;ab
ab
N;ab; r> abre;ab 8
> > > < > > > :
ð5Þ
whereab,ab,N;ab, andN;ab are the potential parameters
between atomic speciesaandb. These forms are similar to those proposed by Zhouet al.14,15)
The background electron density of atom i, i, can be
defined by the sum of the partial electron densities of the neighboring atoms,
i¼X jð6¼iÞ
fe;ajaifajðrijÞ; ð6Þ
faðrÞ ¼ f;aaðrÞexp aa
r
re;aa 1
:; ð7Þ
where, fe;abindicates electron density ratio of atomic species
atob. Therefore, the conditions
fe;aa¼1; ð8Þ
fe;ab¼
1
fe;ba
; ð9Þ
are imposed. This background electron densityidepends on
the number of neighboring atoms (i.e.,Pjð6¼iÞ), the atomic species of neighboring atoms (i.e.,fe;ajai), and the interatomic
distances between atom i and neighboring atoms (i.e., fajðrijÞ).
By connecting the following three functions (i.e., eq. (10), eq. (11), and eq. (12)), embedding function FðÞ can be defined as,
FaðÞ ¼
X3
i¼0
Fni;a n;a1
i
; < n;a;
FaðÞ ¼
X3
i¼0
Fi;a e;a
1
i
; n;a < u;a;
u;a¼Tu;ae;a; ð11Þ
FaðÞ ¼Fe;a 1ln s;a
a
s;a
a
; u;a; ð12Þ
where, e;a,s;a,Tn;a,Tu;a,a,Fni;aði¼03Þ, andFi;aði¼
03Þ are potential parameters for atomic species a. It should be noted that the potential parameters are optimized so that these three functions are continuous at two connection points (i.e., n;a and u;a) up to second-order derivatives. These are similar forms to those proposed by Zhou et al.
However, the restrictions Tn;a ¼0:85 and Tu;a¼1:15 are
eliminated.14,15)
After all, the potential function can be incorporated with local atomic environments such as interatomic distance, the number neighboring atoms, and chemical order. If the system involves only a single component and the following conditions (eq. (13)) are imposed, the potential function form would be equivalent to the GEAM potential function form,
e;a¼ GEAM e;a
fGEAM e;a
; s;a¼ GEAM s;a
fGEAM e;a
;
Aaa ¼AGEAMa ;Baa¼BGEAMa ;
aa¼GEAMa ; aa¼aGEAM;re;aa¼rGEAMe;a ; aa¼GEAMa ; aa¼aGEAM;N;ab ¼20;N;ab¼20
fe;ab¼
fGEAM e;a
fGEAM e;b
Tu;a¼1:15;Tn;a ¼0:85; ð13Þ
where potential parameters with the superscript GEAM
denotes the original GEAM potential parameters.
3.2 Selection and collection of fitting material properties
3.2.1 Selection for Zr-Zr and Ni-Ni potential
parame-ters
Since the potential function can be incorporated with interatomic distance and the number of neighboring atoms as a potential function for single component systems, the standard fitting data for these local atomic environments should be selected.
As standard fitting data for the number of neighboring atoms, cohesive energies for DIAMOND Zr, SC Zr, BCC Zr, FCC Zr, HCP Zr, DIAMOND Ni, SC Ni, BCC Ni, FCC Ni, and HCP Ni, as well as their lattice constants are employed. As standard Fitting data for interatomic distance, the elastic constants of FCC Ni and HCP Zr and the bulk moduli of SC Ni, BCC Ni, FCC Ni,SC Zr, BCC Zr, FCC Zr, and HCP Zr are employed. Energy curves as a function of atomic volume are fitted to within the range of 70%–130% around the equilibrium atomic volume for SC Ni, BCC Ni, FCC Ni, BCC Zr, FCC Zr, and HCP Zr as standard fitting data for interatomic distance. In addition, the defect formation energies of FCC Ni and HCP Zr are employed as optional fitting data.
Since the structures of SC Ni, BCC Ni, HCP Ni,SC Zr, BCC Zr, and FCC Zr are hypothetical, the material properties of these structures are obtained from first principles
calcu-lations. Energy curves, which cannot be collected from experiments, are also obtained from first principles calcu-lations. Other material properties are collected experimen-tally.
3.2.2 Selection for Zr-Ni potential parameters
For a binary component system, the potential function can be incorporated with interatomic distance, the number of neighboring atoms, and chemical order. Therefore, the standard fitting data for such local atomic environments should be selected.
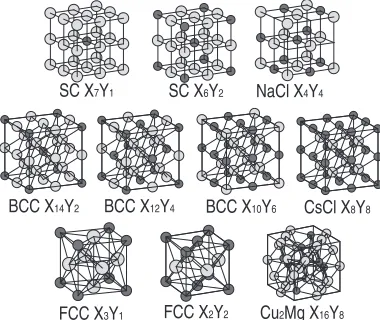
Formation energies and lattice constants for SC-type, BCC-type, FCC-type, and Cu2Mg-type binary systems are
employed as standard fitting data for the number of neighboring atoms and their chemical order. Since BCC-type Zr14Ni2 was not converged in the first principles
calculations, it is not included in the BCC-type binary systems. SC-type binary systems include SC-type Zr7Ni,
[image:3.595.49.292.72.248.2]Zr6Ni2, NaCl, Zr2Ni6, and ZrNi7 as shown in Table 1 and
Fig. 1. Energies of SC Zr and SC Ni are selected as reference energies for them. type binary systems include BCC-type Zr12Ni4, Zr10Ni6, CsCl, Zr6Ni10, Zr4Ni12, and Zr2Ni14as
[image:3.595.304.549.104.331.2]shown in Table 1 and Fig. 1. Energies of BCC Zr and BCC Ni are selected as reference energies for them. FCC binary systems include FCC Zr3Ni, Zr2Ni2, and ZrNi3as shown in
Table 1 and Fig. 1. Energies of FCC Zr and FCC Ni are selected as reference energies for them. Cu2Mg-type Zr2Ni,
and ZrNi2 as shown in Table 1 and Fig. 1. Energies of HCP
Zr and FCC Ni are selected as reference energies for them. Since the cohesive energies of the reference states are not perfectly reproduced by the developed interatomic potentials, formation energies which are relative values are employed for fitting. It is noted that these structures involve a wide range of numbers and chemical order of neighboring atoms as shown in Table 1.
The bulk moduli of FCC-type Zr3Ni, FCC-type ZrNi3,
[image:3.595.57.291.341.445.2]Cu2Mg-type Zr2Ni, and Cu2Mg-type ZrNi2are employed as
Table 1 Coordination numbers of various Zr-Ni binary crystals. ZZris total
coordination number of atomic species Zr and ZZrNiis number of atomic
species Ni included in ZZr.
Structure Coordination Number
ZZrZr/ZZr ZZrNi/ZZr ZNiNi/ZNi ZNiZr/ZNi
SC Zr7Ni 4/6, 6/6 2/6, 0/6 0/6 6/6
SC Zr6Ni2 4/6 2/6 0/6 6/6
NaCl ZrNi 0/6 6/6 0/6 6/6
SC Zr2Ni6 0/6 6/6 4/6 2/6
SC ZrNi7 0/6 6/6 4/6, 6/6 2/6, 0/6
BCC Zr12Ni4 4/8, 8/8 4/8, 0/8 0/8 8/8
BCC Zr10Ni6 2/8, 8/8 6/8, 0/8 0/8 8/8
CsCl ZrNi 0/8 8/8 0/8 8/8
BCC Zr6Ni10 0/8 8/8 2/8, 8/8 6/8, 0/8
BCC Zr4Ni12 0/8 8/8 4/8, 8/8 4/8, 0/8
BCC Zr2Ni14 0/8 8/8 6/8, 8/8 2/8, 0/8
FCC Zr3Ni 8/12 4/12 0/12 12/12
FCC Zr2Ni2 4/12 8/12 4/12 8/12
FCC ZrNi3 0/12 12/12 8/12 4/12
Cu2Mg Zr2Ni 6/12 6/12 4/16 12/16
the standard fitting data for interatomic distance and its chemical order.
Since amorphous structures are thought to be similar defected structures, octahedral-type Zr interstitial, octahe-dral-type Ni interstitial, (100) split-type Zr interstitial near the Zr site (split-type Zr-Zr interstitial), (100) split-type Zr interstitial near the Ni site (split-type Zr-Ni interstitial), (100) split-type Ni interstitial near the Zr site (split-type Ni-Zr interstitial), (100) split-type Ni interstitial near the Ni site (split-type Ni-Ni interstitial), and mono vacancy formation energies for FCC-type Zr3Ni FCC-type Zr2Ni2 FCC-type
ZrNi3 are employed as optional fitting data, respectively.
Since the purpose of this study is to reproduce the Zr-Ni amorphous structure, the RDF of the Zr70Ni30 amorphous
structure is employed as optional fitting data. The lattice constants and formation energies of several stable Zr-Ni alloys22,23) are also added to the optional fitting data. As candidates of stable Zr-Ni alloys, Al2Cu-type Zr2Ni,Zr2Ni,
Fe2P-type Zr2Ni, CrB-type ZrNi, Al2Cu-type ZrNi2, and
Fe2P-type ZrNi2 are employed. The reference energies of
these structures are HCP-type Zr and FCC-type Ni. A great deal of time is needed to compute the RDF and material properties of these alloys, which have several structural parameters. Therefore, these material properties are not used for the optimization of potential parameters, and are used only for the selection of the final potential parameter set in the final selection of the potential parameter set.
3.2.3 Collection of fitting material properties
In this study, plane-wave pseudopotential calculations based on density functional theory were performed using the Vienna abinitio simulation package (VASP)24,25) for first principles calculations. The energy cutoff of the planewave basis was set at 400 eV, and spin polarized generalized gradient approximation (GGA) proposed by Perdew, Berke, and Ernzerhof26) was employed as a exchange-correlation functional. Monkhorst-Pack point grids are used for the k-point sampling.27) Since the material properties obtained from first principles calculations using the plane wave pseudopotential method based on density functional theory do not accurately agree with those obtained experimentally, they are converted in order to achieve consistency with the experimental material properties. The details of this con-version are described in the Appendix.
The lattice constant of Cu2Mg-type ZrNi2 (6.916 A˚ ) is
collected from the experimental data.22) The RDF of the Zr70Ni30amorphous structure was collected from the
experi-ment,28) which was performed using high energy x-ray diffraction of SPring-8 synchrotron radiation. Other material properties are obtained from our first principles calculations.
3.3 Optimization for potential parameters and selection
of the final potential parameter set
From sensitivity analysis,fe;ZrNiturned out to greatly affect
the shape of RDF. Therefore, we generated many potential parameter sets with respect to various fixed values of fe;ZrNi.
Other potential parameters are optimized using GA. Among them, we have selected a potential parameter set that best reproduces the RDF of Zr70Ni30. As a result, a potential
parameter set that involves fe;ZrNi¼0:215 is selected.
Potential parameter sets that involve fe;ZrNi>0:3 could not
reproduce the split first peak of RDF for Zr70Ni30amorphous
structures.
In above process, for each optimized potential parameter sets, RDFs of Zr70Ni30 amorphous structures were checked.
Amorphous structures were fabricated by the melt-quench (MQ) method in the framework of MD simulation. FCC-type structures that involve 350 Zr atoms and 150 Ni atoms were annealed at 5000 K for 0.216 nsec. After that, the system was quenched at the rate of41012K/s. Finally, it was annealed at 500 K for 2.16 nsec.
4. Results
4.1 Potential parameters
Zr-Zr, Ni-Ni, and Zr-Ni potential parameter sets are shown in Table 2. ZrZrðrÞ, NiNiðrÞ, and ZrNiðrÞ are shown in
Fig. 2.
Two-body functions ZrZr, ZrNi, and NiNi, and partial
electron density functions fZrðrÞ and fNiðrÞ are shown in
Fig. 3 and Fig. 4, respectively.
Embedding functions ZrFZrðÞand NiFNiðÞare shown in
Fig. 5 and Fig. 6, respectively.
4.2 Material properties for crystals and defected
structures used for fitting
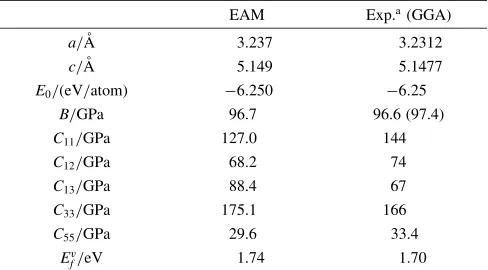
The material properties for the crystals and defected structures used for fitting the material properties of HCP-type Zr and FCC-type Ni obtained from the developed interatomic potential are shown in Table 3 and Table 4, respectively. Close agreement with the experimental data was shown.
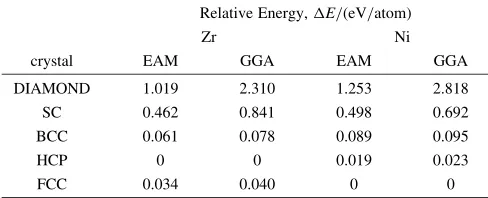
The relative energies and equilibrium bond lengths of the Zr and Ni polytypes obtained from the developed interatomic potential are shown in Table 5 and Table 6, respectively. The relative energies and equilibrium bond lengths of BCC-type, FCC-type, and HCP-type structures for both Zr and Ni show good agreement with those of GGA, scaled GGA, or experimental data. The relative energies and equilibrium bond lengths of DIAMOND-type and SC structures for both Zr and Ni deviate from GGA, or scaled GGA data. However, these deviations regarding the material properties of DIA-MOND and SC structures are thought to be acceptable, since in practice these structures are difficult to realize in bulk due to their high energy states.
BCC X14Y2 BCC X12Y4 BCC X10Y6
SC X7Y1
CsCl X8Y8
FCC X2Y2 Cu2Mg X16Y8
SC X6Y2 NaCl X4Y4
FCC X3Y1
[image:4.595.73.263.74.234.2]Energy curves as a function of atomic volume obtained from the developed potential of Zr polytypes and Ni polytypes are shown in Fig. 7 and Fig. 8, respectively. In addition, the bulk moduli of the developed potential of the Zr polytypes and Ni polytypes are shown in Table 7. The energy curves and bulk moduli of BCC Zr, FCC Zr, HCP Zr, SC Ni, and FCC Ni show good agreement with those obtained from
[image:5.595.359.497.74.171.2]GGA. Those of SC Zr deviates from those obtained from GGA. This is thought to be acceptable, since in practice SC Zr is difficult to realize in bulk due to its high energy state. Bulk modulus of BCC Ni also shows deviation from that obtained from GGA. That would be caused by gradually local
Table 2 Optimized potential parameters for Zr-Ni systems.
parameters Zr-Zr Ni-Ni Zr-Ni
fe 1.00000 1.00000 0.21500
re 3.79237 2.32685 2.55111
e 29.14275 11.18498 —
s 27.00354 12.30348 —
6.74927 9.55109 5.25817
3.58856 3.65055 2.94328
A 0.21965 0.41953 0.72302
B 0.37834 0.51023 0.82486
0.14252 0.74640 0.49908
0.71208 0.95262 1.34103
n 39.36483 20.00000 28.47463
n 17.43996 20.00000 31.59732
Fn0 4:48115 2:88854 —
Fn1 0:23628 0:03351 —
Fn2 1.60210 0.19877 —
Fn3 2:64277 2:65627 —
F0 4:48697 2:88988 —
F1 0:14233 0.00000 —
F2 1.64714 0.26867 —
F3 0:62197 0.17390 —
0.71160 0.70541 —
Fe 4:56219 2:88266 —
Tn 0.96976 0.92771 —
Tu 1.57419 1.32697 —
−0.3
−0.2
−0.1 0 0.1 0.2 0.3
0.2 0.3 0.4 0.5 0.6 0.7 0.8
Pair Potential Energy,
Φ
/eV
Interatomic Distance, r/nm Zr−Zr Zr−Ni Ni−Ni
Fig. 2 Two-body functionsZrZr,ZrNiandNiNi.
−4.5
−4
−3.5
−3
−2.5
−2
−1.5
−1
−0.5 0
0 0.5 1 1.5 2 2.5 3
Embedded Energy, F/eV
Electron Density, ρ/ρe,Zr
Fig. 5 FZras a function of electron density.
0 1 2 3 4 5 6
0.2 0.3 0.4 0.5 0.6 0.7 0.8
Electron Density,
ρ
Interatomic Distance, r/nm
Fig. 3 fzras a function of interatomic distance.
−3
−2.5
−2
−1.5
−1
−0.5 0
0 0.5 1 1.5 2 2.5 3
Embedded Energy, F/eV
Electron Density, ρ/ρe,Ni
Fig. 6 FNias a function of electron density.
0 0.2 0.4 0.6 0.8 1 1.2 1.4 1.6 1.8
0.2 0.3 0.4 0.5 0.6 0.7 0.8
Electron Density,
ρ
Interatomic Distance, r/nm
[image:5.595.47.293.85.394.2]Fig. 4 fNias a function of interatomic distance.
Table 3 Material Properties for HCP Zr. In this table, a and c indicate the
respective lattice constants,E0indicates cohesive energy,Bindicates bulk
modulus,Cijindicates elastic constants, andEv
f indicates defect formation energy.
EAM Exp.a(GGA)
a/A˚ 3.237 3.2312
c/A˚ 5.149 5.1477
E0/(eV/atom) 6:250 6:25
B/GPa 96.7 96.6 (97.4)
C11/GPa 127.0 144
C12/GPa 68.2 74
C13/GPa 88.4 67
C33/GPa 175.1 166
C55/GPa 29.6 33.4
Ev
f/eV 1.74 1.70
[image:5.595.356.497.364.465.2] [image:5.595.305.549.554.689.2] [image:5.595.100.239.564.664.2]shape of energy curve around the minimum point. However, this is also thought to be acceptable, since whole shape of energy curve of BCC Ni shows agreement with that obtained from GGA.
The formation energies and lattice constants for Zr-Ni binary crystals obtained from the developed potential are shown in Table 8 and Table 9, respectively. The formation energies of the structures used for fitting can be reproduced to within 0.1 eV/atom of those of GGA except for those of NaCl and Cu2Mg-type Zr2Ni. The lattice constants of most
structures used for fitting can be reproduced within 3% of those of scaled GGA or experimental data except for those of Al2Cu-type ZrNi2, Fe2P-type Zr2Ni, and CrB-type ZrNi.
Since the fitting to RDF of Zr70Ni30 amorphous structure is
prior to the fitting to other material properties, the order of their energies cannot be reproduced exactly.
The bulk moduli of the Zr-Ni binary crystals used for fitting obtained from MD calculations employing developed interatomic potential are well reproduced, as shown in Table 10.
Defect formation energies used for fitting obtained from the developed interatomic potential are shown in Table 11. These can be reproduced within 1.0 eV/atom of those of GGA except for those of octahedral-type Zr interstitial for FCC-type ZrNi3, octahedral-type Ni interstitial for FCC-type
ZrNi3, (100) split-type Zr interstitial near Zr site for
FCC-type ZrNi3, and (100) split-type Ni interstitial near Zr site for
FCC-type ZrNi3. In this table, in case of Zr25Ni8and Zr24Ni9,
[image:6.595.306.547.71.247.2]large differences between formation energy of octahedral-type defect and those of split-octahedral-type defects are shown. In case
Table 4 Material properties for FCC Ni.
EAM Exp. (GGA)
a/A˚ 3.520 3.52a
E0/(eV/atom) 4:440 4:44a
B/GPa 179.4 180.4b(200.4)
C11/GPa 243.6 246.5c
C12/GPa 147.2 147.3c
C44/GPa 128.0 124.7c
Ev
f/eV 1.70 1.6d
aReferences 32)
bis calculated using experimental elastic constants in the reference 33)
cReferences 33)
[image:6.595.46.290.83.184.2]dReferences 34)
Table 5 Relative energies for Zr and Ni polytypes.
Relative Energy,E/(eV/atom)
Zr Ni
crystal EAM GGA EAM GGA
DIAMOND 1.019 2.310 1.253 2.818
SC 0.462 0.841 0.498 0.692
BCC 0.061 0.078 0.089 0.095
HCP 0 0 0.019 0.023
[image:6.595.46.290.257.356.2]FCC 0.034 0.040 0 0
Table 6 Lattice constants for Zr and Ni polytypes. In this table, a and c
indicate the respective lattice constants.
Lattice Constants,L/A˚
Zr Ni
crystal axis EAM scaled GGA
(Exp.) EAM
scaled GGA (Exp.)
DIAMOND a 6.245 6.114 5.171 5.100
SC a 3.066 2.893 2.366 2.329
BCC a 3.586 3.565 2.805 2.802
HCP a 3.237 (3.232)a 2.484 2.488
c 5.149 (5.149)a 4.107 4.082
FCC a 4.542 4.519 3.520 (3.52)b
aReferences 31) and references therein
bReferences 32)
0 0.5 1 1.5 2 2.5 3 3.5 4
0.01 0.015 0.02 0.025 0.03 0.035 0.04
Relative Energy,
∆
E/(eV/atom)
Atomic Volume, Ω/nm3
EAM GGA 0 0.5 1 1.5 2 2.5 3 3.5 4
0.01 0.015 0.02 0.025 0.03 0.035 0.04 0.045
Relative Energy,
∆
E/(eV/atom)
Atomic Volume, Ω/nm3
EAM GGA 0 0.5 1 1.5 2 2.5 3 3.5 4
0.01 0.015 0.02 0.025 0.03 0.035 0.04 0.045 0.05
Relative Energy,
∆
E/(eV/atom)
Atomic Volume, Ω/nm3
EAM GGA −0.5 0 0.5 1 1.5 2 2.5 3 3.5 4
0.01 0.015 0.02 0.025 0.03 0.035 0.04
Relative Energy,
∆
E/(eV/atom)
Atomic Volume, Ω/nm3
EAM GGA
Fig. 7 Energy curves as a function of atomic volume for Zr polytypes.
Upper left shows that of SC Zr, upper right shows that of BCC Zr, lower left shows that of HCP Zr and lower right shows that of FCC Zr.
0 1 2 3 4 5 6 7
0.005 0.01 0.015 0.02 0.025
Relative Energy,
∆
E/(eV/atom)
Atomic Volume, Ω/nm3
EAM GGA 0 1 2 3 4 5 6 7
0.005 0.01 0.015 0.02
Relative Energy,
∆
E/(eV/atom)
Atomic Volume, Ω/nm3
EAM GGA −1 0 1 2 3 4 5 6 7
0.005 0.01 0.015 0.02
Relative Energy,
∆
E/(eV/atom)
Atomic Volume, Ω/nm3
EAM GGA
Fig. 8 Energy curves as a function of atomic volume for Ni polytypes.
[image:6.595.305.549.320.410.2]Upper left shows that of SC Ni, upper right shows that of BCC Ni and lower left shows that of FCC Ni.
Table 7 Bulk moduli for Zr and Ni polytypes.
Bulk Modulus,B/GPa
Zr Ni
EAM Scaled GGA EAM Scaled GGA
SC 86.3 65.3 124.1 124.0
BCC 92.4 90.1 80.5 172.1
FCC 87.4 93.7 179.4 180.4
[image:6.595.47.291.406.528.2]of other interstitial-type defects, the differences are small. This tendency can be reproduced by our developed potential. In this table, for Zr25Ni8and Zr24Ni9, differences between
formation energy of octahedral-type defect and those of split-type defects are quite large. Our developed potential can reproduce large energy differences for such stoichiometries. Energy differences between them for other stoichiometries are not so large. Our developed potential can also reproduce such energy differences which are not so large.
4.3 Radial distribution function of Zr70Ni30 amorphous
structure
In the potential fitting process, the Zr70Ni30 amorphous
structure was fabricated by the MQ method as described in section 3.3. In order to check the RDF of the Zr70Ni30
amorphous structure more accurately, the MQ method as performed on a large scale and for a relatively long duration in this section. The result is averaged over 8 cases. The average density turns out to be 7.16 g/cm3, which is 1.8%
larger than that of the data obtained experimentally (7.03 g/ cm3). The average RDF of Zr
70Ni30 is shown in Fig. 9,
indicating good agreement with the RDF of experimental data, although there exist two deviation points. Those are the appearance of a small shoulder around 4.5 A˚ , and the position of the third peak around 5.8 A˚ . However, those are not thought to be so large difference. From the comparison with the result of GEAM potential, the heights of split first peaks have been improved.
5. Discussion
In order to prove the developed potential’s applicability to
amorphous states with compositions other than Zr70Ni30,
Zr36:3Ni63:7 amorphous structures were fabricated and
com-pared with experimental data. (As Xu et al.29)pointed out, although Ref. 30) is entitled ‘‘Anomalous wide angle x-ray scattering of amorphous Ni2Zr alloy’’, the sample was
Zr36:3Ni63:7.) Partial RDFs (PRDFs) for Zr-Zr, Ni-Zr, and
Ni-Ni obtained by x-ray diffraction technique are shown as the experimental data.30) We calculated experimental RDF using those experimental PRDFs for comparison. The RDF of the Zr36:3Ni63:7 amorphous structure is shown in Fig. 10.
[image:7.595.45.290.86.378.2]The RDF obtained from the developed potential shows
Table 8 Reaction Energies of Zr-Ni binary crystals used for fitting.
Relative Energy,E/(eV/atom)
Crystal Stoichiometry
EAM GGA
SC Zr7Ni 0:033 0:104
SC Zr6Ni2 0:233 0:323
NaCl Zr4Ni4 0:658 0:881
SC Zr2Ni6 0:492 0:606
SC ZrNi7 0:301 0:246
BCC Zr12Ni4 0:189 0:052
BCC Zr10Ni6 0:284 0:236
BCC Zr8Ni8 0:465 0:446
CsCl Zr6Ni10 0:410 0:343
BCC Zr4Ni12 0:371 0:381
BCC Zr2Ni14 0:243 0:163
FCC Zr3Ni 0:104 0:021
FCC Zr2Ni2 0:407 0:379
FCC ZrNi3 0:358 0:440
Cu2Mg Zr2Ni 0.385 0.596
Cu2Mg ZrNi2 0:419 0:415
Al2Cu Zr2Ni 0:299 0:327
Al2Cu ZrNi2 0:212 0:191
Fe2P Zr2Ni 0:207 0:213
Fe2P ZrNi2 0:277 0:152
CrB ZrNi 0:352 0:462
Table 9 Lattice constants of Zr-Ni binary crystals used for fitting. In this
table, a, b, and c indicate the respective lattice constants.
Lattice Constant,L/A˚
crystal stoichiometry axis
EAM Scaled GGAa(Exp.)
SC Zr7Ni a 5.620 5.606
SC Zr6Ni2 a 5.431 5.414
NaCl Zr4Ni4 a 5.021 5.188
SC Zr2Ni6 a 4.788 4.833
SC ZrNi7 a 4.733 4.734
BCC Zr12Ni4 a 6.729 6.672
BCC Zr10Ni6 a 6.513 6.527
BCC Zr8Ni8 a 3.157 3.179
CsCl Zr6Ni10 a 6.142 6.163
BCC Zr4Ni12 a 5.992 5.940
BCC Zr2Ni14 a 5.735 5.741
FCC Zr3Ni a 4.334 4.239
FCC Zr2Ni2 a 4.465 4.492
c 3.157 3.187
FCC ZrNi3 a 3.642 3.721
Cu2Mg Zr2Ni a 7.701 7.693
Cu2Mg ZrNi2 a 6.950 (6.916)b
Al2Cu Zr2Ni a 6.280 6.447
c 5.242 5.179
Al2Cu ZrNi2 a 4.814 4.978
c 7.624 7.270
Fe2P Zr2Ni a 6.605 6.827
c 4.338 4.156
Fe2P ZrNi2 a 7.393 7.356
c 2.681 2.719
CrB ZrNi a 3.009 3.267
b 9.510 9.903
c 4.329 4.107
aAll of lattice constants in this table are scaled so that that of Cu
2Mg-type
[image:7.595.304.549.93.471.2]ZrNi2structure agrees with the experimental one. bReferences 22) and references therein.
Table 10 Bulk moduli of Zr-Ni binary crystals used for fitting.
Bulk Modulus,B/GPa
crystal stoichiometry EAM Scaled GGA
FCC Zr3Ni 95.9 100.0
FCC ZrNi3 154.4 154.5
Cu2Mg Zr2Ni 79.1 75.4
[image:7.595.306.548.552.628.2]agreement with that of the experimental data as well as that of GEAM potential except for the sharper first peak and the peak around 4.5 A˚ . However, since the peak around 4.5 A˚ is quite larger, the RDF of the Zr36:3Ni63:7cannot be reproduced
accurately. In order to reproduce that accurately, that is needed to be used for fitting.
6. Conclusion
In this study, an EAM-type interatomic potential for Zr-Ni binary systems that can reproduce the material properties of Zr-Ni amorphous systems was developed. In order to ensure the robustness of the developed interatomic potential, the potential energies and lattice constants of Zr crystals, Ni crystals, and Zr-Ni binary crystals that involve a wide range of local atomic environments were employed for fitting. In addition, the elastic properties of several Zr crystals, Ni
crystals, and Zr-Ni crystals are also employed. In order to reproduce the Zr-Ni amorphous properties, the RDF of the Zr70Ni30amorphous structure and defect formation energies
of Zr-Ni structures were employed for fitting. By fitting to the part of the fitting material properties that requires little computation time, optimization was carried out as a first step using GA. As a result, several potential parameter sets were generated. The final potential parameter set, which can reproduce all of the material properties used for fitting, was selected from them. The developed potential can reproduce material properties used for fitting which involve the RDF of the Zr70Ni30 amorphous structure. In the discussion,
ap-plicability of the developed interatomic potential for Zr36:3Ni63:7 amorphous structure was investigated. RDF of
Zr36:3Ni63:7 amorphous structure was not reproduced
accu-rately. In future, RDFs of other compositions than Zr70Ni30
[image:8.595.47.548.80.530.2]are going to be used for fitting.
Table 11 Defect formation energies of Zr-Ni defected structures used for fitting.
Defect Formation Energy,Edf/(eV/defect)
Original Crystals Stoichiometry defect type defected atom
EAM GGA
FCC-Zr3Ni Zr25Ni8 Octahedral Zr 4.575 6.114
FCC-Zr3Ni Zr25Ni8 Split Zr-Zr 4.346 5.143
FCC-Zr3Ni Zr25Ni8 Split Zr-Ni 2:192 1:761
FCC-Zr3Ni Zr24Ni9 Octahedral Ni 1.043 2.772
FCC-Zr3Ni Zr24Ni9 Split Ni-Zr 1.263 2.113
FCC-Zr3Ni Zr24Ni9 Split Ni-Ni 4:366 3:995
FCC-Zr2Ni2 Zr17Ni16 Octahedral Zr 2.670 3.321
FCC-Zr2Ni2 Zr17Ni16 Split Zr-Zr 2.710 2.513
FCC-Zr2Ni2 Zr17Ni16 Split Zr-Ni 2.639 3.178
FCC-Zr2Ni2 Zr16Ni17 Octahedral Ni 1.130 2.250
FCC-Zr2Ni2 Zr16Ni17 Split Ni-Zr 1.263 0.978
FCC-Zr2Ni2 Zr16Ni17 Split Ni-Ni 1.174 1.328
FCC-ZrNi3 Zr9Ni24 Octahedral Zr 0.167 0.219
FCC-ZrNi3 Zr9Ni24 Split Zr-Zr 3.206 7.072
FCC-ZrNi3 Zr9Ni24 Split Zr-Ni 0.161 0.232
FCC-ZrNi3 Zr8Ni25 Octahedral Ni 0.946 0.339
FCC-ZrNi3 Zr8Ni25 Split Ni-Zr 2.875 4.408
FCC-ZrNi3 Zr8Ni25 Split Ni-Ni 0.940 0.524
FCC-Zr3Ni Zr24Ni7 Mono Vac Ni 1.760 2.213
FCC-ZrNi3 Zr7Ni23 Mono Vac Zr 3.100 2.932
0 2 4 6 8 10 12
0 1 2 3 4 5 6 7 8
Radial Distribution Function, 2
π
2rρ
/Å
−
2
Radius, r/Å
EAM GEAM X− ray
Fig. 9 Radial distribution functions of Zr70Ni30 amorphous structures.
That of experimental data28)and that obtained using GEAM potential are
shown for comparison.
0 2 4 6 8 10
0 1 2 3 4 5 6 7 8
Radial Distribution Function 4
π
r
ρ
/Å
−
2
Radius, r/Å EAM GEAM X−ray
Fig. 10 Radial distribution functions of Zr36:3Ni63:7amorphous structure.
That of experimental data30)and that obtained using GEAM potential are
[image:8.595.47.549.85.529.2]Acknowledgement
One of the authors was supported through the 21st Century COE Program, ‘‘Mechanical Systems Innovation’’ by the Ministry of Education, Culture, Sports, Science and Tech-nology. I would like to express my gratitude Dr. Shimono at NIMS for his kind advice and encouragement.
REFERENCES
1) T. Masuomoto: Science of Machine40(1988) 210–214.
2) A. Inoue: Journal of Applied Physics, Japan671176–1180.
3) A. Inoue:Progress in Materials Science43(1988) 365–520.
4) M. Shimono and H. Onodera:Scripta Mater.44(2001) 1595–1598.
5) M. Shimono and H.Onodera:Materia Japan41(2002) 473–480.
6) M. Shimono and H. Onodera:Mater. Trans., JIM39(1998) 147–153.
7) T. Aihara, K. Aoki and T. Masumoto:Scripta Metall. Mater.28(1993)
1003–1008.
8) T. Aihara, K. Aoki and T. Masumoto:Mat. Sci. Eng. A179(1994) 256–
260.
9) T. Aihara, Y. Kawazoe and T. Masumoto: Mater. Trans., JIM36
(1996) 399–407.
10) T. Aihara, Y. Kawazoe and T. Masumoto: Mater. Trans., JIM36
(1996) 835–841.
11) T. Aihara, Y. Kawazoe and T. Masumoto:Mat. Sci. Eng. B37(1996)
201–204.
12) T. Aihara, Y. Kawazoe and T. Masumoto: J. Non-cryst. Solids37
(1996) 875–878.
13) C. Massobrio, V. Pontikins and G. Martin: Phys. Rev. B41(1990)
10486–10497.
14) X. W. Zhou, H. N. G. Wadley, R. A. Johnson, D. J. Larson, N. Tabat, A. Cerezo, A. K. Petford-Long, G. D. W. Smith, P. H. Clifton, R. L.
Martens and T. F. Kelly:Acta Mater.49(2001) 4005–4015.
15) X. W. Zhou, R. A. Johnson and H. N. G. Wadley:Phys. Rev. B69
(2004) 144113.
16) D. Nikkuni, T. Kumagai, S. Hara, S. Izumi and S. Sakai: The proceedings of the 11th Symposium on Molecular Dynamics Simu-lations, (2006) 16–19.
17) T. Kumagai, S. Hara, S. Izumi and S. Sakai:Modelling and Simulation
in Materials Science and Engineering14(2006) S.29–S.37.
18) Kalyanmoy Deb: Multi-Objective Optimization using Evolutionary
Algorithms, (Wiley, 2001).
19) R. A. Johnson:Phys. Rev. B39(1989) 12554–12559.
20) M. S. Daw and M. I. Baskes:Phys. Rev. B29(1984) 6443–6453.
21) Y. Mishin, D. Farkas, M. J. Mehl and D. A. Papaconstantopoulos:Phys.
Rev. B59(1999) 3393–3407.
22) A. E. Carlsson, K. F. Kelton and C. L. Henley:Phys. Rev. B71(2005)
144103.
23) T. Takeuchi, S. Nakano, M. Hasegawa, K. Soda, H. Sato, U. Mizutani,
K. Itoh and T. Fukunaga:Mater. Trans., JIM46(2005) 2791–2798.
24) G. Kresse and J. Hafner:Phys. Rev. B47(1993) 558–561.
25) G. Kresse and J. Furthmu¨ller:Phys. Rev. B54(1996) 11169–11186.
26) J. P. Perdew, K. Burke and M. Ernzerhof:Phys. Rev. Lett.77(1996)
3865–3868.
27) H. J. Monkhorst and J. D. Pack:Phys. Rev. B13(1976) 5188–5192.
28) K. Sakai, M. Sakurai, E. Matsubara, T. Ichitsubo, S. Obara and H.
Ohsumi:Abstracts of Spring Meeting of Japan Society of Powder and
Powder Metallurgy(2005), 42.
29) Yan Xu, W. B. Muir, Z. Altounian, W. J. L. Buyers and R. L.
Donaberger:Phys. Rev. B53(1996) 8983–8992.
30) J. C. de Lima, J. M. Tonnerre and D. Raoux:Journal of non-crystalline
solids106(1988) 38–41.
31) W. Hu, B. Zhang, B. Huang, F. Gao and D. J. Bacon: Journal of
Physics: Condensed Mater13(2001) 1193–1213.
32) C. Kittel:Introduction to Solid State Physics 7th edition, (John Wiley and Sons, Inc., New York, 1996).
33) G. Simmons and H. Wang: Single Crystal Elastic Constants and
Calculated Aggregate Properties., (Cambridge (MA), MIT Press, 1971).
34) W. Wycisk and M. Feller-Kniepmeier:Journal of Nuclear Materials
69–70(1978) 616–619.
Appendix
In order to be consistent with the experimental data, the material properties obtained from first principles calculations need to be converted.
Lattice constants obtained from first principles calcula-tions using the plane wave pseudopotential method employ-ing GGA tend to be overestimated. In order to cancel these overestimations, scaled lattice constants should be used for fitting. The scaling factor is determined so that the scaled lattice constant of the stable structure agrees with those of the experimental data.
Elastic properties of polytype structures except for the stable structure cannot be obtained from experimental data. However, the elastic properties obtained from first principles calculations sometimes deviated from those of the exper-imental data. Therefore, the scaled bulk modulus is employed for fitting. For a single component system, the bulk modulus of polytype used for fittingBfitpolycan be converted as
Bfitpoly¼BFPpolyB
Exp stable
BFP stable
ðA:1Þ
whereBExpstableindicates the experimental bulk modulus of the stable structure andBFP
polyandBFPstableindicate the bulk modulus
of the polytype structure and that of the stable structure obtained from first principles calculations, respectively.
Since the bulk moduli of binary systems used for fitting should be consistent with such scaled bulk moduli of single component systems, those obtained from first principles calculations should be scaled. For P-Q binary systems, the scaled bulk modulus of PxQy,BfitPxQy can be defined as,
BfitP
xQy ¼B FP PxQy
xBpotP þyBpotQ xBFP
P þyBFPQ
; ðA:2Þ
whereBpotP;ref andBpotQ;ref indicate the bulk moduli of P and Q obtained from the developed potential, respectively. BFP
PxQy,
BFP
P , andBFPQ indicate the bulk modulus of PxQy, P, and Q