Relation between the Solidi
fi
cation Condition and Volume Fraction
of Rod-Like Eutectic Cu
6Sn
5Phase in the Eutectic Structure in Sn-Cu Alloys
H. Esaka
+, J. Machida, Y. Takamatsu and K. Shinozuka
Department of Materials Science and Engineering, National Defense Academy, Yokosuka 239-8686, Japan
The Sn-Cu alloy is a typical rod-like eutectic system. The eutectic Cu6Sn5phase is a minor phase exhibiting a rod-like structure. The volume fraction of this eutectic Cu6Sn5(fECu6Sn5) is characterized as a function of copper content and growth velocity using an image analyzer. The volume fraction variation of the eutectic Cu6Sn5relative to copper content is classified into three regions depending on the solidified structure. In the primary¢-Sn+eutectic structure and primary Cu6Sn5+eutectic structure regions, thefECu6Sn5 increased with increasing growth velocity, independent of the copper content. These were qualitatively explained by the undercooling for the growth of both phases. On the other hand, in the eutectic structure region, thefECu6Sn5increased with copper content, independent of the growth velocity. The mechanism for the volume fraction change of the eutectic Cu6Sn5under this growth condition was discussed. In order to exhibit the eutectic structure even for the off-eutectic composition, the volume of eutectic Cu6Sn5was primarily altered by their changed rod diameters.
[doi:10.2320/matertrans.M2014427]
(Received December 1, 2014; Accepted February 2, 2015; Published April 25, 2015)
Keywords: eutectic alloy, lead-free solder, unidirectional solidification, lever rule, volume fraction, coupled zone
1. Introduction
There has been considerable research focused on the eutectic solidification structure. These eutectic microstruc-tures are classified into two groups, dependent upon the volume fraction of a minor phase, namely a lamellar eutectic or a rod eutectic structure.1) Even in the same alloy, the
eutectic structure is known to change from a rod to lamellar structure depending on the solidification conditions.2,3)When
the growth velocity was decreased, the rod structure changes to a lamellar configuration. Previous research has reported that the aspect ratio of eutectic Ag3Sn increased with
decreasing growth velocity in the unidirectional solidification of a Sn-Ag eutectic alloy.4) Furthermore, Cooksey et al.
reported that the rod structure changes to lamellar in the region of the eutectic cell’s boundary in the case of an impure eutectic system.5)Mollard and Flemings studied the eutectic structure in Sn-Pb alloys and noted a morphology change from lamellar to rod when the Pb content was increased.6,7) This change in morphology may be due to a volume change in the eutectic structure; however, they did not mention the mechanism in detail.
In this study, the relation between the solidification conditions and volume ratio of the minor phase in the eutectic region of Sn-Cu binary alloys has been examined. The main parameters for this include the copper content in the Sn-Cu alloys and the growth velocity of the unidirectional solidification process.
2. Experimental Procedure
The Sn-Cu alloys were prepared from pure Sn and Cu. The purity of both were 99.99 mass%. Alloys with varied copper contents were melted in an alumina crucible under an argon
flow. The molten metal was kept at 400°C for 1800 s and was sucked into a glass tube with a 4 mm inner diameter. The molten metal was rapidly solidified in the glass tube,
guaranteeing the solute content uniformity in the sample. These bars were the raw materials for the unidirectional solidification described below.
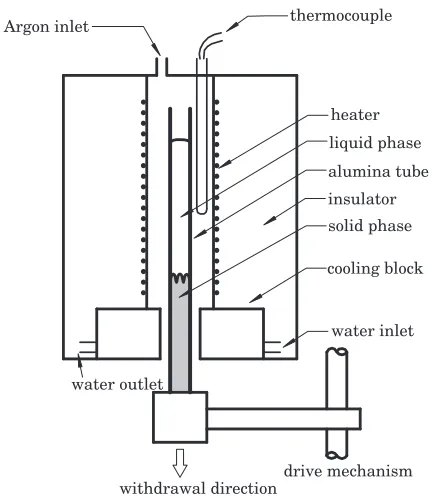
Figure 1 shows a schematic view of the unidirectional solidification apparatus. This is a typical Bridgman-type furnace, which was home-built, and it enables an independent control of the growth velocity and temperature gradient. The Ar gas was introduced from the top of the furnace to prevent oxidation of the sample.
The raw material was placed in an alumina tube, the outer and inner diameters of which were 8 mm and 5 mm, respectively. The temperature of the furnace was kept constant during the experiment, and measured by a chromel-alumel thermocouple in the middle of the furnace. The sample was drawn downwards at a pre-determined
water inlet Argon inlet thermocouple
alumina tube
water outlet
heater
insulator
drive mechanism withdrawal direction
cooling block solid phase liquid phase
Fig. 1 A schematic drawing of the unidirectional solidification apparatus.
[image:1.595.319.535.322.571.2]velocity. In this study, in order to ensure a steady state, the withdrawal length was fixed at 100 mm. The growth velocities used in this study ranged from 1.67 µm/s to 55.6 µm/s. The temperature gradient near the eutectic temperature was approximately 4.7©103K/m.
After the drawing process, the sample was dropped into a water bath to quench the solid-liquid interface. The alumina tube was intentionally crushed when the sample fell in order to increase the cooling rate. The solidified structure was then observed on the longitudinal and horizontal cross section. In this study, the horizontal cross section, which was located approximately 20 mm below the solid liquid interface, was primarily used for analyzing the eutectic structure. After polishing with an alumina slurry, the sample was further polished by colloidal silica. Then the sample was observed by an optical microscope and afield emission-scanning electron microscope (FE-SEM). The volume fraction of the eutectic Cu6Sn5was quantitatively analyzed using an image analyzer.
3. Experimental Results 3.1 Solidified structure
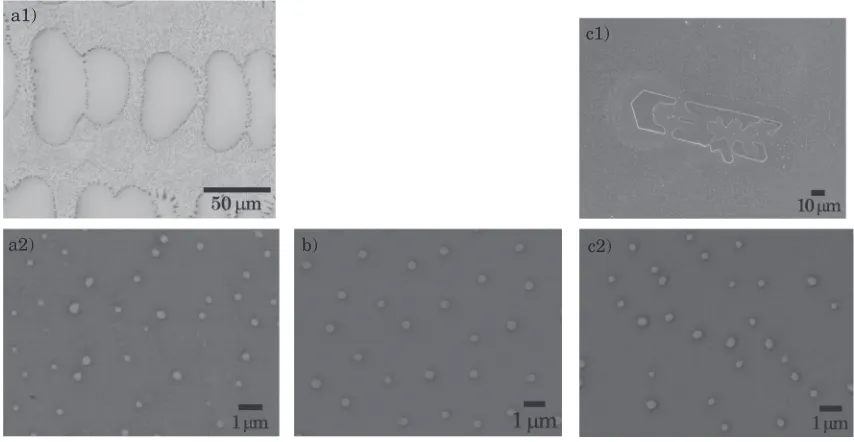
Figure 2 shows the typical horizontal cross sections of the three solidified structure alloys at a growth velocity of 55.6 µm/s. In the case of the Sn-0.61 mass% Cu alloy, the primary¢-Sn dendrites and interdendritic eutectic structures were observed in Fig. 2(a1). At the primary ¢-Sn periphery, the size of the eutectic Cu6Sn5structure was relatively large.
However, outside of this area, a uniform eutectic structure was observed. An enlarged view of the eutectic region is shown in Fig. 2(a2). The rod-like eutectic Cu6Sn5 were
dispersed within a matrix of eutectic¢-Sn.
In the case of the Sn-0.98 mass% Cu alloy, a eutectic structure without any primary crystals was seen in Fig. 2(b). Some angular primary Cu6Sn5 were found in the horizontal
cross section of the Sn-2.02 mass% Cu alloy as shown in Fig. 2(c1). The primary Cu6Sn5 occasionally exhibited an
H-shape or hexagonal-based hopper shape as shown in Fig. 2(c1). These primary facet crystals were surrounded by a
¢-Sn halo. Furthermore, the eutectic structure was observed outside this halo. The eutectic structures shown in Fig. 2 are
fine and exhibit afibrous eutectic Cu6Sn5dispersed in a¢-Sn
matrix. The distribution of this eutectic Cu6Sn5appears to be
random.
Enlarged views of the eutectic structure regions of horizontal cross sections are shown in Fig. 3. The growth velocity of these samples was 1.67 µm/s. In these samples, there was no primary phase, and it was considered that the growth conditions fell in the coupled zone, even if the composition was off-eutectic. The eutectic Cu6Sn5 was
dispersed in the eutectic¢-Sn matrix. In the case of the Sn-0.61 mass% Cu alloy, the eutectic Cu6Sn5 was rod-like and
randomly distributed. On the other hand, in the case of a higher Cu content (0.98 or 2.02 mass% Cu) some of the eutectic Cu6Sn5exhibited a plate-like structure, aligned in the
same direction as the observation range. It may be inferred that the eutectic Cu6Sn5 and ¢-Sn matrix have a specific,
preferred crystallographic orientation. The aspect ratio of the eutectic Cu6Sn5 was observed to increase with increasing
Cu content. Therefore, the volume fraction of the eutectic Cu6Sn5appeared to increase with increasing Cu content.
Figure 4 shows the eutectic structure of the Sn-0.98 mass% Cu alloy as a function of growth velocity (V). In these solidified structures, no primary phase was found, with all horizontal cross sections consisting of the eutectic structure. The rods of the eutectic Cu6Sn5were dispersed in the eutectic
¢-Sn matrix. The diameter of the eutectic Cu6Sn5 decreased
with increasing growth velocity. When the growth velocity was large (V=5.56 µm/s and 55.6 µm/s), the cross section
of the eutectic Cu6Sn5 revealed circular shapes, and these
were dispersed randomly in the matrix. In contrast, when the growth velocity was low (1.67 µm/s), the shape of the eutectic Cu6Sn5 was elongated and aligned unidirectionally
due to the surface tension anisotropy.
a1)
a2) b)
c1)
c2)
[image:2.595.84.511.71.292.2]3.2 Volume fraction of the eutectic Cu6Sn5
The volume fraction of the eutectic Cu6Sn5in the eutectic
region was quantitatively analyzed. The cross sections of the eutectic Cu6Sn5were carefully traced by hand, with their area
analyzed using an image analyzer. Following a predeter-mined method,8)a measurement area that included at least 20
rods of the eutectic Cu6Sn5was analyzed. Five measurements
were taken under the same experimental conditions with the average values used in this study. The volume fractions of the eutectic Cu6Sn5in the eutectic structure (fECu6Sn5) were then
investigated as a function of the copper content and growth velocity. The relationship between the copper content and the
fECu6Sn5 is classified into three groups depending on the
solidified structure. Previously, the evolution of the solidified structure in this alloy system was studied for its unidirec-tional solidification.9) Depending on the copper content and growth velocity, the solidified structure could be classified as the following three groups: (1) the primary ¢-Sn+eutectic region, (2) the eutectic region, and (3) the primary Cu6Sn5+eutectic region. Thus, thefECu6Sn5 change relative
to copper content was also classified according to the solidified structure.
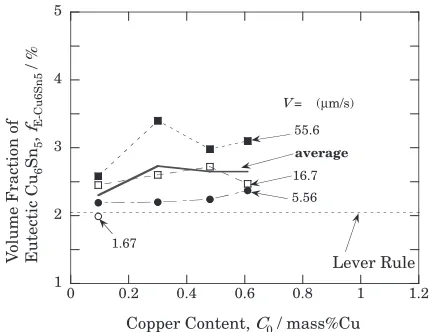
3.2.1 The primary ¢-Sn+eutectic region
In this solidification range, the relation between the initial copper content and the fECu6Sn5 is shown in Fig. 5. In this
figure, the volume fraction was estimated from the equi-librium phase diagram (2.05%), which is indicated by a dotted line.8) Almost all results were larger than the equilibrium value, and thefECu6Sn5appeared nearly constant
with respect to the copper content. This value purely depended upon the growth velocity. The relationship between the growth velocity andfECu6Sn5is shown in Fig. 6, with the
fECu6Sn5 increasing with increasingV.
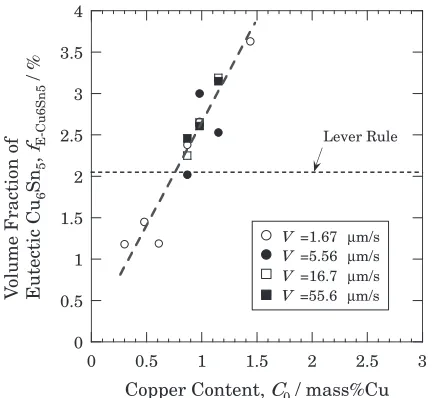
3.2.2 The eutectic region
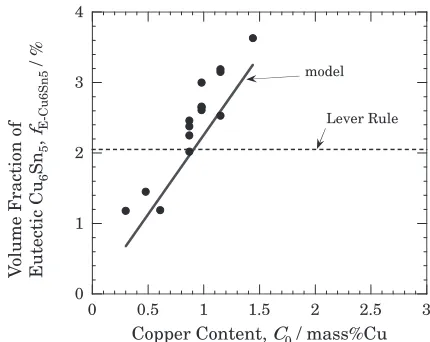
Figure 7 shows the relationship between the initial copper
content and the fECu6Sn5 when the eutectic structure appeared without any primary crystals. Here again, the estimated value from the equilibrium phase diagram is also indicated by a dotted line. For this condition, there was some scatter in the experimental data, although the fECu6Sn5 increased with increasing copper content. The linear regression is shown as the thick dotted line. The fECu6Sn5 was lower than the equilibrium value when the copper content was lower than the eutectic composition.
3.2.3 The primary Cu6Sn5+eutectic region
The relation between the copper content and fECu6Sn5 is
shown in Fig. 8. All experimental data were higher than the equilibrium value. Furthermore, there was some scatter in the experimental data, while the fECu6Sn5 was nearly constant when the growth velocity was fixed, regardless of copper content in this range of the experiment. Furthermore, the relationship between the growth velocity and fECu6Sn5 is
a) b) c)
Fig. 3 Horizontal cross section of unidirectionally solidified Sn-Cu alloy at growth velocity of 1.67 µm/s observed by a FE-SEM; (a)C0=0.61 mass%Cu, (b)C0=0.98 mass%Cu, (c)C0=2.02 mass%Cu.
a) b) c)
Fig. 4 Horizontal cross section of unidirectionally solidified Sn-0.98 mass%Cu alloy observed by a FE-SEM; (a) V=1.67 µm/s, (b)V=5.56 µm/s, (c)V=55.6 µm/s.
1 2 3 4 5
0 0.2 0.4 0.6 0.8 1 1.2
V
olume Fraction of
Eutectic Cu
6
Sn
5
,
fE-Cu6Sn5
/ %
Copper Content, C0 / mass%Cu Lever Rule
V = (μm/s)
1.67
5.56 16.7 55.6
average
[image:3.595.91.503.70.173.2] [image:3.595.92.505.217.318.2] [image:3.595.319.534.367.533.2]shown in Fig. 9. Again, there is some scatter; however, the
fECu6Sn5is seen as constant regardless of the growth velocity.
4. Discussion
The undercooling for the ¢-Sn formation is known to be large. It was recently found that the melt indicated a 1030° of undercooling before the formation of the ¢-Sn in the Sn-based alloy.1012)After nucleation, the temperature increased
to a value close to its liquidus temperature, indicating that the undercooling for ¢-Sn growth was small. In this study, the unidirectional solidification was adopted; therefore, this technique can eliminate the nucleation problem.
As previously explained, there were three typical solidified structures in this alloy system. In this section, the mechanism for the eutectic structure formation is discussed separately, depending on the typical solidified structure.
4.1 The primary¢-Sn+eutectic region
In this region, a primary ¢-Sn appeared as a dendrite
structure. The ¢-Sn rejects Cu in the liquid phase and the average copper content in the liquid increases as the solidification process progresses. Finally, when the copper content in the liquid, along with the temperature, reach the eutectic point, the eutectic solidification begins in the interdendritic region. Thus, the volume fraction of the eutectic Cu6Sn5may not depend on the initial copper content
if the undercooling of the eutectic growth can be neglected. As shown in Fig. 6, the fECu6Sn5 increased with the growth velocity. This may be due to the undercooling difference between the growth of the¢-Sn and Cu6Sn5in the
eutectic solidification. In general, the undercooling for the crystal growth increases with increasing growth velocity.13,14) This rule can be also applied to the eutectic growth. As indicated by Verhoeven, the undercooling for the growth of a facet phase is larger than that of non-facet phases.15)Thus, the growth temperature of the¢-Sn at a growth velocity ofV1
is lower than the equilibrium value, which is indicated by the thin dotted line in the phase diagram (Fig. 10). Here, the undercooling for the ¢-Sn growth is assumed independent of the copper content. Thus, this line is parallel to the¢-Sn liquidus line. In the same manner, the growth temperature of the Cu6Sn5at a growth velocity ofV1is shown in thisfigure.
1 1.5 2 2.5 3 3.5 4 4.5 5
1 10 100
V
olume Fraction of
Eutectic Cu
6
Sn
5
,
fE-Cu6Sn5
/ %
Growth Velocity, V / μms-1
C0= (mass%Cu)
Lever Rule 0.095 0.48
0.61 0.30
average
Fig. 6 Relation between growth velocity and volume fraction of eutectic Cu6Sn5in the primary¢-Sn+eutectic region.
0 0.5 1 1.5 2 2.5 3 3.5 4
0 0.5 1 1.5 2 2.5 3
V
olume Fraction of
Eutectic Cu
6
Sn
5
,
fE-Cu6Sn5
/ %
Copper Content, C0 / mass%Cu Lever Rule
V =1.67 μm/s V =5.56 μm/s V =16.7 μm/s V =55.6 μm/s
Fig. 7 Relation between copper content and volume fraction of eutectic Cu6Sn5in the eutectic region.
1 1.5 2 2.5 3 3.5 4
0 0.5 1 1.5 2 2.5 3 3.5
V
o
lume Fraction of
Eutectic Cu
6
Sn
5
,
fE-Cu6Sn5
/ %
Copper Content, C0 / mass%Cu
Lever Rule
55.6
5.56 16.7 V = (μm/s)
average
Fig. 8 Relation between copper content and volume fraction of eutectic Cu6Sn5in the primary Cu6Sn5+eutectic region.
1.5 2 2.5 3 3.5 4
1 10 100
V
olume Fraction of
Eutectic Cu
6
Sn
5
,
fE-Cu6Sn5
/ %
Growth Velocity, V / μms-1
Lever Rule
2.92 1.44
2.50 2.02 C0 = (mass%)
average
[image:4.595.63.277.67.251.2] [image:4.595.320.532.70.239.2] [image:4.595.320.534.294.460.2] [image:4.595.62.278.299.498.2]Again, here the undercooling for the Cu6Sn5 growth is
assumed to be independent of the copper content. Since the amount of undercooling for the Cu6Sn5growth may be larger
than the¢-Sn at the same growth velocity, the crossing point of both lines, which is similar to a quasi-eutectic point, shifts towards the direction of higher copper content and lower temperature, as shown by the thick arrows; this shift became significant when the growth velocity was high. The crossing point (EV1) may be the apparent eutectic point at the growth
velocity ofV1. As the copper concentrations in the¢-Sn and
Cu6Sn5 at T=T1 is equivalent to the ¢-Sn and Cu6Sn5 at T=Te, the volume fraction of the eutectic Cu6Sn5atT=T1
is then calculated using the lever rule. Thus, the eutectic Cu6Sn5 fraction may increase with increasing undercooling
or growth velocity. As a direct consequence of these results, thefECu6Sn5 increase with increasing growth velocity in the primary¢-Sn+eutectic region is reasonable.
4.2 The eutectic region (coupled zone)
4.2.1 Influence of copper content on the eutectic Cu6Sn5 volume fraction
When eutectic structures are obtained, even for an off-eutectic composition, the fractions of both phases can be estimated by the lever rule. According to this idea, at any composition, it will be a quasi-eutectic point, which is schematically indicated in Fig. 11. If the composition of the alloy isCA, the volume fraction of the Cu6Sn5in the eutectic
structure can be obtained as OA
OC, assuming that the¢-Sn and Cu6Sn5phases are independent of the initial copper content,
whereOA andOCare defined in Fig. 11.
According to this alloy’s equilibrium phase diagram in the literature,16) the copper content in the ¢-Sn at the eutectic temperature is regarded as zero. Thus, the mass ratio of Cu6Sn5 (xCu6Sn5) is simply expressed by the following
equation:
xCu6Sn5¼
Initial copper contentðmass%Þ
Copper content in Cu6Sn5 ðmass%Þ ð1Þ The final volume fraction of the eutectic Cu6Sn5 can be
obtained using the densities of the ¢-Sn and Cu6Sn5, µ¢-Sn and µCu6Sn5, respectively, according to the following eq. (2):
fECu6Sn5¼
µ¢-SnxCu6Sn5
ðµ¢-SnµCu6Sn5ÞxCu6Sn5þµCu6Sn5 ð2Þ
Here, the copper content in Cu6Sn5 is 39.1 mass% Cu and
the densities of ¢-Sn and Cu6Sn5 at room temperature are
reported as 7.3©103kg/m3 and 8.3©103kg/m3,
respec-tively.17,18)Neglecting the volume expansion coefficient, the
relation between the initial composition (C0) and volume
fraction of the eutectic Cu6Sn5at the eutectic temperature can
be obtained by the following equation:
fECu6Sn5¼
7:3C0
324:5C0 ð3Þ
The solid line in Fig. 12 shows the relationship between the copper content and thefECu6Sn5, along with the experimental
data. The experimental results are slightly higher, but the slope of the line respective to the copper content is in agreement with the estimated value. Strictly speaking, the density of the Cu6Sn5 is uncertain because Bornemann and
Sauerwald measured Sn-Cu alloy densities but did not measure the intermetallic compound density.18)Furthermore,
the thermal expansion coefficient of Cu6Sn5is not reported.
Considering these uncertainties, the eutectic Cu6Sn5volume
V =V1
T1 TE
C1 CE
Cu Sn
T
emperature
V =V1
EV1
V =V1
T1 TE
C1 CE
Cu Sn
T
emperature
V =V1
[image:5.595.63.277.69.236.2]EV1
Fig. 10 Concept of growth temperature in non-facet®facet eutectic system as a function of growth velocity. Note that it is assumed that the growth temperatures do not depend upon the copper content.
β-Sn+Cu6Sn5
T
emperature
L
CA CE
Cu Sn
A
Cu6Sn5
E C
L+Cu
L+β-Sn
6Sn5
O
Fig. 11 Estimation of volume fraction of eutectic Cu6Sn5in the coupled zone.CAis the composition of off-eutectic but it is assumed to exhibit eutectic structure.
0 1 2 3 4
0 0.5 1 1.5 2 2.5 3
V
olume Fraction of
Eutectic Cu
6
Sn
5
,
fE-Cu6Sn5
/ %
Copper Content, C0 / mass%Cu
[image:5.595.318.535.72.228.2]Lever Rule model
[image:5.595.318.533.285.456.2]fraction can therefore be estimated by the lever rule in the coupled zone.
4.2.2 Mechanism for the eutectic Cu6Sn5 volume frac-tion change
As mentioned previously, the volume fraction of the eutectic Cu6Sn5 increases with increasing Cu content in the
eutectic region. Here, the mechanism for this volume fraction change in the eutectic Cu6Sn5 relative to copper content is
discussed. To increase the volume fraction of the rod-like eutectic Cu6Sn5 in an eutectic structure with increasing
copper content, there may be two possibilities at a constant growth velocity. The first possibility is that the number of eutectic Cu6Sn5per unit area increased without changing the
fibrous Cu6Sn5 diameter, i.e., the eutectic Cu6Sn5 spacing
decreased as the copper content increased. The second possibility is that the eutectic Cu6Sn5 diameter increased
without changing the number of eutectic Cu6Sn5 per unit
area.
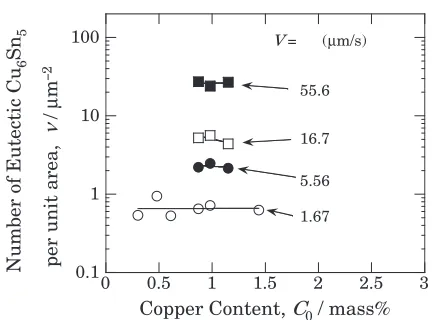
To confirm these two possible options, the number and diameter of the eutectic Cu6Sn5 were characterized. The
relation between the copper content and number of eutectic Cu6Sn5per unit area (=¯) is shown in Fig. 13. This indicates
that the number of eutectic Cu6Sn5 depend on the growth
[image:6.595.61.278.65.225.2]velocity, but their number is almost constant with respect to the copper content. The relation between the growth velocity and number of eutectic Cu6Sn5 per unit area is shown in
Fig. 14. This indicates that the number of eutectic Cu6Sn5
can be expressed by the growth velocity without using the copper content and their number is proportional toV1.0, i.e.,
the inter-rod spacing is proportional to V0.5. This functional
relation to the growth velocity is consistent with the literature data on the eutectic structure spacing.1,19,20)
Figure 15 shows the relationship between the copper content and diameter of the rod-like eutectic Cu6Sn5. Here,
the equivalent circle diameters were characterized. The experimental data has some scatter, but the diameter of the eutectic Cu6Sn5was found to increase with increasing copper
content. The relationship between growth velocity and eutectic Cu6Sn5 diameter is shown in Fig. 16. Here, the
diameter of the eutectic Cu6Sn5 decreases with increasing
growth velocity. Essentially, the diameter of the eutectic Cu6Sn5 is proportional to V¹0.5, in agreement with the
0.1 1 10 100
0 0.5 1 1.5 2 2.5 3
Number of Eutectic Cu
6
Sn
5
per unit area,
ν
/
μ
m
2
Copper Content, C0 / mass% V = (μm/s)
55.6
16.7
5.56
1.67
Fig. 13 Relationship between copper content and number of eutectic Cu6Sn5per unit area in the eutectic region.
0.1 1 10 100
1 10 100
= 0.30 mass%Cu = 0.48 mass%Cu = 0.61 mass%Cu = 0.87 mass%Cu = 0.98 mass%Cu = 1.15 mass%Cu = 1.44 mass%Cu
Number of Eutectic Cu
6
Sn
5
per unit area,
ν
/
μ
m
-2
Growth Velocity, V / μms-1 slope: 1.0
C0
C0
C0
C0
C0
C0
[image:6.595.316.538.69.264.2] [image:6.595.319.532.327.509.2]C0
Fig. 14 Relation between growth velocity and number of eutectic Cu6Sn5 per unit area in the eutectic region.
0 0.5 1 1.5 2 2.5 3
0 0.5 1 1.5 2 2.5
Diameter of Eutectic Cu
6
Sn
5
d
/
μ
m
,
Copper Content, C0 / mass%
V = (μm/s)
1.67
5.56
16.7
55.6
Fig. 15 Relationship between copper content and diameter of eutectic Cu6Sn5in the eutectic region.
0.1 1 10
1 10 100
=0.30 mass% Cu =0.48 mass% Cu =0.61 mass% Cu =0.87 mass% Cu =0.98 mass% Cu =1.15 mass% Cu =1.44 mass% Cu
Diameter of Eutectic Cu
6
Sn
5
,
d
/
μ
m
Growth Velocity, V / μms-1 C0
C0 C0 C0
C0 C0 C0
slope: -0.5
[image:6.595.318.532.575.760.2]experimental results obtained for the Sn-0.9 mass%Cu alloy reported by Grugel and Brush.21) These data indicate that the eutectic Cu6Sn5 diameter can be expressed by both the
growth velocity and the copper content.
Therefore, in the case of a constant growth velocity, the number of eutectic Cu6Sn5 per unit area did not depend on
the initial copper content, but the eutectic Cu6Sn5 diameter
was dependent on the copper content. The reason for the increased eutectic Cu6Sn5 diameter with increasing Cu
content can be described below.
Under the eutectic growth conditions, the lateral diffusion of the solute is a primary mechanism,1)because the¡and ¢
phases grow side by side. Thus, the diffusion in the lateral direction is vital. A schematic of the Cu distribution near the eutectic interface is shown in Fig. 17. Here, two cases are indicated, with line (a), represented by a solid line, showing the Cu content along the A-AAin the low Cu content case. In contrast, line (b), represented by a broken line, shows the same in the high Cu content case. Since the Cu solubility in
¢-Sn is actually zero, Cu is rejected as the eutectic ¢-Sn growth proceeds. The amount of Cu buildup near the eutectic interface is high when the Cu content is high. Therefore, the Cu lateral flux is large when the initial Cu content is high, as the Cu gradient near the eutectic interface is steep, as indicated on the right hand side of Fig. 17. Thus, the lateral growth of the eutectic Cu6Sn5 is increased, resulting in the
growth of the rod-like Cu6Sn5diameter.
On the other hand, the influence of the growth velocity on the eutectic Cu6Sn5 diameter may be considered as follows:
the copper flux from the liquid phase to the eutectic Cu6Sn5
increased with decreasing growth velocity because the time needed for diffusion increased. However, this effect does not depend on the Cu content. Thus, to change the eutectic Cu6Sn5volume fraction, the diameter of the rod-like eutectic
Cu6Sn5will change according to the Cu content.
4.3 The primary Cu6Sn5+eutectic region
As some researchers have indicated, when a primary phase is a facet, a non-facet phase sometimes appears as a halo around the primary facet phase.2224) The Sn-Cu alloy is
a typical facet/non-facet system, and halos of ¢-Sn were usually found around the primary Cu6Sn5. A typical example
observed in the horizontal cross section of a Sn-2.02 mass% Cu alloy at a growth velocity of 55.6 µm/s is shown in Fig. 2(c). Under the unidirectional solidification condition, the residual liquid should be the eutectic composition after the growth of the primary Cu6Sn5. However, the primary
Cu6Sn5 rejects Sn during growth, increasing the amount
of rejected Sn near the primary Cu6Sn5. Then, the ¢-Sn
nucleates on the primary Cu6Sn5, growing as a halo. As this
halo formation is a non-equilibrium process, the average copper composition in the liquid after halo formation increased higher than the equilibrium eutectic composition. Thus, to adjust the composition change in the liquid, the eutectic Cu6Sn5 volume fraction may then shift from the
equilibrium value. Since the copper content is higher than the eutectic value, the volume fraction became higher than the equilibrium one.
It has been reported that the halo fraction increased with increasing solute content in case of hyper-eutectic alloy.23,24) Furthermore, halo fraction slightly increased with increasing the growth velocity. According to these results, the residual liquid composition after the halo formation may increase with increasing Cu content and growth velocity. Thus, it may be deduced thatfECu6Sn5may increase with increasingC0andV.
However, in the range of present study, such a tendency was not observed as shown in Figs. 8 and 9. These should be investigated in future.
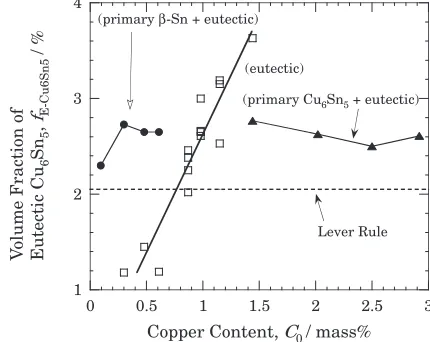
4.4 Volume fraction change of the eutectic Cu6Sn5 relative to copper content
In the course of this study, the volume fraction of the eutectic Cu6Sn5 did not depend on the growth velocity but
did depend on the copper content. This finding is important for understanding the solidified structure in eutectic systems. The growth velocity is a very important factor for determin-ing the solidified structure, such as the primary phase formation or determining the coupled zone. Since the effect of copper composition on the solidified structure is important, the average volume fraction with respect to the growth velocity is shown in Fig. 18. Here, the data are classified according to the solidified structure, namely, the primary¢ -Sn+eutectic, the eutectic, and the primary Cu6Sn5+
eutec-A A’
C1 C2
Flux j1
Eutectic
Eutectic β-Sn Interface
Eutectic Cu6Sn5 Liquid
(a) (b)
[image:7.595.317.532.74.245.2]CL
Fig. 17 A schematic drawing of copper content in the liquid near the eutectic solid/liquid interface along A-AAat a constant growth velocity as a function of initial copper content; (a) low Cu content and (b) high Cu content. Note that the solutal gradient is steep and soluteflux (arrows) is large in case of higher solute content.
1 2 3
0 0.5 1 1.5 2 2.5 3
V
o
lume Fraction of
Eutectic Cu
6
Sn
5
,
fE-Cu6Sn5
/ %
Copper Content, C0 / mass%
(primary β-Sn + eutectic)
(primary Cu6Sn5 + eutectic)
(eutectic)
[image:7.595.57.286.78.197.2]Lever Rule
tic regions. In the case of the primary¢-Sn+eutectic region, thefECu6Sn5is larger than the equilibrium value and is nearly constant with respect to copper content. In this region, the
fECu6Sn5 increased with increasing growth velocity. This is
because of the undercooling difference for the growth of¢-Sn and Cu6Sn5. In the case of the coupled zone, the fECu6Sn5
increased with increasing copper content. This change is attributed to the increased diameter of the eutectic Cu6Sn5.
For the primary Cu6Sn5+eutectic region, the fECu6Sn5 is
larger than the equilibrium value and is almost constant with respect to both the copper content and growth velocity. This is due to the formation of a halo around the primary Cu6Sn5.
5. Conclusions
Using Sn-Cu alloys, the relationship between the volume fraction of rod-like, eutectic Cu6Sn5 and the solidification
conditions was investigated.
(1) The variation of the eutectic Cu6Sn5 volume fraction
(fECu6Sn5) relative to copper content is classified into three regions, according to the solidified structure. (2) In the primary ¢-Sn and eutectic region, the fECu6Sn5
increased with increasing growth velocity, but remained constant with respect to the copper content. This is due to the undercooling difference for growth of non-facet (¢-Sn) and facet (Cu6Sn5) phases.
(3) In the eutectic region or coupled growth region, the
fECu6Sn5 increased linearly with increasing copper
content. The mechanism for this was explained as the eutectic Cu6Sn5 diameter increased with increasing
copper content without changing the density of rod-like Cu6Sn5.
(4) In the primary Cu6Sn5and eutectic region, thefECu6Sn5
was higher than the equilibrium value and remained constant with respect to the copper content and growth velocity. The¢-Sn appears on the primary Cu6Sn5as a
halo, increasing the copper content in the residual liquid phase.
REFERENCES
1) W. Kurz and D. J. Fisher:Fundamentals of Solidification, (Trans Tech Publication, Aedermannsdorf, 1992) pp. 93115.
2) D. Jaffrey and G. A. Chadwick: Trans. Metall. Soc. AIME245(1969) 24352440.
3) W. Kurz and B. Lux:Metall. Trans.2(1971) 329331.
4) H. Esaka, K. Shinozuka and M. Tamura:Mater. Trans.46(2005) 916 921.
5) D. J. S. Cooksey, D. Munson, M. P. Wilkinson and A. Hellawell:
Philos. Mag.10(1964) 745769.
6) F. R. Mollard and M. C. Flemings: Trans. Met. Soc. AIME239(1967) 15261533.
7) F. R. Mollard and M. C. Flemings: Trans. Met. Soc. AIME239(1967) 15341546.
8) H. Esaka, J. Machida and K. Shinozuka:Mater. Trans.56(2015) 703 706.
9) J. Machida, H. Esaka, M. Tamura and K. Shinozuka:J. Japan Inst.
Metals70(2006) 7379.
10) Y. Miyauchi, H. Esaka, M. Tamura and K. Shinozuka:J. Japan Inst.
Metals72(2008) 804811.
11) Y. Miyauchi, H. Esaka and K. Shinozuka:J. Japan Inst. Metals 73
(2009) 732741.
12) Y. Takamatsu, H. Esaka and K. Shinozuka:J. Japan Inst. Metals74
(2010) 101109.
13) R. Trivedi:J. Cryst. Growth49(1980) 219232.
14) W. Kurz and D. J. Fisher:Acta Metall.29(1981) 1120.
15) J. D. Verhoeven:Fundamentals of Physical Metallurgy, (John Wiley & Sons Inc., New York, 1975) pp. 264279.
16) T. B. Massalski:Binary Alloy Phase Diagrams, (American Society for Metals, Metals Park, Ohio, 1990) p. 965.
17) R. C. Weast:CRC Handbook of Chemistry and Physics, 70th ed., (CRC Press, Boca Raton, 1989) p. B-139.
18) K. Bornemann and F. Sauerwald: Z. Metallk.14(1922) 145159. 19) D. J. Fisher and W. Kurz:Acta Metall.28(1980) 777794.
20) W. Kurz and D. J. Fisher: Int. Metals Rev.24(1979) 177204. 21) R. N. Grugel and L. N. Brush:Mater. Charact.38(1997) 211216.
22) B. E. Sundquist, R. Bruscato and L. F. Mondolfo: J. Inst. Metals91
(1962) 204208.
23) R. S. Barclay, P. Niessen and H. W. Kerr:J. Cryst. Growth20(1973)
175182.
24) M.-J. Suk, G.-H. Choi and I.-H. Moon:J. Cryst. Growth123(1992)