Hardness and Wear Properties of Ti-Mo-C-N Film
+1Toshiaki Toyoda
1,+2, Yuji Sutou
1, Shoko Komiyama
1, Daisuke Ando
1, Junichi Koike
1and Mei Wang
2 1Department of Materials Science, Graduate School of Engineering, Tohoku University, Sendai 980-8579, Japan2OSG Corporation, Toyokawa 442-8544, Japan
The hardness and wear properties of Ti-Mo-C-Nfilms were investigated by nanoindentation and ball-on-disc measurements, respectively. Ti-Mo-C-Nfilms were deposited onto a stainless steel substrate by a reactive RF magnetron sputtering in the mixture of argon (7.5 ccm) and nitrogen (06.0 ccm) gases using Ti25Mo25C50target. Ti-Mo-Cfilm deposited without nitrogen gasflow showed a hardness of 34.8 GPa. The
hardness drastically decreased with increasing nitrogen gasflow rate (fN2) and reached to a minimum hardness of 16.4 GPa atfN2¼2:0ccm.
Contrarily, at overfN2¼3:0ccm, the hardness drastically increased with increasingfN2 and reached a maximal value of 32 GPa, and then
slightly decreased again with further increase offN2. It was found by TEM observation that the drastic decrease in hardness is caused by the
formation of nanocrystalline microstructure, while the increase in hardness is due to the microstructural change from nanocrystalline to columnar structure. The friction coefficient decreased with increasingfN2and thefilm deposited atfN2¼5:0ccm showed a minimum value of 0.27. The
simple oxidation test in air indicated that lubricious MoO3is easy to be formed in thefilm deposited at a highfN2, which should cause the
reduction of friction coefficient. [doi:10.2320/matertrans.M2015383]
(Received October 8, 2015; Accepted December 25, 2015; Published February 25, 2016)
Keywords: titanium-molybdenum-carbonitride, hardness, friction coefficient, wear resistance
1. Introduction
Ti-N film has been widely used as a wear resistance coating for cutting tools and medical devices because of its high hardness (³25 GPa), good oxidation resistance and corrosion resistance. The coating properties of Ti-Nfilm can be enhanced by an additional element X, such as Al,1,2)Si,3) Cr4,5) and B.68) These Ti-X-N coatings show much better oxidation resistance and high thermal stability than Ti-N coating. Moreover, these coatings have a high hardness of over 30 GPa because of solid solution strengthening by X elements or because of the formation of a nanocomposite structure composed of nano-crystalline and amorphous phases. Especially, nanocomposite coatings exhibit an extremely high hardness of about 50 GPa depending on the microstructure.9) However, these Ti-X-N coatings show a high friction coefficient (³0.6) and, consequently, show poor wear resistance depending on operating conditions.
Alternatively, Ti-C-N films are known to show a lower friction coefficient of about 0.3 as compared with Ti-N coatings.10,11)However, Ti-C-N coatings show poor adhesive wear resistance depending on counterpart materials and operating conditions.12)Mo-added coatings are also known to show a lower friction coefficient. For example, Cr2O3 film with added Mo shows a lower friction coefficient and a smaller wear rate than pure Cr2O3 film.13) Moreover, it has been reported that Ti-Mo-Nfilms show good wear properties, although the films have a lower hardness than other Ti-X-N coatings.14) It has also been demonstrated that the wear properties of Ti-Mo-N film depend on N content and the friction coefficient decreases with increasing N content. This improvement of friction coefficient in Ti-Mo-Nfilm with a high N content is due to the formation of lubricious Mo oxide by wear oxidation.15) Moreover, Ti-Mo-N film with a high N content has been formed to show good adhesive wear
resistance against carbon steel such as S45C.12,16,17) There-fore, it is expected that simultaneous improvements of hardness, friction coefficient and adhesive wear resistance can be realized by the addition of Mo to Ti-C-N and also by controlling the N content in Ti-Mo-C-N.
Therefore, the purpose of this study was to investigate the hardness and wear properties of Ti-Mo-C-N film deposited using reactive RF magnetron sputtering of a Ti25Mo25C50 target under various nitrogen gasflow rates.
2. Experimental
Ti-Mo-C-Nfilms were deposited on mirror-polished plates of AISI 304 stainless steel by reactive RF magnetron sputtering at room temperature, using a Ti25Mo25C50 target. A gas mixture of argon and nitrogen was introduced at afixed argon gas flow rate of 7.5 ccm and a variable nitrogen gas
flow rate (fN2) from 0 to 6.0 ccm. RF power for sputtering
deposition was 100 W. The sputtered film thickness was more than 1.0 µm. In this study, Ti30Mo28N42 film was also prepared by reactive RF sputtering for comparison.15)
The hardness was measured by a nanoindentation system (Hysitron Inc., Triboindenter, MN) using a Berkovich indenter. The load was controlled so that the contact depth was kept less than 10 percent of thefilm thickness.
Wear properties were measured by a ball-on-disc testing system (FRP-2100) at room temperature. The test was carried out under a load of 500 gf at a sliding speed of 23.55 mm/s. A stainless steel ball (SUS304 with a diameter of 4.96 mm) was used as a counterpart, and the total sliding distance was 14130 mm. The friction coefficient of thefilm was calculated by taking an average value of the total sliding distance. The adhesion strength between the film and the substrate was measured by a scratch testing system (CSR-2000). The test was carried out using a diamond stylus with a tip curvature radius of 5 µm. The scratching speed was 5 µm/s and the load at the end of measurement was 180 mN. The critical load for adhesion was defined as the load value when film delamination occurred. The oxidation behavior of the
Ti-Mo-+1This Paper was Originally Published in Japanese in J. Japan Inst. Met.
Mater.79(2015) 220226.
+2Graduate Student, Tohoku University
C-Nfilm was investigated by performing oxidation testing at 500°C for 30 minutes in air.
The chemical composition of the film was measured with auger electron spectroscopy (AES). Ti, Mo, C and N contents were determined quantitatively by a relative sensitivity coefficient method using TiC, TiMo and TiN as reference standards. The constituent phases of the obtained Ti-Mo-C-N
films were examined by conventionalª2ªX-ray diffraction (XRD) using Cu-K¡ radiation. The microstructure was observed with a transmission electron microscope (TEM). Cross-sectional TEM samples were prepared using a focused ion beam system (FIB).
Wear tracks on the film surface after ball-on-disc testing were observed with a scanning electron microscope (SEM). The composition of wear debris was analyzed with an energy dispersive X-ray spectrometer (EDX) attached to SEM.
3. Results
3.1 Effect of fN2 on hardness and crystal structure of Ti-Mo-C-Nfilm
Figure 1 shows the Ti, Mo, C and N contents of the Ti-Mo-C-Nfilm as a function of the nitrogen gasflow rate (fN2).
While the C content decreases with increasing fN2, the
Mo and Ti contents increase. The composition of the film deposited at fN2 ¼0ccm is Ti15Mo14C71 and the ratio of metal (M) and non-metal (n-M) elements is 0.41, while the composition of the film deposited at fN2 ¼5:0ccm is Ti23Mo30C32N15 and the M/n-M is 1.13 which is much higher than that of the film deposited at fN2 ¼0ccm. Figure 2 shows the hardness (H) and the effective Young’s modulus (E*) of the Ti-Mo-C-Nfilms as a function offN2. TheE*is expressed asEs=ð1¯s2Þ, whereEsand¯sare the Young’s modulus and the Poisson’s ratio of the Ti-Mo-C-N
film, respectively. The E* can be estimated from reduced modulus Er which can be measured with a nanoindentation system. TheEr is expressed by the following equation:
1
Er ¼
1¯2 s
Es þ
1¯2 i
Ei ; ð1Þ
whereEiand¯iare the elastic modulus and the Poisson’s ratio of the indenter, respectively. The values of Ei and ¯i of the indenter used in this study were 1140 GPa and 0.07, respectively. The Hof the Ti-Mo-C film deposited without nitrogen gasflow is about 35 GPa. With increasingfN2, the
H drastically decreases and the minimum H of 16 GPa is obtained atfN2¼2:0ccm. Meanwhile, in the range offN2>
2:0ccm, the H starts to increase with increasing fN2 and reaches the maximum Hof about 32 GPa atfN2¼4:0ccm. With further increasingfN2, theHslightly decreases. TheE*
as a function of fN2 shows a similar behavior to that ofH.
Namely, the E* increases in the range of 2.0 ccm<fN2¯
4.0 ccm with increasingfN2, and then slightly decreases with
further increasingfN2.
Figure 3 shows XRD patterns of the films deposited at fN2 ¼0, 0.5, 3.0, 5.0 and 6.0 ccm. In thefilm deposited at
fN2 ¼0ccm, the 111 peak of ¤-(Ti, Mo)C phase with NaCl
structure is observed as a main peak. In addition, a small peak at around 32° corresponds to 001 of MoC phase. Meanwhile, in the film deposited at fN2 ¼0:5ccm, the intensity of the
111¤peak drastically weakens and the MoC peak disappears. In the film deposited at fN23:0ccm, the intensity of the 220¤peak becomes strong.
0 10 20 30 40 50 60 70 80
0 1 2 3 4 5 6
Com
p
osition /
at%
fN2/ ccm
Ti Mo C N
Fig. 1 Chemical composition of the Ti-Mo-C-Nfilms deposited at various N2flow rates (fN2).
150 200 250 300 350 400
0 5 10 15 20 25 30 35 40
0 1 2 3 4 5 6
E
*/G
P
a
Hardness,
H
/G
P
a
fN2/ ccm
Fig. 2 Nitrogenflow rates (fN2) dependence of hardness andE*in the Ti-Mo-C-Nfilms.
Intensity / (a.u.)
Diffraction angle, 2θ / 㼻
111
δ
200
δ
220
δ
Subst
rat
e
Subst
rat
e
(e)
(d)
(a) (c)
(b)
20㼻 30㼻 40㼻 50㼻 60㼻
Fig. 3 X-ray diffraction patterns of the Ti-Mo-C-N films deposited at various N2flow rate of (a)fN2¼0ccm, (b)fN2¼0:5ccm, (c)fN2¼
[image:2.595.323.530.70.229.2] [image:2.595.323.526.281.430.2] [image:2.595.322.531.482.690.2]3.2 Cross-sectional observation by TEM
TEM observation of the Ti-Mo-Cfilm, though not shown here, indicated the formation of columnar grains. By introducing N to Ti-Mo-C film, the microstructure was changed, as shown in the following. Figure 4(a) shows a cross-sectional TEM image of the Ti-Mo-C-Nfilm deposited at fN2¼0:5ccm, showing a drastic decrease in hardness. It is seen that the film has a very fine equiaxed grain microstructure with the grain size less than approximately 5 nm. Figure 4(b) shows the diffraction pattern obtained from Fig. 4(a). The ring pattern indicates the formation of fine grains and reveals that the film has an NaCl structure. This result is in a good agreement with the XRD result. Figure 5(a) shows a cross-sectional TEM image of the Ti-Mo-C-N film deposited at fN2 ¼5:0ccm, showing a high hardness of about 30 GPa. It is seen that the film has a columnar grain microstructure as observed in Ti-Mo-Cfilm. Figure 5(b) shows the diffraction pattern obtained from Fig. 5(a). The diffraction pattern indicates that thefilm has a ¤-(Ti, Mo)CN phase with an NaCl structure, which corre-sponds to the XRD result. From the obtained results, it was found that the Ti-Mo-C-N film shows a very fine equiaxed grain microstructure in the range of 0 ccm<fN2¯3.0 ccm
and that the microstructure changes into a columnar grain microstructure with further increasing fN2.
3.3 Effect of fN2 on the wear properties of Ti-Mo-C-N
film
Figure 6 shows the friction coefficient of the films deposited at fN2 ¼0, 2.0 and 5.0 ccm as a function of sliding distance. The friction coefficient of the Ti-Mo-Cfilm
deposited at fN2¼0ccm monotonically increases with increasing sliding distance in the initial region and then becomes steady state. Meanwhile, the friction coefficient of the film deposited at fN2¼2:0 and 5.0 ccm shows a high
value in the initial region. After that, however, the friction coefficient gradually decreases with increasing sliding distance and then becomes steady state. Moreover, it is seen that the friction coefficient of the film in the latter sliding region decreases with increasing fN2. Figure 7 shows the average friction coefficient,®ave, of thefilm as a function of fN2. The®ave of the Ti-Mo-Cfilm deposited atfN2¼0ccm
is 0.46. Although the ®ave slightly increases in the film deposited atfN2¼0:5ccm, the ®avedecreases with increas-ingfN2in the region offN21:0ccm. Thefilm deposited at fN2 ¼5:0ccm shows the lowest value of 0.27. However,
with further increasingfN2, the®avedrastically increases. In a separate experiment the®aveof the Ti-Mo-Nfilm obtained by the same testing condition was formed and showed a high value of 0.48 that is nearly the same as that of the Ti-Mo-C
film. This indicates that in Ti-Mo-based ceramic coating, carbonitrization is very effective to decrease the friction coefficient against its stainless steel counterpart.
Figure 8(a)(d) shows SEM images of wear tracks on the surfaces of the Ti-Mo-C-Nfilms. The wear track of thefilm deposited at fN2¼0, 3.0 and 5.0 ccm shows a smooth surface and no adhesion from its SUS304 counterpart is
111δ
222δ
311δ
220δ
200δ
(b) (a)
Fig. 4 (a) Cross-sectional TEM image of the Ti-Mo-C-Nfilm deposited at fN2¼0:5ccm. (b) Selected area diffraction pattern taken from (a).
(a)
111δ
222δ
311δ
220δ
200δ
(b)
100 nm
Fig. 5 (a) Cross-sectional TEM image of the Ti-Mo-C-Nfilm deposited at fN2¼5:0ccm. (b) Selected area diffraction pattern taken from (a).
0 0.1 0.2 0.3 0.4 0.5 0.6 0.7 0.8
0 2 4 6 8 10 12 14
m
ean
F
riction
coef
fi
cien
t,
μ
Distance, d/ m
Fig. 6 Variation of friction coefficient as a function of sliding distance in the Ti-Mo-C-Nfilms deposited atfN2¼0, 2.0 and 5.0 ccm.
0 0.1 0.2 0.3 0.4 0.5 0.6 0.7
0 1 2 3 4 5 6
F
riction
coef
fi
cien
t,
μ
fN2/ ccm
Fig. 7 Nitrogenflow rates (fN2) dependence of friction coefficient (®) in
observed. Moreover, there is a large amount of wear debris beside the wear track. Figure 8(e) shows the EDX spectrum obtained from wear debris in the film deposited at fN2¼
5:0ccm. From the EDX analysis, strong Mo, Ti and O peaks are detected together with a small amount of Fe and Ni peaks arising from counterparts of SUS304. Therefore, the wear debris is suggested to be mainly composed of Mo and Ti oxides. On the other hand, the surface of the wear track at fN2 ¼6:0ccm is very rough and it was confirmed by
composition analysis that a strong Fe peak is observed on the wear track. These results indicate that the delamination of the film takes place by wearing of the film deposited at fN2 ¼6:0ccm. Figure 9 shows the adhesion strength of the
Ti-Mo-C-Nfilms obtained by scratch test as a function offN2.
The adhesion strength of thefilm deposited atfN2 ¼0ccm is
about 120 mN, but the value decreases with increasing fN2.
Thefilm deposited atfN2 2:0ccm shows a constant value of about 60 mN, whereas the value of the film deposited at fN2 ¼6:0ccm decreases to less than 40 mN. These results
indicate that the film delamination by wearing of the film deposited at fN2¼6:0ccm is caused by the significant decrement of the adhesion strength between the film and substrate.
3.4 Effect of fN2 on oxidation behavior of Ti-Mo-C-N
film
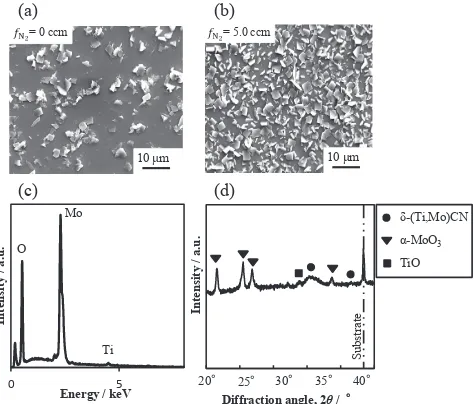
Figure 10(a) and (b) shows the SEM surface image after oxidation at 500°C in the film deposited at fN2¼0 and
5.0 ccm, respectively. There are precipitates on the surface of the bothfilms, and the amount of precipitates is much larger in the film deposited at fN2¼5:0ccm than in the film deposited at fN2¼0ccm. Figure 10(c) shows the EDX spectrum obtained from the square shaped precipitates in the
film deposited at fN2 ¼5:0ccm. The spectrum indicates that the precipitates are mainly composed of Mo oxides.
Figure 10(d) shows the XRD pattern taken from the oxidized
film deposited at fN2¼5:0ccm. The XRD pattern indicates that the square-shaped precipitates are ¡-MoO3. It is noted that after oxidation, a thin oxide layer including Ti and Mo is formed uniformly on the surface of the films and that the square shaped MoO3 oxide is formed on the thin oxide layer.16)
4. Discussion
4.1 Hardness change with increasingfN2
In the range offN22:0ccm, the hardness of the Ti-Mo-C-N film drastically decreased with increasing fN2. Mean-while, the hardness started to gradually increase in the range of fN2>2:0ccm and then drastically increased with increasing fN2 in the range of 3.0<fN2¯4.0 ccm.
Corre-(a) (b)
(d)
(c)
300μm
300μm
300μm 300μm
0 2 4
Intensity / a.u
.
Energy / keV
Ti Fe
Ti Ni
Mo
C N
O Fe
(e)
Fig. 8 SEM image of the wear track of the Ti-Mo-C-Nfilms deposited at (a)fN2¼0ccm, (b)fN2¼3:0ccm, (c)fN2¼5:0ccm and
(d)fN2¼6:0ccm. (e) EDX spectrum obtained from the wear debris in thefilm deposited atfN2¼5:0ccm.
0 20 40 60 80 100 120 140
0 1 2 3 4 5 6
Adhesion,
F
/m
N
fN2/ ccm
[image:4.595.112.483.68.314.2] [image:4.595.322.531.372.542.2]sponding to the variation of film hardness, changes of constituent phases XRD peaks were detected in the XRD results. In particular, the intensity of 111¤peak was drastically lowered by the addition of a small amount of N and accordingly, the hardness decreased. In the range of fN2>
3:0ccm, the hardness started to increase with the appearance of a 220¤ peak. Comparing the XRD results to the TEM observation results, it is suggested that with increasing fN2 in the region of fN23:0ccm, that the decrease of the intensity of the 220¤ XRD peak is caused by the micro-structural change from a columnar grain structure to a very
fine equiaxed grain structure with a size of below 5 nm with increasing fN2. Generally, the hardness increases with decreasing grain size according to the Hall-Petch relation-ship.18,19)Meanwhile, in the range of less than about 10 nm in grain size, it is known that the hardness decreases with decreasing grain size, indicating an inverse Hall-Petch relationship.20) This is because grain boundary sliding becomes dominant in a very fine grain size. Thus, it is suggested that the observed hardness decrease with increas-ingfN2 in the region offN2 3:0ccm is due to the inverse Hall-Petch relationship. On the other hand, in the region of fN2 >3:0ccm, thefilm microstructure changes from a very
fine equiaxed grain structure to a columnar grain structure with increasing fN2. As shown in Fig. 5(a), the width of columnar grains is above 10 nm, and therefore, grain boundaries should act as obstacles to dislocation motion, which causes the increase in hardness. The reason for the microstructural change with increasing fN2 is not clear at
present, but can possibly be attributed to the change of deposition pressure with increasing fN2, in addition to the
change of film composition.21)
4.2 Wear properties change by varying fN2
The results of the wear test indicated that in the region of fN2 5:0ccm, the average friction coefficient, ®ave decreases from 0.48 to 0.27 with increasing fN2. However,
the film deposited at fN2 6:0ccm showed a high friction coefficient of over 0.4. The EDX analysis indicated that wear debris was composed of Mo oxide. In particular, it is known that ¡-MoO3 has a low friction coefficient because of its layered crystal structure.22) The oxidation test at 500°C indicated that of the formation Mo oxide was larger in the
film deposited at fN2¼5:0ccm than in the film deposited
at fN2¼0ccm. Therefore, it is suggested that in the film
deposited at higher fN2, a large amount of Mo-oxide is
formed by wear oxidation which can act as solid lubricant, resulting in the reduction of friction coefficient. There are possibly two reasons why the amount of Mo-oxide increases in the film deposited at fN2¼5:0ccm. First, in the case of reactive sputtering with a Ti25Mo25C50 alloy target, the Mo content in the Ti-Mo-C-Nfilm increases with increasingfN2. Second, the N content in the Ti-Mo-C-Nfilm increases with increasingfN2. According to a previous study on (Ti, Mo)N coating, it has been suggested from the viewpoint of thermodynamics consideration that the activity of Ti in (Ti, Mo)N drastically decreases, whereas the activity of Mo increases with increasing N content.16,17) Consequently, Mo can be easily oxidized in (Ti, Mo)N film with a high N content. Therefore, it is considered that the formation of Mo oxide by wear oxidation can be also greatly promoted by increasing the N content in the Ti-Mo-C-Nfilm. Meanwhile, a high friction coefficient of the film deposited at fN2¼
6:0ccm is caused by the delamination of thefilm due to the decrease in adhesion strength (Fig. 9).
The H/E* ratio is a well-known parameter to evaluate wear resistance of coatings.23,24)A hard coating with a high H/E*shows a high resistance to plastic deformation, which causes better wear resistance. Musilet al., have reported that a hard coating material havingH/E*>0.1 exhibits excellent wear resistance.23) Figure 11 shows the H/E* ratio as a function offN2. The result of the Ti-Mo-Nfilm is also shown for comparison. It is seen that theH/E*ratio of the Ti-Mo-C
film is about 0.02 higher than that of the Ti-Mo-Nfilm. In the region of fN22:0ccm, the H/E* ratio of the Ti-Mo-C-N
film decreases slightly with increasingfN2, but in the region
of fN2 >2:0ccm, the H/E*ratio increases with increasing
fN2. Especially, the H/E* ratio of the Ti-Mo-C-N film
deposited atfN24:0ccm is higher than that of the Ti-Mo-C
film and reaches 0.095. This indicates that the addition of N to Ti-Mo-C is effective to improve the wear resistance. However, delamination of the film by wear was observed in the film deposited at fN2 6:0ccm. Therefore, further reduction of the friction coefficient and further improvement of wear resistance can be expected if the adhesion between the film deposited at fN2 6:0ccm and the SUS304 substrate is improved by inserting a buffer layer into the interface between thefilm and substrate.
5. Conclusion
Ti-Mo-C-N film was deposited by reactive RF sputtering of a Ti25Mo25C50 alloy target at various nitrogen gas flow rates (fN2). The effects of N content on the hardness and wear properties were investigated. With increasing fN2, the hard-ness drastically decreased, with a minimum value of 16 GPa being obtained at fN2 ¼2:0ccm. In the range of fN2>
Intensity / a.u.
Diffraction angle, 2θ/㼻
0 5
Intensity / a.u.
Energy / keV O
Mo
Ti 10μm
= 0 ccm = 5.0 ccm
(a) (b)
(c)
δ-(Ti,Mo)CN α-MoO3 TiO
Substrate
20㼻 30㼻 40㼻
(d)
35㼻 25㼻
[image:5.595.52.289.70.272.2]10μm
Fig. 10 SEM images of the surface of thefilm after oxidation at 500°C in thefilm deposited at (a)fN2¼0ccm and at (b)fN2¼5:0ccm. (c) EDX
2:0ccm, the hardness started to increase with increasingfN2 and a hardness of above 30 GPa was obtained in the film deposited atfN24:0ccm. With further increasingfN2, the hardness slightly decreased. The hardness decrease in the range of fN2 2:0ccm was due to the microstructural
changes from a columnar grain structure to a very fine equiaxed grain structure with a grain size of 5 nm by the addition of N. On the other hand, in the range of fN2 >2:0ccm, the microstructure changed from a very fine
equiaxed grain structure to a columnar grain structure with increasingfN2, resulting in an increase of hardness.
The friction coefficient of the Ti-Mo-C-N film decreased with increasingfN2 and the film deposited atfN2¼5:0ccm showed the lowest value of 0.27. Such a low friction coefficient can be obtained by the formation of Mo-oxide by wear oxidation. Meanwhile, a high friction coefficient of the
film deposited atfN2¼6:0ccm was caused by delamination of the film due to the decrease in adhesion strength. Furthermore, evaluation of the H/E* ratio indicated that the addition of N to Ti-Mo-C was effective to improve the wear resistance.
Acknowledgement
This study was supported by the Industrial Technology
Research Grant Program of the New Energy and Industrial Technology Development Organization (NEDO) of Japan in 2011.
REFERENCES
1) S. PalDey and S. C. Deevi:Mater. Sci. Eng. A342(2003) 5879. 2) H. Du, H. Zhao and G. Xian:Int. J. Ref. Met. H. Mater.37(2013) 60
66.
3) S. L. Ma, D. Y. Ma, Y. Guo, B. Xu, G. Z. Wu, K. W. Xu and P. K. Chu:
Acta Mater.55(2007) 63506355.
4) G. A. Zhang, P. X. Yan, P. Wang, Y. M. Chen and J. Y. Zhang:Appl.
Surf. Sci.253(2007) 73537359.
5) C. Hangwei, G. Yuan, Y. Lin, M. Zhikang and W. Chenglei:Rare Metal
Mater. Eng.43(2014) 10841087.
6) P. H. Mayrhofer and M. Stoiber:Surf. Coat. Technol.201(2007) 6148 6153.
7) C. Héau, R. Y. Fillit, F. Vaux and F. Pascaretti:Surf. Coat. Technol.
120121(1999) 200205.
8) J. H. Shin, K. S. Choi, T.-G. Wang, K. H. Kim and R. Nowak:Trans.
Nonferrous Met. Soc. China22(2012) s722s728.
9) D. V. Shtansky, K. A. Kuptsov, Ph. V. K.-Korneev and A. N. Sheveyko:
Surf. Coat. Technol.206(2012) 48404849.
10) A. Krella and A. Czyzniewski:Wear263(2007) 395401.
11) L. Shan, Y. Wang, J. Li, H. Li, X. Wu and J. Chen:Surf. Coat. Technol.
226(2013) 4050.
12) Y. Sutou, S. Komiyama, J. Koike, M. Wang and M. Sakurai: Collected Abstracts of the 2012 Autumn Meeting of the Japan Inst. Metals, (2012) No. 151 (DVD).
13) H.-S. Ahn, I.-W. Lyo and D.-S. Lim:Coat. Technol.133134(2000)
351361.
14) Q. Yang, L. R. Zhao, P. C. Patnaik and X. T. Zeng:Wear261(2006)
119125.
15) S. Komiyama, Y. Sutou and J. Koike:Metall. Mater. Trans. A42(2011)
33103315.
16) S. Komiyama: Doctoral thesis, Tohoku University, (2013).
17) S. Komiyama, Y. Sutou, K. Oikawa, J. Koike, M. Wang and M. Sakurai:Tribo. Int.87(2015) 3239.
18) P. H. Mayrhofer, G. Tischler and C. Mitterer:Surf. Coat. 142144
(2001) 7884.
19) P. H. Mayrhofer, C. Mitterer and J. Musil:Surf. Coat.174175(2003)
725731.
20) H. Conrad, J. Narayan and K. Jung:Int. J. Ref. Met. H. Mater.23
(2005) 301305.
21) J. A. Thornton:J. Vac. Sci. Technol.11(1974) 666670. 22) A. Erdemir, S. Li and Y. Jin:Int. J. Mol. Sci.6(2005) 203218. 23) J. Musil:Surf. Coat. Technol.207(2012) 5065.
24) J. Guo, H. Wang, F. Meng, X. Liu and F. Huang:Surf. Coat. Technol.
228(2013) 6875.
0.05 0.06 0.07 0.08 0.09 0.1 0.11
0 1 2 3 4 5 6
H/E*
fN2 / ccm
[image:6.595.67.273.67.226.2]Ti-Mo-N
Fig. 11 Nitrogenflow rate (fN2) dependence ofH/E*value in the


![1 [(6 Chloropyridin 3 yl)methyl]imidazolidin 2 iminium chloride](data:image/gif;base64,R0lGODlhAQABAIAAAP///wAAACH5BAEAAAAALAAAAAABAAEAAAICRAEAOw==)