Effect of Fullerene Acceptor on the Performance of Solar Cells based on
PffBT4T-2OD
Yiwei Zhang1,2, Andrew J. Parnell1, Oskar Blaszczyk2,Andrew J. Musser1, Ifor D. W. Samuel2,*, David G. Lidzey1* and Gabriel Bernardo1,*,ψ
1 Department of Physics and Astronomy, The University of Sheffield, S3 7RH, UK
2 Organic Semiconductor Centre, SUPA, School of Physics & Astronomy, University of St
Andrews, St Andrews KY16 9SS, UK
* Corresponding author’s emails: [email protected]; [email protected]; [email protected]
ψ Present address: LEPABE, Department of Chemical Engineering, University of Porto,
4200-465 Porto, Portugal
We have studied bulk-heterojunction (BHJ) solar cells composed of the polymer
PffBT4T-2OD as electron donor and three different electron accepting fullerenes, namely PC71BM,
PC61BM and indene-C60-bis-adduct (ICBA) in order to understand the impact of different
fullerenes on the morphology and efficiency of the corresponding photovoltaic devices.
Despite PffBT4T-2OD:ICBA devices being characterised by higher values of Voc, they
display the lowest power conversion efficiency (PCE) due to their lower Jsc and FF values.
We find that although all blend films have similar morphologies, x-ray scattering indicates a
reduced degree of order within the fullerene domains in the ICBA-based film. Due to the high
LUMO-level of ICBA, the corresponding blends are characterised by a lower initial exciton
dissociation and this associated with the reduced ordering within the ICBA domains results in
increased geminate recombination of the photogenerated electrons in the fullerene-rich
Introduction
Organic photovoltaic solar cells (OPVs) have been investigated intensively during the
last decades as they represent a promising candidate for third generation of photovoltaic
devices. Much of the research into OPVs has focused on the design of novel electron donor
conjugated polymers 1-3 which have resulted in an increase in power conversion efficiency
(PCE) of single BHJ OPV devices from less than 1% in the poly(phenylenevinylene) (PPV)
system in 1995 4, to 4–5% in the poly(3-hexylthiophene) (P3HT) system in 2005 5, 6 and over
the period 2012 – 2014 to ~7 % with PCDTBT 7, 8, > 9% with PTB7 9 and > 10% with
PBDTTT-EFT 10 and PffBT4T-2OD 11, 12.
In contrast to conjugated polymers, less attention has been devoted to the design and
testing of improved fullerene-based acceptors 13. Here, the functionalization of fullerenes
opens the possibility of inserting a plethora of different electron donor and withdrawing
groups with direct influence on the location of the HOMO-LUMO levels and the optical
absorption.14-16 Such groups can also tune the solubility or induce ordered morphologies 17, 18.
The low band gap donor polymer
poly[(5,6-difluoro-2,1,3-benzothiadiazol-4,7-diyl)-alt-(3,3’’’-di(2-octyldodecyl)2,2’;5’,2’’;5’’,2’’’-quaterthiophen-5,5’’’-diyl)] (PffBT4T-2OD)
has recently attracted attention due to its high performance in OPV devices 11, 12, 19.
PffBT4T-2OD, also known as PCE11, exhibits high crystallinity resulting in high hole-mobility,
together with the formation of relatively pure polymer domains that allow it to perform well
in an OPV device even when used in relatively thick layers (~300 nm). PffBT4T-2OD also
exhibits a peculiarly strong temperature-dependent aggregation behavior in solution 11, 12,
characterized by the formation of a gel at room temperature. Consequently, PffBT4T-2OD
based devices are always cast from warm solutions (> 60 ºC), which then aggregate or
crystallize during cooling and film forming processes. Indeed, it has been shown that this
efficiently used to control the morphology of the corresponding BHJs. This has permitted a
near-ideal polymer:fullerene morphology (containing highly crystalline, preferentially
orientated, yet small polymer domains) to be created by control over polymer aggregation
during solution casting.
In this work we investigate the effect of fullerene properties on the performance of
BHJ solar cells based on the donor polymer PffBT4T-2OD blended with three different
fullerene acceptors; namely PC71BM, PC61BM and indene-C60-bis-adduct (ICBA). We
compare the device performance using different fullerene acceptors and study their thin-film
nanostructure using atomic force microscopy (AFM), small angle neutron scattering (SANS)
and grazing incidence wide angle X-ray scattering (GIWAXS) and their photophysical
properties using transient absorption spectroscopy (TA).
Experimental Section
Materials
PEDOT:PSS (HC Stark CleviosAI4083), used as hole transport layer, was purchased
from Ossila Ltd. The polymer PffBT4T-2OD with Mn = 54,900 g.mol-1 and Mw = 117,800
g.mol-1 was purchased from California Organic Semiconductor Inc. The fullerenes used as
electron acceptors were: (a) PC71BM, [6,6]-phenyl-C71 butyric acid methyl ester, empirical
formula C82H14O2 and Mw = 1030.99 g.mol-1 was purchased from Ossila Ltd; (b) PC61BM,
[6,6]-phenyl-C61 butyric acid methyl ester, empirical formula C72H14O2 and Mw = 910.88
g.mol-1 was purchased from Solenne BV; (c) ICBA,
1’,1’’,4’,4’’-tetrahydro-di[1,4]methanonaphthaleno[5,6]fullerene-C60, empirical formula C78H16 and Mw = 952.96
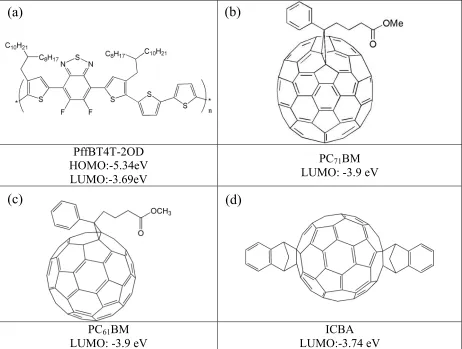
g.mol-1 was purchased from Solenne BV. The chemical structures of PffBT4T-2OD and of
the three fullerenes tested, as well as their corresponding HOMO-LUMO levels, are shown in
PffBT4T-2OD HOMO:-5.34eV LUMO:-3.69eV
PC71BM LUMO: -3.9 eV
PC61BM
LUMO: -3.9 eV
[image:4.595.67.529.72.421.2]ICBA LUMO:-3.74 eV Figure 1.Chemical structures of the polymer and fullerenes used in this work
All the solvents used (chlorobenzene (CB), o-dichlorobenzene (DCB) and
1,8-diiodooctane (DIO)) were purchased from Sigma-Aldrich. All the materials and solvents
were used as received without further purification. Experimental methods
To fabricate OPV devices, we have utilized a general architecture consisting of
ITO/PEDOT:PSS/Active layer/Ca/Al. Here, the active layers were all spin-coated from a
solution of chlorobenzene and o-dichlorobenzene (1:1 volume ratio) with 3%DIO (volume
percentage) as a solvent additive, with the polymer and the fullerene having concentrations of
9 mg/ml and 10.8 mg/ml respectively. Spin-coating was conducted in a nitrogen filled glove
box from pre-heated solutions (110 ºC) at a spin speed of 1000 rpm onto PEDOT:PSS / ITO
glass substrates that were pre-heated to 110 ºC. The resultant wet films had a thickness of
(c)
(d)
around 300 nm as determined by spectroscopic ellipsometry. The films were then left inside a
glove box for ~2 hours to dry, after which they were placed into a vacuum chamber with a
pressure ~ 1 mbar for another hour to dry, before being annealed at 100ºC for 5 minutes. A
cathode consisting of 5 nm calcium (Ca) and 100 nm aluminium (Al) was then evaporated on
top of the active layer under a vacuum of 2×10⁻⁶ mbar to form the top electrode contact.
Finally, the devices were encapsulated using UV-cured epoxy and a glass slide. The
photovoltaic properties of the devices were determined using a Newport 92251A-1000 AM
1.5 solar simulator which was calibrated using standard reference silicon photodiode
calibrated by NREL under the light intensity of 100 mW/cm2 (1 sun). An aperture mask was
utilised to limit the light-exposed area of the device to 2.6 mm2.
Optical absorbance spectra were measured using a transmission accessory for a Jobin
Yvon Horiba Fluoromax-4 spectrometer, whilst the PL spectra were measured using a
different spectrometer (Jobin Yvon 320) following excitation with a 532 nm laser diode.
SANS experiments were performed on the LOQ diffractometer at the ISIS Pulsed
Neutron Source (Didcot, UK) and processed using Mantid for transmission and thickness 20.
The SANS data (on an absolute scale) were then fitted to appropriate models using SasView
software (Version 4.1.1) 21. For sample preparation, blend films were spin-coated onto 0.5
mm thick quartz slides, pre-coated with PEDOT:PSS following the same procedure used in
device fabrication. Therefore, the thickness of the SANS films is exactly the same as the
thickness of the device films. Stacks of 12 individual blend films on quartz discs were then
assembled in order to produce good signal to noise statistics in the SANS measurement 22, 23.
GIWAXS measurements were performed on a Xeuss 2.0 SAXS/WAXS laboratory
beamline using a liquid Gallium MetalJet (Excillum) X-ray source (9.2 keV, 1.34Å), with
scattered X-rays detected using a Pilatus3R 1M detector. Samples were prepared on
preparation of devices.
In transient absorption (TA) measurements the output of a Pharos laser (Light Conversion) operating at 50kHz at a wavelength of 1030 nm was frequency doubled and used
to pump an optical parametric amplifier (OPA) to generate 630 nm pump pulses. This 1030
nm light was directed to a non-linear medium (sapphire window) to generate white light.
Transient absorption was then performed using a HARPIA set up provided by Light
Conversion Ltd.
Results and Discussion
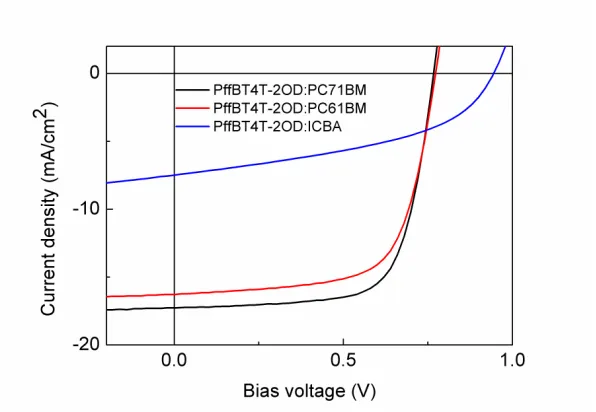
Table 1 and Figure 2 present the characteristics of devices processed using PC71BM,
PC61BM and ICBA as electron acceptors. Devices containing PC71BM as the acceptor
exhibited the best overall device performance, yielding an average PCE of 8.9%, and a Voc,
FF and Jsc of 0.76 V, 69% and 17.0 mA/cm2 respectively. We find that devices utilising a
PC61BM acceptor (which has a LUMO energy level similar to that of PC71BM) had a lower
PCE of 8.2%, a similar Voc of 0.76 V, a lower FF of 67% and a lower Jsc of 15.9 mA/cm2
compared to that of the PC71BM reference. Interestingly devices with ICBA have a Jsc value
that is much smaller than the Jsc value of the other devices but are characterised by the
highest values of Voc. The Voc of an OPV is proportional to the energy difference between the
HOMO of the donor material and the LUMO of the acceptor material 24, suggesting that the
enhanced value of Voc of the ICBA-based device results from the higher LUMO level of
ICBA (-3.74 eV compared to -3.90 eV for ICBA and PC71BM respectively) 2526. The low Jsc
in the PffBT4T-2OD: ICBA device is also speculated to be a result of the high LUMO level
of ICBA, which makes the exciton dissociation less efficient. This will be investigated and
PCE (%) Voc(V) FF (%) Jsc (mA/cm2)
PffBT4T-2OD : PC71BM (8.93±0.38) 9.31 (0.76±0.01) 0.76 70 (69±3) -17.3 (-17.0±0.3)
PffBT4T-2OD : PC61BM (8.15±0.25) 8.46 (0.76±0.01) 0.77 67 (67±1) -16.3 (-15.9±0.5)
[image:7.595.79.520.73.203.2]PffBT4T-2OD : ICBA (2.78±0.23) 3.19 (0.91±0.04) 0.94 45 (45±1) -7.5 (-6.8±0.6)
Table 1. Device metrics showing peak and (average) values for PCE, Voc, FF and Jsc for devices processed with different fullerenes.
Figure 2. JV curves of devices processed with different fullerenes
To investigate the origin of the different device performance, we have measured the
absorption and photoluminescence spectra of pristine PffBT4T-2OD films and of films
consisting of PffBT4T-2OD blended with the different fullerenes and the results are shown in
Figure 3. It can be seen from Figure 3(a), that the absorption of the blend film based on
PC71BM is the largest across the visible spectrum as a result of the higher absorption of
PC71BM compared with the other fullerenes. This increased light absorption by PC71BM
partly explains the increased Jsc and PCE of PffB4T-2OD:PC71BM devices. As shown in
Figure 3(b), the PL intensity of the blend films is much smaller than the PL intensity of the
pristine polymer due to the quenching that occurs at the donor: acceptor interface.
[image:7.595.149.447.252.458.2]two polymer: fullerene blends after being corrected for absorption. The high PL intensity in
PffBT4T-2OD: ICBA blend can be attributed to the high LUMO level of ICBA, which
reduces the difference between donor LUMO and acceptor LUMO energies, being 0.05 eV; a
value that is smaller than the exciton binding energy of conjugated polymers (~0.2 eV). 27, 28
As a result, ICBA is a less efficient quencher for PffBT4T-2OD. Another possible reason for
the abnormal high PL intensity is the morphology of this blend that is rather different from
the other two blends. In order to investigate this, we performed a series of characterization
measurements.
[image:8.595.80.521.311.486.2]
Figure 3. Absorption (a) and PL (b) spectra of pure PffBT4T-2OD and PffBT4T-2OD:fullerene blend
films with the figure insert showing a magnification view of the blend emission.
Atomic force microscopy (AFM) was used to study the surface morphology of the
blend films. This reveals that all films have very similar surface morphologies (see Figure S1
in supporting information), with a root mean-square roughness for the PffBT4T-2OD films
blended with PC71BM, PC61BM and ICBA being 3.77, 4.50 and 3.74 nm respectively.
To probe the morphology within the bulk-heterojunction films, we have used small
angle neutron scattering (SANS). We note that one clear advantage on the use of neutrons to
probe this system, lies in the fact that the neutron scattering length density (SLD) difference
sufficiently high that no additional deuteration of one component is necessary and the same
applies to other conjugated polymer-fullerene systems in general. In Figure S2, we show
SANS data from PffBT4T-2OD:fullerene films with scattering intensity plotted versus
scattering vector q. It can be seen that the three different BHJs have very similar scattering
intensities, suggesting that the three different BHJ films have similar nano-morphologies
(note that all fullerenes studied have very similar scattering length densities). SANS data was
fitted using the Debye-Anderson-Brumberger (DAB) model 29, 30 (Equation 1) as described
previously 19. This model has the form
( )
(
)
3
2 2 ( )
1
DB
c L d
q b
d qL
Σ
= +
Ω + (1)
where the scaling factor cDB = 8π(Δρ)2φ1φ2 and Δρ is the neutron scattering length density
difference between the phases having volume fractions of φ1 and φ2. The second term (b) on
the right hand side of Equation 1 is a background intensity that includes both instrumental
and sample specific factors, i.e. the incoherent scattering intensity. As shown in Figure S2,
the DAB model gives a good description of all the data. The values obtained from the fits for
cDB and L using equation 1 are presented in Table S1. This Table also includes the
corresponding normalized values of χ2 that confirm the quality of the model fits to the data. It
can be seen that although the phase-separated domains are largest in the PC71BM-blends and
smallest in the ICBA-based blends, the relatively small differences observed cannot explain
the large differences observed in device PCEs and PL spectra.
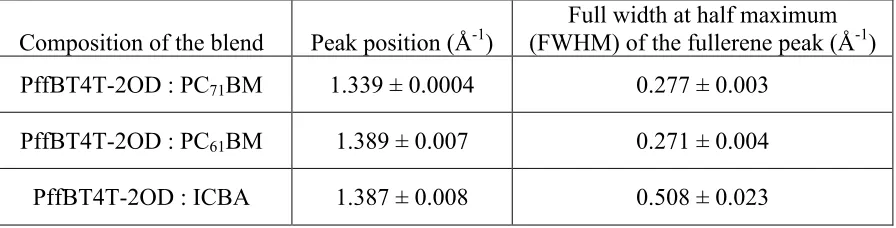
We have therefore used GIWAXS to explore molecular packing and the results are
shown in Figure 4 and in Table 2. In Figure 4(a) the GIWAXS data is scaled in intensity to
the (100) lamellar stacking spacing peak of PffBT4T-2OD at q = 0.29 Å-1. In Figure 4(b) we
the fullerene peak intensity at q ~ 1.39 Å-1. As it can be seen, the blend sample incorporating
ICBA is characterised by an enhanced crystallinity of the polymer phase as compared to the
fullerene phase. Indeed, we observe the (400) PffBT4T-2OD scattering peak in the
ICBA-containing blend as a shoulder on the fullerene peak around q ~ 1.16 Å-1 (Figure 4(c)). When
we normalise scattering data to the fullerene peak intensity at q ~ 1.39 Å-1 (Figure 4(c))
however, we find that a broad band observed around ~ 0.7 Å-1 (that is attributed to
unaggregated fullerene) is relatively stronger in the ICBA blend than the equivalent peak in
blends based on either PC61BM or PC71BM. This finding agrees with recent work in which
ICBA aggregates in BHJs exhibited reduced ordering (crystallinity) compared to aggregates
based on PCBM 31. Taken together, our GIWAXS and SANS measurements suggest that
blends studied are characterised by similar length-scales of phase-separation, however the
PffBT4T-2OD:ICBA blends have relatively reduced degree of fullerene crystallisation
although their polymer component is significantly more ordered.
Composition of the blend Peak position (Å-1)
Full width at half maximum (FWHM) of the fullerene peak (Å-1)
PffBT4T-2OD : PC71BM 1.339 ± 0.0004 0.277 ± 0.003
PffBT4T-2OD : PC61BM 1.389 ± 0.007 0.271 ± 0.004
[image:10.595.71.519.439.553.2]PffBT4T-2OD : ICBA 1.387 ± 0.008 0.508 ± 0.023
Table 2. Summary of the structural peak positions for the various fullerenes used along with the peak width.
Figure 4. (a) GIWAXS profiles for the three different PffBT4T-2OD:fullerene blend films and for pure 2OD. The GIWAXS data has been scaled in intensity to the (100) peak of PffBT4T-2OD at q=0.29 Å-1; (b) a magnified version of (a); (c) the same GIWAXS data scaled to the fullerene
peak intensity at q ~ 1.39 Å-1.
In order to investigate the influence of acceptor LUMO levels and the different
crystallinity on the polymer: fullerene blend photophysics, we employed transient absorption
(TA) measurements to explore the dynamics of charge generation and recombination in
(a)
(b)
different blends. Figure 5(a) shows the transient absorption of the pristine polymer and of the
[image:12.595.76.527.133.301.2]various blends measured at 1 ps after excitation.
Figure 5. (a) Transient absorption (TA) spectra of thin films of pure 2OD and PffBT4T-2OD blended with PC71BM, PC61BM and ICBA respectively measured at 1ps after excitation with
630 nm (1 µJ/cm2). (b) decay of the ground state bleaching (GSB) with bi-exponential fitting plotted using solid lines.
Figure S3 shows the transient absorption spectra of the same films measured at
different time scales after excitation. Three primary spectral features can be identified in this
spectral range. The prominent negative peaks correspond to the PffBT4T-2OD absorption
spectrum and reflect ground-state bleaching (GSB); a measure of the total excited-state
population. The photo-induced absorption (ΔT/T>0) increasing beyond 950 nm observed in
the pure PffBT4T-2OD films can be attributed to the polymer singlet state as it is the first
species observed upon photo-excitation. This singlet band is broad, extending on the
short-wavelength side to a weak shoulder at ~780 nm. All three polymer blends contain an
additional photo-induced absorption peak, easily distinguished from the shoulder of the
singlet band, in the region of 760 nm that is thus linked to the presence of charge carriers.
This is consistent with the significant singlet quenching observed in blend films in Fig. 3b,
and with the reduced degree of spectral evolution observed in the transient absorption
dynamics in blend films (Fig. S3). The data here cannot distinguish whether the peak at 760
from the electric field between electron and hole polarons.32 In either case the peak is a
unique signature of charge transfer from polymer to fullerene, and our observations taken
together suggest that the primary spectral species observed on these timescale is charge
carriers. The absorption at longer wavelengths (> 800 nm) in the polymer blends may be a
signature either of residual polymer singlet states or charge carriers. The intensity ratio in the
bands ~760 nm (charges) and ~950 nm (charges and singlets) suggests a qualitative yield for
prompt exciton dissociation PC70CM ~ PC60CM > ICBA >> PffBT4T-2OD, which is
consistent with the steady state PL quenching results. The kinetics in Fig. 5(b) provide further
insight, showing the normalised decay of ground-state bleaching (i.e. total excited population)
in all films. We observe very rapid return to the ground state in pure PffBT4T-2OD, due to a
short intrinsic S1 lifetime, having a characteristic time constant of 55 ps. The increased
populations at 1 ns in the polymer-blends indicate charge carriers with a fitting lifetime well
beyond the range of our measurement (~20000 ps). Interestingly, in the ICBA blends we
observe fast decay in the 1 ps to 1 ns timescale (lifetime from fitting was 3300 ps), revealing
an enhanced channel for charge carrier recombination compared to the PC61CM and PC71BM
blends. The decay is slowest in for PffBT4T-2OD:PC71BM blend, suggesting charge
recombination is slowest in this blend, which is consistent with the highest short circuit
current density. On these timescales, the recombination should be geminate and may be a
sign that the carriers remain trapped near the interface in the ICBA blend.
Our results suggest therefore that PC71BM and PC61CM blends show rapid exciton
dissociation into long-lived charge carriers with higher yield than ICBA blend. ICBA blends
exhibit both a lower initial exciton dissociation yield and faster recombination of the charges
that do form, consistent with the much lower JSC in ICBA devices. This exciton and charge
dynamics are understandable considering the fact that ICBA has a higher LUMO level that
ICBA blends compared with the other two polymer: fullerene blends studied. In addition,
previous work has shown that fullerene aggregation is an essential condition for the rapid and
high-yield formation of charge-separated states 33. Our GIWAXS measurements suggest that
the ICBA domains formed have reduced crystallinity, and thus we suspect that such domains
have a reduced density of highly delocalized states, with any charge pairs formed being
preferentially trapped at the polymer-fullerene interface. This charge trapping is likely to
result in the prominent geminate recombination observed in TA measurement.
In summary, we have explored the role of different fullerenes on device performance of
PffBT4T-2OD: fullerene BHJ solar cells. Among the three fullerene acceptors investigated,
the highest device efficiency occured in an PffBT4T-2OD:PC71BM blend, with an efficiency
of 9.31% determined. Devices based on blends of PffBT4T-2OD:ICBA had a much higher
open circuit voltage of 0.94V and were characterized by low values of Jsc and FF with
devices having the lowest PCE of 3.19%. Using transient absorption spectroscopy, we
concluded that ICBA blends were characterised by a lower initial exciton dissociation yield
due to the high LUMO-level of ICBA, with the faster recombination of the charges in
PffBT4T-2OD:ICBA blend attributed to reduced molecular ordering of the ICBA domains.
Our work provides a useful example of how the LUMO level of the acceptor-species
combined with molecular-scale order can directly determine the efficiency of a macroscopic
device.
Acknowledgements
Y.Z. thanks the University of Sheffield for the provision of a PhD scholarship. Y.Z., O.B, and
I.D.W.S. acknowledge financial support from the European Research Council (EXCITON
grant 321305). I.D.W.S. acknowledges a Royal Society Wolfson Research Merit Award. G.B.
(FP7/H2020 – Grant agreement number: 658391). We thank the EPSRC for financial support
via grants EP/I028641/1 “Polymer/fullerene photovoltaic devices: new materials and
innovative processes for high-volume manufacture”, EP/J017361/1 “Supergen Supersolar
Hub”, EP/M025020/1 “High resolution mapping of performance and degradation
mechanisms in printable photovoltaic devices” and EP/M025330/1, “Hybrid Polaritonics”.
The STFC and ISIS spallation neutron source are thanked for the provision of neutron beam
time on LoQ (Experiment 1620335). This work benefited from the DANSE software analysis
package developed under NSF award DMR-0520547.
References
1. J. Chen and Y. Cao, Accounts of Chemical Research, 2009, 42, 1709-‐1718. 2. E. Zhou, K. Hashimoto and K. Tajima, Polymer, 2013, 54, 6501-‐6509. 3. T. Xu and L. Yu, Mater Today, 2014, 17, 11-‐15.
4. G. Yu, J. Gao, J. C. Hummelen, F. Wudl and A. J. Heeger, Science, 1995, 270, 1789-‐1791. 5. G. Li, V. Shrotriya, J. Huang, Y. Yao, T. Moriarty, K. Emery and Y. Yang, Nature Materials,
2005, 4, 864-‐868.
6. W. Ma, C. Yang, X. Gong, K. Lee and A. J. Heeger, Advanced Functional Materials, 2005, 15, 1617-‐1622.
7. D. H. Wang, J. K. Kim, J. H. Seo, I. Park, B. H. Hong, J. H. Park and A. J. Heeger, Angewandte Chemie-‐International Edition, 2013, 52, 2874-‐2880.
8. J. Liu, Q. Liang, H. Wang, M. Li, Y. Han, Z. Xie and L. Wang, Journal of Physical Chemistry C, 2014, 118, 4585-‐4595.
9. Z. C. He, C. M. Zhong, S. J. Su, M. Xu, H. B. Wu and Y. Cao, Nature Photonics, 2012, 6, 591-‐ 595.
10. S. Zhang, L. Ye, W. Zhao, D. Liu, H. Yao and J. Hou, Macromolecules, 2014, 47, 4653-‐4659. 11. Y. Liu, J. Zhao, Z. Li, C. Mu, W. Ma, H. Hu, K. Jiang, H. Lin, H. Ade and H. Yan, Nat Commun,
2014, 5, 5293
12. W. Ma, G. Yang, K. Jiang, J. H. Carpenter, Y. Wu, X. Meng, T. McAfee, J. Zhao, C. Zhu, C. Wang, H. Ade and H. Yan, Advanced Energy Materials, 2015, 5, 1501400
13. R. Ganesamoorthy, G. Sathiyan and P. Sakthivel, Solar Energy Materials and Solar Cells, 2017, 161, 102-‐148.
14. F. Piersimoni, S. Chambon, K. Vandewal, R. Mens, T. Boonen, A. Gadisa, M. Izquierdo, S. Filippone, B. Ruttens, J. D’Haen, N. Martin, L. Lutsen, D. Vanderzande, P. Adriaensens and J. V. Manca, The Journal of Physical Chemistry C, 2011, 115, 10873-‐10880.
15. N. Martín, L. Sánchez, B. Illescas and I. Pérez, Chem Rev, 1998, 98, 2527-‐2548.
16. D. M. Guldi, B. M. Illescas, C. M. Atienza, M. Wielopolski and N. Martin, Chemical Society reviews, 2009, 38, 1587-‐1597.
17. H. Hoppe and N. S. Sariciftci, J Mater Chem, 2006, 16, 45-‐61.
18. C. J. Brabec, M. Heeney, I. McCulloch and J. Nelson, Chemical Society Reviews, 2011, 40, 1185-‐1199.
20. F. Akeroyd, S. Ansell, S. Antony, O. Arnold, A. Bekasovs, J. Bilheux, J. Borreguero, K. Brown, A. Buts, S. Campbell, D. Champion, L. Chapon, M. Clarke, S. Cottrell, R. Dalgliesh, D. Dillow, M. Doucet, N. Draper, R. Fowler, M. A. Gigg, G. Granroth, M. Hagen, W. Heller, A. Hillier, S. Howells, S. Jackson, D. Kachere, M. Koennecke, C. Le Bourlot, R. Leal, V. Lynch, P. Manuel, A. Markvardsen, R. McGreevy, D. Mikkelson, R. Mikkelson, R. Miller, S. Nagella, T. Nielsen, K. Palmen, P. G. Parker, M. Pascal, G. Passos, T. Perring, P. F. Peterson, F. Pratt, T. Proffen, P. Radaelli, J. Rainey, S. Ren, M. Reuter, L. Sastry, A. Savici, J. Taylor, R. J. Taylor, M. Thomas, R. Tolchenov, R. Whitley, M. Whitty, S. Williams, W. Zhou and J. Zikovsky, Mantid:
Manipulation and Analysis Toolkit for Instrument Data,
http://dx.doi.org/10.5286/SOFTWARE/MANTID, (accessed 06/06/2018).
21. G. Alina, P. Butler, J. Cho, M. Doucet and P. Kienzle, SasView for Small Angle Scattering Analysis, http://www.sasview.org/, (accessed: 06/06/2018).
22. R. L. Jones, S. K. Kumar, D. L. Ho, R. M. Briber and T. P. Russell, Nature, 1999, 400, 146-‐149. 23. R. L. Jones, S. K. Kumar, D. L. Ho, R. M. Briber and T. P. Russell, Macromolecules, 2001, 34,
559-‐567.
24. C. J. Brabec, A. Cravino, D. Meissner, N. S. Sariciftci, T. Fromherz, M. T. Rispens, L. Sanchez and J. C. Hummelen, Adv Funct Mater, 2001, 11, 374-‐380.
25. Y.-‐J. Cheng, C.-‐H. Hsieh, Y. He, C.-‐S. Hsu and Y. Li, J Am Chem Soc, 2010, 132, 17381-‐17383. 26. Y. He, H.-‐Y. Chen, J. Hou and Y. Li, J Am Chem Soc, 2010, 132, 1377-‐1382.
27. S. J. Hwa, J. Youngeup, B. J. Z., W. Bright and N. Thuc‐Quyen, Chemphyschem, 2009, 10, 1023-‐1027.
28. J.-‐L. Brédas, J. E. Norton, J. Cornil and V. Coropceanu, Accounts Chem Res, 2009, 42, 1691-‐ 1699.
29. P. Debye and A. M. Bueche, Journal of Applied Physics, 1949, 20, 518-‐525.
30. P. Debye, H. R. Anderson and H. Brumberger, Journal of Applied Physics, 1957, 28, 679-‐683. 31. S. Roland, L. Yan, Q. Zhang, X. Jiao, A. Hunt, M. Ghasemi, H. Ade, W. You and D. Neher, The
Journal of Physical Chemistry C, 2017, 121, 10305-‐10316.
32. S. Gélinas, A. Rao, A. Kumar, S. L. Smith, A. W. Chin, J. Clark, T. S. van der Poll, G. C. Bazan and R. H. Friend, Science, 2014, 343, 512.
33. B. M. Savoie, A. Rao, A. A. Bakulin, S. Gelinas, B. Movaghar, R. H. Friend, T. J. Marks and M. A. Ratner, Journal of the American Chemical Society, 2014, 136, 2876-‐2884.