ESSAY
An Estimate of the Total DNA in the
Biosphere
Hanna K. E. Landenmark*, Duncan H. Forgan¤, Charles S. Cockell
United Kingdom Centre for Astrobiology, School of Physics and Astronomy, University of Edinburgh, Edinburgh, United Kingdom
¤ Current address: School of Physics & Astronomy, Physical Science Building, North Haugh, St Andrews, United Kingdom
Abstract
Modern whole-organism genome analysis, in combination with biomass estimates, allows us to estimate a lower bound on the total information content in the biosphere: 5.3 × 1031 (±3.6 × 1031) megabases (Mb) of DNA. Given conservative estimates regarding DNA tran-scription rates, this information content suggests biosphere processing speeds exceeding yottaNOPS values (1024Nucleotide Operations Per Second). Although prokaryotes evolved at least 3 billion years before plants and animals, we find that the information con-tent of prokaryotes is similar to plants and animals at the present day. This information-based approach offers a new way to quantify anthropogenic and natural processes in the biosphere and its information diversity over time.
An Information View of the Biosphere
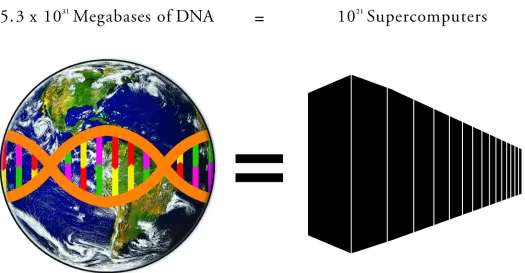
Biodiversity and habitat loss is recognised as a global issue [1]. In response, substantial research effort has been invested in genome sequencing and the preservation of vulnerable species and habitats. However, despite these remarkable advances, to our knowledge, there is still no esti-mate of the total information content of the biosphere. Using available DNA sequencing and genome data, combined with large-scale surveys of biomass, we present an alternative way of quantifying and understanding biodiversity. This is accomplished by adopting an information view of biodiversity, in which the total amount of information in the biosphere is represented by the available amount of DNA (Fig 1). In this way, the biosphere can be visualised as a large, parallel supercomputer, with the information storage represented by the total amount of DNA and the processing power symbolised by transcription rates. In analogy with the Internet, all organisms on Earth are individual containers of information connected through interactions and biogeochemical cycles in a large, global, bottom-up network. By combining data on ge-nome size, spatial diversity, and mass from different prokaryotes, eukaryotes, and the viruses, we estimate the total biomass for each group and then derive a first-order, lower-bound ap-proximation for the total DNA content of each group.
This approach to evaluating the information content of the biosphere has implications in several fields of science. An important current priority is understanding diversity loss in the biosphere. The modern approach is to focus on species diversity [2]. However, species are
OPEN ACCESS
Citation:Landenmark HKE, Forgan DH, Cockell CS (2015) An Estimate of the Total DNA in the Biosphere. PLoS Biol 13(6): e1002168. doi:10.1371/ journal.pbio.1002168
Published:June 11, 2015
Copyright:© 2015 Landenmark et al. This is an open access article distributed under the terms of the
Creative Commons Attribution License, which permits unrestricted use, distribution, and reproduction in any medium, provided the original author and source are credited.
Funding:The authors received no specific funding for this work.
merely the phenotypic representation, or containers, within which the information that under-pins the functioning of the biosphere is stored as DNA. Counting the number of species and number of individuals as a measure of biological diversity yields limited insight into the quanti-ty of the information that the biosphere contains. The corresponding action in the electronic computer analogy would be to attempt to estimate the information content of the Internet by counting the number of models and number of computers attached to it. Here, we instead use an approach whereby the total amount of DNA is quantified, giving an estimate of the informa-tion content in the biosphere.
We note that the approach that we propose here (and the analogy of supercomputers) does not necessarily imply a global, Gaia-like superorganism. We merely observe that ultimately all organisms interact with each other and the environment. Thus, the information being pro-cessed in the biosphere is interlinked in a large mass of organisms, however one chooses to conceptualise this. It does not have to be considered as a single, self-regulating organism. The manner in which the total information in the biosphere is processed, and the degree to which it is coordinated and interlinked in feedback processes, is another matter, but one that could be investigated using an information-based approach.
The Total DNA in the Biosphere
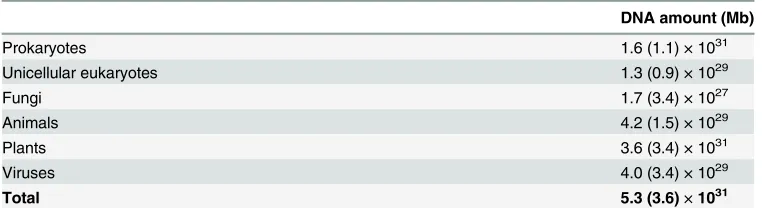
[image:2.612.37.562.69.342.2]Using information on the typical mass per cell for each domain and group and the genome size, we estimate the total amount of DNA in the biosphere to be 5.3 × 1031(±3.6 × 1031) mega-base pairs (Mb) (Table 1). This quantity corresponds to approximately 5 × 10¹⁰tonnes of DNA, assuming that 978 Mb of DNA is equivalent to one picogram [3]. Assuming the com-monly used density for DNA of 1.7 g/cm3, then this DNA is equivalent to the volume of
Fig 1. Storing the total amount of information encoded in DNA in the biosphere, 5.3 × 1031megabases (Mb), would require approximately 1021
supercomputers with the average storage capacity of the world’s four most powerful supercomputers.Image credit: Globe from NASA, Wikimedia Commons; Composite Fig. 1 created by David Hammett.
approximately 1 billion standard (6.1 × 2.44 × 2.44 m) shipping containers. The DNA is incor-porated within approximately 2 × 10¹²tonnes of biomass and approximately 5 × 1030living cells, the latter dominated by prokaryotes. By analogy, it would require 1021computers with the mean storage capacity of the world’s four most powerful supercomputers (Tianhe-2, Titan, Sequoia, and K computer) to store this information [4]. The methodological approach is sum-marised inBox 1, and detail is provided inS1 Methods.
The total information content of prokaryotes was found from the product of the mean ge-nome size of prokaryotes and estimates of the total number of prokaryotes on the earth, giving a value of 1.6 × 1031Mb. It was estimated to be similar to the total DNA in all eukaryotic groups, 3.7 × 1031Mb. In the eukaryotes, the DNA was calculated to predominantly reside in plant matter. Four different estimates of global plant biomass, converted to DNA quantity, gave a total plant DNA content of 3.65 × 1031Mb. We were able to calculate the total DNA in all animal groups using two methods. One method used the mass of different types of organ-isms and then extrapolated to total numbers of organorgan-isms, their total cell mass, and thus DNA content. The other method used specific biome biomass estimates to calculate the global DNA content in animals by considering the mass distribution across different biomes on Earth. Both methods gave final DNA quantities within 2-fold of each other (4.24 × 1029and 3.67 × 1029 Mb, respectively). The former was used in our final estimate. Although, in our estimates, fungi and unicellular eukaryotes contribute less DNA than plant or animal matter, they still contain a substantial quantity of the processing power, having 1.73 × 1027and 1.31 × 1029Mb, respec-tively. We enumerated them using existing estimates for their biomass in different biomes on the earth. Although viruses are not cellular life, they play an enormously important role in bio-logical interactions in the biosphere and the turnover of carbon, for instance [24]. They are, therefore, influential in the computational processing occurring in the biosphere. We estimate the total DNA contained within them (or their equivalent RNA code, which we include here because, unlike transcribed RNA in cellular life, the RNA in some viruses is used as their per-manent genetic code) to be 3.95 × 1029Mb.
[image:3.612.199.580.88.192.2]Several orthogonal methods were employed to test the accuracy of the result. We utilised data on DNA concentrations in soil and water to achieve a much coarser-grained global esti-mate of the quantity of DNA in the environment. The quantity of dissolved DNA in aquatic environments is of the order of 10μg/l [26] and the total volume of aquatic habitats on Earth is 1.4 × 10²¹l [5,27], giving a total quantity of DNA of approximately 1.4 × 1031Mb. Similarly, the concentration of DNA in soil is about 10μg DNA/g soil [28,29]. The earth has about 1.1 × 10²¹g soil, using a bulk density of 1.3 × 10⁶g/m3[5,30], hence the total quantity of DNA is estimated to be 1.1 × 1031Mb. Thus, we estimate the amount of DNA in soil and water to be of the order of 1031Mb. Information on DNA abundance can also be gleaned from the earth’s total organic carbon, which is estimated to be on the order of 2,000 Gt [31]. DNA makes up a
Table 1. The total DNA content in the biosphere
DNA amount (Mb)
Prokaryotes 1.6 (1.1) × 1031
Unicellular eukaryotes 1.3 (0.9) × 1029
Fungi 1.7 (3.4) × 1027
Animals 4.2 (1.5) × 1029
Plants 3.6 (3.4) × 1031
Viruses 4.0 (3.4) × 1029
Total 5.3 (3.6)×1031
Box 1. Methods Summary
few percent of cellular carbon; from literature estimates we chose a working value of 3% DNA in cellular organic carbon [32,33], giving a total DNA quantity of 5.9 × 1031Mb. Although these orthogonal approaches target different parts of the biosphere and do not resolve groups of organisms in a similar way to the more detailed calculation that forms the core of this paper, the order-of-magnitude estimates they produce agree with our more detailed estimate, lending support to its accuracy and the size of the associated uncertainty.
Assumptions in the Approach
In calculating the total amount of DNA, we are assuming that every base pair is a unique piece of information. One could also estimate the number of DNA base pairs in the total number of unique functional genes in the biosphere to calculate what minimal total amount of DNA would need to be stored to recreate all the transcribed genes on the earth. We view the calcula-tion of the total number of base pairs as a first-order estimate of the informacalcula-tion content of the biosphere to be the right approach for several reasons. All organisms uniquely interact with other organisms and their environment and, thus, viewed as an interconnected web of infor-mation, even two clonal organisms containing two sets of identical DNA contribute to the total information processing in the biosphere. For most organisms, there is a minimum viable popu-lation, below which they become functionally extinct. Therefore, individual organisms, even ones containing substantially the same genetic information, are contributing to the sustainabil-ity of the total information content of the biosphere. In the case of a genuinely redundant or-ganism, its DNA is analogous to stored, back-up information in electronic computing.
Other DNA that was not included in the estimate of the total DNA in the biosphere is chlo-roplast DNA (approximately 0.12–0.2 Mb), mitochondrial DNA (mtDNA, approximately 0.0165 Mb in humans), plasmids (approximately 0.001–1 Mb) and extracellular DNA in the environment. Owing to the small size compared to the nuclear genome size, they are unlikely to have an order-of-magnitude effect on the total DNA estimate we derive. Fossilised DNA is assumed not to be playing a role in the computational capacity of the biosphere. We did not take into account leaf litter, which has been estimated to have a biomass of 122 Gt [7]; assum-ing a plant genome size of 5,958 Mb, this gives a total DNA contained within litter of 7 × 1030 Mb. This material is analogous to old garbage data.
The genome size data used here are derived from different C-value databases. Within each database, the C-values typically come from a variety of sources. The prokaryotic C-values came from a database based on PFGE values, giving a difference in the second significant figure com-pared to a database using sequenced values.
The Computational Power of the Biosphere
Tianhe-2 supercomputer [4], which has a processing power on the order of 105teraFLOPS (tera = 1012). It is estimated that at 37°C, about 25% of Open Reading Frames inEscherichia
coliare being transcribed [36], but this is in a metabolically active population. In the natural en-vironment, the percentage of DNA being transcribed is likely to be much less. Nevertheless, it is clear that even if the total DNA in the biosphere being transcribed at any given time was or-ders of magnitude less, the biosphere has many oror-ders of magnitude more computational power than the fastest electronic computers yet built [4].
DNA in the Biosphere through Time
An information-based view of the biosphere may provide a way to consider the changing com-plexity of the biosphere through time. For example, mass extinctions can be considered to be similar to physical hard drive damage in a computer. This analogy is particularly appropriate to the case of a hard shock caused by asteroid or comet impact, as proposed for the end-Creta-ceous extinction [37]. Although statistics such as the destruction of 75% of life at the end-Cre-taceous boundary are impressive, the true importance of this to the biosphere’s information content and processing power would depend on the genome sizes of extinct organisms, what influence the extinction had on microbial populations, and the effects on DNA transcription rates (altered by changed metabolic states in a stressed biosphere). In analogy to electronic computing, efforts have been made to recover lost information in“de-extinction”attempts, such as recovery of the Pyrenean ibex (Capra pyrenaica pyrenaica) [38]. These efforts to recon-struct software from destroyed hardware are still in their infancy.
Comparing the quantity of DNA in microorganisms, plants, and animals shows that there is a remarkable similarity in size of the contributions, within two orders of magnitude. This simi-larity is surprising, given that prokaryotes evolved at least 3 billion years before plants and ani-mals. The likely reason for this is the larger genome size in eukaryotes. Although the cell numbers in eukaryotes are approximately two to five orders of magnitude lower than the num-ber of prokaryotes (animals by biome: 4.11606 × 1025cells; animals by biomass: 1.28907 × 1026 cells; plants: 2.44730 × 1028cells, compared to prokaryotes: 5 × 1030cells [seeMethods]), the average genome size in prokaryotes is 3.2147 Mb, compared to the higher value in plants (5,958 Mb) and animals (4,456 Mb). The higher genome size in animals and plants may reflect the bioenergetic possibilities in eukaryotes in general that allow for more complex genetic ma-chinery [39].
We might also wonder about the future computational power of the biosphere. In the next billion years or more, will the information content or the computational speed increase, and how will they be distributed amongst the major domains and subgroups of life? Eventually, when the sun’s luminosity increases sufficiently and the planet moves towards a greenhouse state, animal and plant computational contributions will be destroyed and prokaryote computa-tional power will deteriorate as conditions on the planet become more extreme [40]. Ultimately, even the last vestiges of microbial life will diminish to a point at which their populations can no longer be sustained. At that point, the biosphere supercomputer will be destroyed.
Uncertainties and Future Questions
classes of genome size. We found a surprising lack of large-scale surveys of biomass densities in different biomes and across different groups, particularly for fungi and unicellular eukaryotes, and to a lesser extent for animals, plants, and prokaryotes. Uncertainties arise in converting biomass estimates into DNA quantity because of the lack of data on cell mass, which is almost absent from the literature, and also from uncertainties in biomass and C-values. Seasonal changes in the biomass of life are also poorly understood. Despite impressive advances in mo-lecular biology and genome sequencing of species, our analysis emphasises that we still lack very fundamental data about the biomass of different types of life on Earth and their distribu-tion, which is essential for refining estimates of the information content of the biosphere.
For all organisms, a ploidy level of 1 was assumed, as average ploidy levels across groups are poorly constrained. The exception to this is for animals, for which a ploidy level of 2 was used, as animals are virtually always diploid. C-values, by definition, refer to a haploid (monoploid) cell, but the nomenclature on this topic is somewhat ambiguous [41]. Treating all groups ex-cept animals as monoploid underscores the fact that our estimate is a lower bound. For plants and fungi, in which ploidy levels vary from one to a few during the life cycle, the effect is un-likely to have an order of magnitude effect. The fungal and plant genome databases used in this study gives an average fungal ploidy of 2.6 and an average plant ploidy of 2.9. Only for prokary-otes is a greater variation observed. Bacterial ploidy varies from monoploid to about 120 copies of the genome per cell in one known case with an apparent minority of bacterial species having true monoploidy. Most surveyed species of bacteria have a ploidy of less than ten, hence the ef-fect on the total estimated quantity of DNA would be less than an order of magnitude [42]. The situation is much the same for archaea, with some haloarchaea shown to have between 10–25 copies of the genome, determined by growth stage [43]. We know very little about the distribution of ploidy levels in different biomes and in different organisms in the natural envi-ronment. Improving our understanding of the global environmental distribution of ploidy would go far to improve the quantification of the total DNA in the biosphere.
To advance our understanding of the processing power of the biosphere we need more de-tailed data on transcription rates in organisms in the natural environment. Most studies that examine transcription are laboratory-based. Although the reasons for this can be understood— laboratory organisms are more tractable and more amenable to the complex apparatus needed to measure transcription rates—a systematic study of transcription in the natural environment would yield much information not just about the processing power in the biosphere but also about the general physiological state and activity of genetic systems in the wild. This would allow us to make a more accurate assessment of the NOPS of the biosphere.
There are a number of other worthwhile calculations that could be undertaken. A calcula-tion of the total quantity of DNA being replicated in the biosphere, coupled with error rates in different organisms, would give us a new quantitative way to measure the rates of production of variation in the biosphere—the raw material on which evolutionary selection pressures act. This would provide a way to quantify the process of evolution at the planetary scale. To accom-plish this successfully, we need to know a great deal more about DNA replication rates in di-verse organisms from prokaryotes to animals in different environments and biomes around the world and DNA error rates in the natural environment under different conditions. An esti-mate of the total DNA in the biosphere is the first step in that direction.
In summary, the information, or DNA, approach to understanding the biosphere offers a new way to approach a quantitative analysis of the biosphere that impinges on a number of areas of environmental and biological sciences, including evolutionary biology, biomass pro-duction rates, and biological computational capacity. This approach may help us understand the changing complexity of the biosphere over time and to predict in new ways, both anthropo-genic and natural, future changes in the biosphere.
Supporting Information
S1 Fig. Calculating total DNA.The calculation method used to work out the DNA quantity (Mb) per major group of organisms using either organism density or number data from the lit-erature, as described in detail here.
(TIF)
S2 Fig. Distribution of genome sizes used in calculations.Values used in calculations are highlighted in red. a) Prokaryote genome sizes extracted by the PFGE method. b) Distribution of genome sizes extracted by complete sequencing. c) Distribution of plant genome sizes. d) Distribution of animal genome sizes. e) Distribution of viral genome sizes. f) Distribution of algal genome sizes. g) Distribution of protist genome sizes. h) Distribution of fungal genome sizes.
(TIF)
S1 Methods. Methods of calculating total DNA with errors and uncertainties.
(DOCX)
S1 Table. Animal number counts and biomass estimates.The total weights of termites, fish, and krill were calculated using density estimates; hence values of the numbers of individuals and mass of individuals are not included.
(XLSX)
S2 Table. Area and animal biomass density applied to different biomes.
(XLSX)
S3 Table. Including all uncertainties.The uncertainty for the quartiles was achieved by taking the difference between each quartile and the mean, represented here. The standard deviation listed is the standard deviation of a smaller, symmetric range around the mean. The exception to these uncertainties is prokaryotes, where the first and second uncertainties correspond to the Kallmeyer et al. and Whitman et al. ranges, respectively.
(XLSX)
Acknowledgments
We thank Dr. Catherine Heymans for advice and assistance during this work.
References
1. Pimm SL, Jenkins CN, Abell R, Brooks TM, Gittleman JL, Joppa LN, et al. The biodiversity of species and their rates of extinction, distribution, and protection. Science. 2014. 344: 1246752. doi:10.1126/ science.1246752PMID:24876501
2. Kolbert E. The Sixth Extinction: An Unnatural History. New York: Henry Holt and Company; 2014.
3. Dolezel J, Bartos J, Voglmayr H, Greilhuber J. Nuclear DNA content and genome size of trout and human. Cytometry A. 2003; 51: 127–128. PMID:12541287
5. Whitman WB, Coleman DC, Wiebe WJ. Prokaryotes: The unseen majority. Proc Natl Acad Sci USA. 1998; 95: 6578–6583. PMID:9618454
6. Gregory TR. Prokaryote genome sizes Table 1; 2005. Database: genomesize.http://www.genomesize. com/prokaryotes/table1/. Accessed 18 May 2015.
7. Wang YP, Law RM, Pak B. A global model of carbon, nitrogen and phosphorus cycles for the terrestrial biosphere. Biogeosci Discussions. 2009; 6: 9891–9944.
8. Duchesne LC, Larson DW. Cellulose and the evolution of plant life. BioScience 1989; 39: 238–241.
9. Rodell M, Chao BF, Au AY, Kimball JS, McDonald KC. Global biomass variation and its geodynamic ef-fects: 1982–98. Earth Interact. 2005; 9: 1–19.
10. Adapted from prokaryotic cell mass of 2 x 10–13g and assuming eukaryotic cells are 10 times larger by length, from Whitman WB, Coleman DC, Wiebe WJ. Prokaryotes: The Unseen Majority. P. Natl. Acad. Sci. USA. 1998; 95: 6578–6583. PMID:9618454
11. Bennett MD, Leitch IJ. Plant DNA C-values database (Release 6.0, Dec. 2012); 2012. Database: data. kew.http://data.kew.org/cvalues/. Accessed 18 May 2015.
12. Zimmer C. How Many Cells Are In Your Body? 2013 October 23 [cited 23 April 2015]. In: Phenomena: The Loom [Internet]. National Geographic Society.http://phenomena.nationalgeographic.com/2013/ 10/23/how-many-cells-are-in-your-body/. Accessed 18 May 2015.
13. Gregory TR. Animal genome size database; 2014. Database: genomesize.http://www.genomesize. com/. Accessed 18 May 2015.
14. Berthold A, Palzenberger M. Comparison between direct counts of active soil ciliates (Protozoa) and most probable number estimates obtained by Singh's dilution culture method. Biol Fert Soil. 1995; 19: 348–356.
15. Robinson BS, Bamforth SS, Dobson PJ. Density and diversity of protozoa in some arid Australian soils. J Eukaryot Microbiol. 2002; 49(6): 449–453. PMID:12503679
16. Bamforth SS. Protozoa from aboveground and ground soils of a tropical rain forest in Puerto Rico. Ped-obiologia. 2007; 50: 515–525.
17. Esteban GF, Clarke KJ, Olmo JL, Finlay BJ. Soil protozoa—an intensive study of population dynamics and community structure in an upland grassland. Appl Soil Ecol. 2006; 33: 137–151.
18. Bamforth SS. Distribution of and insights from soil protozoa of the Olympic coniferous rain forest. Pedo-biologia. 2010; 53: 361–367.
19. Bamforth SS. Protozoa of biological soil crusts of a cool desert in Utah. Journ Arid Environ. 2008; 72: 722–729.
20. Rahman MM, Jewel MAS, Khan S, Haque MM. Study of euglenophytes bloom and its impact on fish growth in Bangladesh. Algae 2007; 22: 185–192.
21. Kapraun DF, Leitch IJ, Bennett MD. Algal DNA C-value database (Release 1.0, Dec. 2004); 2004. Da-tabase: data.kew.http://data.kew.org/cvalues/. Accessed 18 May 2015.
22. European Bioinformatics Institute (2013) Ensembl protists species; 2013. Database: ensembl.http:// protists.ensembl.org/info/about/species.html. Accessed 18 May 2015.
23. Kullman B, Tamm H, Kullman K. Fungal genome size database; 2005. Database: zbi.http://www.zbi. ee/fungal-genomesize/. Accessed 18 May 2015.
24. Griffin DW. The quest for extraterrestrial life: what about the viruses? Astrobiology. 2013; 13: 774–783. doi:10.1089/ast.2012.0959PMID:23944293
25. National Center for Biotechnology Information. Entrez genome viral genomes, 2014. Database: ncbi. nlm.nih.https://www.ncbi.nlm.nih.gov/genomes/GenomesHome.cgi?taxid=10239. Accessed 18 May 2015.
26. DeFlaun MF, Paul JH, Jeffrey WH. Distribution and molecular weight of dissolved DNA in subtropical estuarine and oceanic environments. Mar Ecol Prog Ser. 1987; 38(1): 65.
27. The Water Cycle: The Oceans. U. S. Geological Survey. 2014.http://water.usgs.gov/edu/ watercycleoceans.html. Accessed 18 May 2015.
28. Zhou J, Bruns MA, Tiedje JM. DNA recovery from soils of diverse composition. Appl Environ Microbiol 1996; 62(2); 316–322. PMID:8593035
29. Plassart P, Terrat S, Thomson B, Griffiths R, Dequiedt S, Lelievre M, et al. Evaluation of the ISO Stan-dard 11063 DNA extraction procedure for assessing soil microbial abundance and community struc-ture. PLoS ONE 2012; 7(9): e44279. doi:10.1371/journal.pone.0044279PMID:22984486
31. Falkowski P, Scholes RJ, Boyle E, Canadell J, Canfield D, Elser J, et al. The global carbon cycle: A test of our knowledge of Earth as a system. Science. 2000; 290(5490): 291–296. PMID:11030643
32. Holm-Hansen O. Algae: amounts of DNA and organic carbon in single cells. Science. 1969; 163(3862): 87–8. PMID:5812598
33. Bergeron JP, Person-Le Ruyet J, Koutsikopoulos C. Use of carbon rather than dry weight to assess the DNA content and nutritional condition index of sole larvae. ICES J Mar Sci. 1997; 54(1), 148–151.
34. Pérez-Ortín JE, Alepuz PM, Moreno J. Genomics and gene transcription kinetics in yeast. Trends Genet. 2007; 23: 250–257. PMID:17379352
35. Rogers SO. Integrated Molecular Evolution. Florida: CRC Press; 2011.
36. Richmond CS, Glasner JD, Mau R, Jin H, Blattner FR. Genome-wide expression profiling inEscherichia coliK-12. Nucleic Acids Res 1999; 27: 3821–3835. PMID:10481021
37. Schulte P, Alegret L, Arenillas I, Arz JA, Barton PJ, Bown RR, et al. The Chicxulub asteroid impact and mass extinction at the Cretaceous-Paleogene boundary. Science. 2010; 327: 1214–1218. doi:10. 1126/science.1177265PMID:20203042
38. Folch J, Cocero MJ, Chesné P, Alabart JL, Domínguez V, Cognié Y, et al. First birth of an animal from an extinct subspecies (Capra pyrenaica pyrenaica) by cloning. Theriogenology. 2009; 71: 1026–1034. doi:10.1016/j.theriogenology.2008.11.005PMID:19167744
39. Lane N, Martin W. The energetics of genome complexity. Nature. 2010; 467: 929–934. doi:10.1038/ nature09486PMID:20962839
40. O’Malley-James JT, Greaves JS, Raven JA, Cockell CS. Swansong biospheres: refuges for life and novel microbial biospheres on terrestrial planets near the end of their habitable lifetimes. Int Journ Astrobiol. 2013; 12: 99–112.
41. Greilhuber J, Doležel J, Lysák MA, Bennett MD. The origin, evolution and proposed stabilization of the terms‘Genome Size’and‘C-Value’to describe nuclear DNA contents. Ann Bot. 2005; 95(1): 255–260 PMID:15596473
42. Pecoraro V, Zerulla K, Lange C, Soppa J. Quantification of ploidy in Proteobacteria revealed the exis-tence of monoploid, (mero-)oligoploid and polyploid species. PLoS ONE. 2011; 6(1): e16392. doi:10. 1371/journal.pone.0016392PMID:21305010