1
X-ray Photoelectron Spectroscopy Study of the Passive Films formed on Thermally Sprayed and Wrought Inconel 625.
M.S. Bakare, K.T. Voisey, M.J. Roe, D.G. McCartney Materials, Mechanics and Structures Research Division,
Faculty of Engineering, University of Nottingham, Nottingham, NG7 2RD, UK. Corresponding Author: Katy.voisey@nottingham.ac.uk Tel: +44 115 951 4139
Abstract
There is a well known performance gap in corrosion resistance between thermally sprayed corrosion resistant coatings and the equivalent bulk materials. Interconnected porosity has an important and well known effect, however there are additional relevant microstructural effects. Previous work has shown that a compositional difference exists between the regions of resolidified and non-melted material that exist in the as-sprayed coatings. The resolidified regions are depleted in oxide forming elements due to formation of oxides during coating deposition. Formation of galvanic cells between these different regions is believed to decrease the corrosion resistance of the coating. In order to increase understanding of the details of this effect, this work uses X-ray photoelectron spectroscopy (XPS) to study the passive films formed on thermally sprayed coatings (HVOF) and bulk Inconel 625, a commercially
available corrosion resistant Ni-Cr-Mo-Nb alloy. Passive films produced by potentiodynamic scanning to 400mV in 0.5M sulphuric acid were compared with air formed films. The poorer corrosion performance of the thermally sprayed coatings was attributed to Ni(OH)2, which forms a loose, non-adherent and therefore non-protective film. The good corrosion resistance of wrought Inconel 625 is due to formation of Cr, Mo and Nb oxides.
2
1 Introduction
Inconel 625 is a solid solution strengthened nickel-based corrosion resistant alloy which is widely used as a thermally sprayed coating for corrosion protection of components in thermal and nuclear energy environments as well as other aqueous corrosive environments [1].
Thermally sprayed corrosion resistant coatings are widely used to enhance corrosion resistance. Such coatings do usefully improve corrosion resistance, however, there is a well established performance gap between the coating and the equivalent bulk material [2-5]. This is attributed to the characteristic microstructure of the thermally sprayed coating. Thermally sprayed coatings are built up from the successive impacts of partially or fully melted
particles. This results in a distinctive lamellar structure which includes some porosity and regions of resolidified material. Oxides may also be incorporated into the coating since, depending on the thermal spraying technique used, the hot particles can partially oxidise as they travel between the spray gun and the substrate.
3
Previous XPS work on Inconel 625 has mainly focused on the analysis of oxides formed on wrought material in corrosive and oxidising environments such as supercritical water reactors [7]. Under such conditions a duplex scale with a thickness of the order of 1 micron is formed, with an outer layer including the Ni containing compounds NiO, Ni(OH)2 and NiCr2O4 [7]. Ni(OH)2 was also detected in the outer layer of the oxide film formed in a heated, 250-200ºC, lithium borate buffer solution [8]. The work presented in this paper considers air grown films, these are significantly thinner with typical thicknesses of a few nanometers [9]. Lloyd et al. [9] report the presence of NiO, Cr2O3 and MoO3 in the air formed film on Inconel 625. Neville and Hodgkiess [10] report Fe2+ and Fe3+ oxides as well as signals from Cr oxide and Mo oxide in the air formed film, but state that no Ni oxides or hydroxides were detected. It is possible that Lloyd et al. [9] detected metallic Ni in the underlying alloy below the thin air formed oxide layer, this would be consistent with their SIMS observation of Ni enrichment at the alloy surface. No published work on compositional analysis of passive films on HVOF sprayed Inconel 625 has been found. The aim of this paper is to use XPS to analyse the passive films on wrought and high velocity oxy-fuel (HVOF) thermally sprayed Inconel 625. Both air formed films and the films formed due to potentiodynamic polarisation to the passive region are included.
2 Experimental Procedures
2.1 Materials and Sample Preparation
4
2.2 Thermal spraying process
Inconel 625 HVOF coatings were deposited on 60x40x5 mm mild steel substrates using a metjet-II HVOF spray gun from Metallisation Limited, Dudley. The spraying conditions for the coating are stated in Table 2. Before coating deposition, the substrates were cleaned with detergent, degreased with industrial methylated spirit and grit blasted with brown alumina grit.
2.3 Corrosion tests
Potentiodynamic polarisation scans in 0.5M H2SO4 were carried out using an ACM
Instruments potentiostat. The experiment was set up according to ASTM standard G5-94 with a three electrode cell: working electrode (WE), platinum auxiliary electrode (AE) and
calomel reference electrode (RE). For both wrought alloy and coated samples, the surfaces were polished to 1µm with approximately 1cm2 area exposed to electrolyte. Nitrogen gas was used to purge the solution to remove oxygen dissolved in it. Stabilisation at open circuit potential was carried out for 1h before polarisation. The potentiodynamic scan was performed at a temperature of 30oC with a 20mV/min sweep rate. Full polarisation curves, up to a
5
region at a potential of 400mV for all samples, as shown in
Figure 1.
2.4 Sample characterisation
Each of the samples was observed after etching in aqua regia solution for about 10 seconds: solution containing 3 volumes of 37% HCl and 1 volume of 69% HNO3, heated to 30-40oC. Samples were characterised using SEM and optical microscopy.
Oxygen content analysis was carried out by London and Scandinavian Metallurgical Co. Ltd, Rotherham, UK with their TC-436AR analyser.
Porosity of the coatings was determined by image analysis of cross-sectional images using ImageJ software. The standard errors shown were obtained from 5 repeats of measurements.
2.5 X-ray photoelectron spectroscopy measurement
6
before and after potentiodynamic polarisation to 400mV. The time between the end of corrosion testing and samples being placed into the XPS was approximately 10 minutes.
The instrument used was a VG Scientific ESCALab Mark I photoelectron spectrometer utilising non-monochromatic AlKα with excitation energy of 1486.6eV and a vacuum
pressure of approximately 1 x 10⁻⁹ mbar. Charge correction was made with respect to the C1s peak at 285 eV.
The survey spectra of the specimens cover the full range of binding energies (0 to 1100 eV). High resolution spectra for Ni and Cr were obtained from the most intense photoelectron line: the Ni2p and Cr2p doublets, with individual scans covering the full range of the 2p3/2 and 2p1/2 doublets separation, 848-880eV and 570-592eV for Ni and Cr respectively. High resolution scans for Mo and Nb were carried out at 225-240eV and 202-213eV respectively in order to cover the 3d doublets, the most intense photoelectron lines for these elements.
Data reduction and peak fitting of the Ni2p, Cr2p, Mo3d and Nb3d regions were made using the CasaXPS software package, with peak deconvolution carried out using a Gaussian-Lorentzian (30:70) peak shape and a non-linear (Shirley) background model. The binding energies and peak shapes were used to identify the species present. The area ratios allow, for a given element, the relative proportions of atoms in each different binding state to be determined (see appendices).
3 Results
7
The microstructure of wrought Inconel 625 is shown in
Figure 2. Previous analysis of the same material by Ahmed et al. [6], show it to be a -Ni
based alloy with a face centred cubic structure containing a small amount of second phase particles present. These particles contain Ti and Nb and attributed as carbides, nitrides or carbonitrides [6]. The presence of sub-grains and twins is indicative of prior cold rolling and annealing [6].
The as-sprayed coating had a thickness of 350-400µm (Figure 3a). The coating is built up from the successive impacts of individual powder particles that are heated and accelerated towards the substrate by the spraying process. On arrival at the substrate the particles are fully or partially molten. On impact molten material spreads out and resolidifies whereas non-molten material deforms and adheres mainly by mechanical interlocking. The coating
microstructure shown in Figure 3b is typical of HVOF metallic coatings and has been discussed in detail in previous work [4]. Individual particles, or splats, can be seen, it is also clear that the coating consists of two distinct types of material: deformed non-melted material and areas of resolidified material. Previous work [6] has identified a difference in the
8
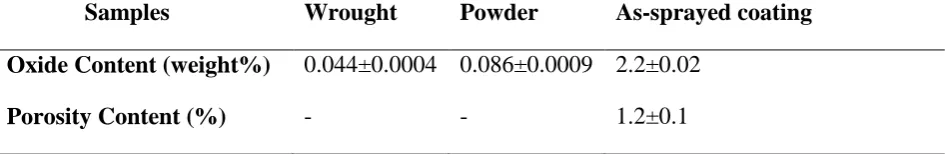
the coating also has some oxide and porosity content. These were determined to be
2.2 0.02 wt % and 1.2 0.1 vol % respectively (Table 3), values typical of HVOF sprayed metallic coatings. Oxide content was determined from the oxygen content results from London and Scandinavian Metallurgical Co. Ltd, assuming that all oxygen present was in the form of Cr2O3. This assumption is based on previous work that has identified the oxide formed during spraying as Cr2O3 [4, 6].
3.2 Potentiodynamic polarisation results
The potentiodynamic results shown in
Figure 1 confirm the performance gap between the HVOF sprayed Inconel 625 coating and the wrought material. The Ecorr values for all samples are similar, falling in the range of -190 to -280 mV. The greater variation seen for the coated samples is attributed to the sample to sample variation in microstructure that is expected of thermally sprayed coatings. Both versions of the material show a passive region, however the corrosion current density in this region is significantly greater for the coating than for the wrought material. Observed current densities are 0.002 mA cm-2 and 0.050 mA cm-2 for the wrought material and sprayed coating respectively.
9
Figure 4 and Figure 5 show the XPS survey spectra with peaks of nickel, chromium, molybdenum, niobium, carbon and oxygen clearly visible. Both Auger and photoelectron peaks are labelled, however only photoelectron peaks are used in the following analysis.
The experimental binding energy values of O1s, C1s, Ni2p, Cr2p, Mo3d and Nb3d all matched well with the reference database values. Using the reference binding energies for possible oxide structures, peaks corresponding to NiO, Cr2O3, MoO2, MoO3, NbO and Nb2O5 were identified in both the wrought and coated samples, details of the species identified are presented in Appendix A and Appendix B. Charge correction was performed with respect to the C1s peak at 285eV, which was common to all samples and was attributed to adventitious carbon contamination [11]. The satellite peak of the Ni2p region both for the metal and oxide form is a well known feature associated with some elements such as Ni [12], however our analysis only considers the main photoelectric peaks. Detailed interpretation of the Mo peak was complicated due to overlapping of the oxide peaks [13], hence we restricted our
comments on Mo to the relative contributions of the metallic and total Mo oxide contributions.
3.3.1 Samples before polarisation corrosion test
Metallic peaks of Ni2p, Cr2p and Mo3d as well as their corresponding oxides were seen in both samples. No metallic peak of Nb3d was detected in either the coating or the wrought alloy.
10
The Cr2p spectra in
Figure 6 and Figure8 are composed of a doublet peak corresponding to Cr2+. The binding energy of 577eV identified this as Cr2O3. Peak area ratios indicated that the majority of the Cr present at the surface was oxidised, 88% of surface Cr in the coating was present as Cr2O3, compared to about 79% in wrought alloy. Fitting of the Nb3d single peak in the high
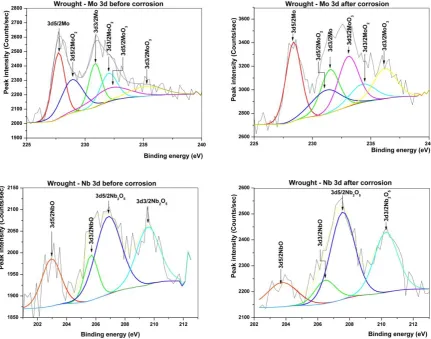
resolution spectra in Figure 7 and Error! Reference source not found.Figure 8 and at 205.42eV showed that it was formed from contributions from Nb2+ and Nb5+, present in NbO and Nb2O5 respectively. No peak corresponding to the metallic state (Nb0) was observed in either of the two samples. MoO2 and MoO3 were assigned in both samples along with metallic Mo. The proportion of Mo in the metallic state was 41% for the wrought material and 63% for the coating.
[image:10.595.76.508.74.430.2]11
3.3.2 Wrought alloy after polarisation corrosion test
The O 1s peak intensity and area were increased after polarisation, indicating more extensive oxidation. NiO was again the only nickel oxide identified. Area ratio results showed an increase in the proportion of Ni in the metallic state, from 61.1 to 73.6% after polarisation. The opposite effect was seen for Cr where the proportion of oxidised Cr increased from 79.6 to 83.3% after polarisation. The area ratio for Nb2O5 : NbO for 3d5/2 dramatically increased from 1.9 to 4.7 after polarisation, indicating oxidation of Nb2+ to Nb5+, to form Nb2O5, a more stable oxide of Nb. There was no significant difference between the metallic peaks of
molybdenum before and after corrosion (Figure 7).
3.3.3 Coating after polarisation corrosion test
As for the wrought material, the O1s peak intensity and area were increased after
polarisation, indicating more extensive oxidation. There was little difference in the peak area ratios of Cr before and after polarisation, as shown in the high resolution spectra of Cr2p3/2 and Cr2p1/2 (Figure 8).
With regard to the Ni2p region, the distinct peak at a binding energy corresponding to 856.5eV was attributed to Ni(OH)2 [7]. The XPS spectra again showed the presence of NiO.
There was a dramatic, ~50%, decrease in the proportion of metallic Mo and a corresponding increase in the total proportion of MoO2 and MoO3 (Figure 9).
As was the case before polarisation, no metallic Nb peak was observed. The Nb3d5/2 peak area ratio of Nb2O5 : NbO increased from 2 to about 15 after polarisation.
12
NiO, Cr2O3, MoO2, MoO3, NbO and Nb2O5 oxides were detected on samples of both wrought and coated Inconel 625 before polarisation. These are attributed to the air-formed film formed between sample polishing and XPS measurement and are consistent with previously reported XPS results from air-formed oxides on a nickel based alloy [14].
Previous XPS work on Inconel 625 has mentioned the Fe2p photoelectron peak at 707-720eV, however that peak is a minor feature in the spectra in this work, just visible as a shoulder on the Ni LMMb Auger peak in Figure 5a, and therefore has not been considered in our analysis.
Following polarisation of the wrought material the O1s peak increased indicating more extensive oxidation, however no additional species were detected. Some changes to the passive layer were noted. A larger proportion of the Cr2p peak was due to Cr2O3 whereas the metallic contribution to the Ni peak increased. There was also evidence of more extensive oxidation of Nb to Nb2O5, a compound that has previously been reported in XPS analysis of Inconel 625, albeit exposed to different conditions [15].
For the coating, polarisation in acid again increased the O1s peak, again indicating an increased extent of oxidation. This was consistent with the decreased proportion of the Mo peak attributed to metallic Mo and increased proportion of Nb2O5. In addition to this an extra peak, at 856.5eV was detected. This peak was attributed to Ni(OH)2, a compound that was not detected in any of the other spectra recorded in this work. Its identification is supported not only by the binding energy value but also the relatively larger size of its satellite peak [16].
13
the sprayed coating compared to the wrought material [6]. Following the XPS results presented in this work it is suggested that during polarisation Ni(OH)2 forms in these localised regions. Ni(OH)2 is not as stable or as protective as the Cr, Mo and Nb oxides [13, 15]. Hence the presence of localised regions of Ni(OH)2 limits the effectiveness of the passive film. This is consistent with the potentiodynamic results obtained in this work
(
Figure 1), which indicate that the passive corrosion current density of the polarised coating is almost two orders of magnitude greater than that of the wrought material.
Summary and Conclusions
Previous work established that the performance gap in corrosion resistance between HVOF coatings and the corresponding bulk alloy was due to localised areas of different
compositions formed by partial oxidation during coating formation [6]. The formation of Ni(OH)2 on the polarised HVOF Inconel 625 coatings is attributed to these localised areas. Since Ni(OH)2 does not form a protective, adherent, oxide the passive film is compromised and the corrosion resistance is inferior to that of the wrought material. The good corrosion resistance of wrought Inconel 625 is due to formation of Cr, Mo and Nb oxides.
The air formed film on Inconel 625 consists of a mixture of NiO, Cr2O3, MoO2, MoO3, NbO and Nb2O5.
14
The poorer corrosion resistance of the coating is attributed to the formation of loose, non-adherent non-protective Ni(OH)2 during polarisation, in addition to the other oxides listed above.
15
References
[1] V. Shankar, K. B. S. Rao and S. L. Mannan, J Nuc Mat 288 (2001) 222.
[2] D. Chidambaram, C. R. Clayton and M. R. Dorfman, Surf Coat Tech 176 (2004) 307. [3] D. A. Walsh, L. E. Li, M. S. Bakare and K. T. Voisey, Electrochimica Acta 54 (2009) 4647.
[4] D. Zhang, S. J. Harris and D. G. McCartney, Mat Sci Eng A 344 (2003) 45. [5] A. Neville, J. M. Perry, T. Hodgkiess and H. P. Chau, Proc Instn Mech Engrs 214 (2000) 41.
[6] N. Ahmed, M. S. Bakare, D. G. McCartney and K. T. Voisey, Surf Coat Tech 204 (2010) 2294.
[7] M. Sun, X. Wu, Z. Zhang and E.-H. Han, J Supercritical Fluids 47 (2008) 309. [8] H. Sun, X. Wu and E.-H. Han, Cor Sci 51 (2009) 2565.
[9] A. C. Lloyd, J. J. Noël, S. McIntyre and D. W. Shoesmith, Electrochimica Acta 49 (2004) 3015.
[10] A. Neville and T. Hodgkiess, British Corrosion Journal 35 (2000) 183. [11] P. Swift, Surface and Interface Analysis 4 (1982) 47.
[12] J. F. Moulder, W. F. Stickle, P. E. Sobol and K. D. Bomben, Handbook of X Ray Photoelectron Spectroscopy: A Reference Book of Standard Spectra for Identification and Interpretation of XPS Data (Eden Praire Minn., 1995).
[13] K. S. K. Danadurai, T. M. Sridhar, S. V. Narasimhan and S. Rajeswari, J Solid State Electrochemistry 4 (2000) 159.
[14] R. S. Dutta, Jagannath, G. K. Dey and P. K. De, Cor Sci 48 (2006) 2711. [15] L. Tan, X. Ren, K. Sridharan and T. R. Allen, Cor Sci 50 (2008) 3056.
16
Tables
Elements Ni Cr Mo Nb Fe C Mn Si Al Ti
Wrought(wt %) Bal. 20.9 9.13 3.41 3.27 0.01 0.07 0.07 0.1 0.21
Powder(wt %) Bal. 21 9 3.46 0.12 0.03 0.1 0.1 - -
Table 1: Percentage weight chemical composition of Inconel 625
Oxygen Fuel Nitrogen Nozzle Spray Powder Number
flow rate flow rate flow rate length distance feed rate of
(l/min) (l/min) (l/min) (mm) (mm) (g/min) passes
[image:16.595.67.489.231.334.2]910 0.48 4.6 100 350 78.7 24
Table 2: HVOF coating spraying conditions
Samples Wrought Powder As-sprayed coating
Oxide Content (weight%) 0.044±0.0004 0.086±0.0009 2.2±0.02
[image:16.595.67.540.376.453.2]Porosity Content (%) - - 1.2±0.1
17
Figure captions
Figure 1: Potentiodynamic curves of samples showing the performance gap between wrought
[image:17.595.73.300.357.542.2]material and HVOF coating as well as the cut-off potentials of samples for XPS analysis.
18
Figure 3: SEM image showing microstructure of the as-sprayed HVOF coating (a) low
magnification cross-sectional image showing full coating thickness (b) higher magnification
[image:18.595.89.496.327.482.2]cross-sectional image showing splat structure.
Figure 4: XPS survey spectra of wrought alloy before and after polarisation corrosion test.
[image:18.595.88.496.550.700.2]19
Figure 6: XPS high resolution spectra of Ni2p and Cr2p of wrought alloy before and after
20
Figure 7: XPS high resolution spectra of Mo3d and Nb3d for wrought alloy before and after
21
Figure 8: XPS high resolution spectra of Ni2p and Cr2p for HVOF coating before and after
22
Figure 9: XPS high resolution spectra showing peaks of Mo3d for HVOF coating before and
after polarisation corrosion test.
23
Wrought before Corrosion Wrought after Corrosion
Sample Binding Proposed
At. %
%
area Binding Proposed
At.
% % area
spectrum energy species of energy species of
(eV) peak (eV) Peak
530.42 O 1s 50.1 531.38 O 1s 62.2
Survey 852.42 Ni 2p3/2 27.5 852.38 Ni 2p3/2 14.6
spectrum 576.42 Cr 2p 16.0 577.38 Cr 2p 17.2
230.42 Mo 3d 4.6 231.38 Mo 3d 4.4
205.42 Nb 3d 1.8 206.38 Nb 3d 1.7
High res 852.68 2p 3/2Ni 46.3 853.17 2p 3/2Ni 47.2
spectrum 855.17 2p 3/2NiO 13.3 855.30 2p 3/2NiO 11.8
Ni2p 858.48 2p 3/2Ni SAT 4.6 858.97 2p 3/2Ni SAT 4.3
860.17 2p 3/2NiO SAT 2.0 860.30 2p 3/2NiO SAT 2.9
869.82 2p 1/2Ni 23.6 870.34 2p 1/2Ni 24.1
873.17 2p 1/2NiO 6.8 873.83 2p 1/2NiO 6.0
875.62 2p 1/2Ni SAT 2.2 876.18 2p 1/2Ni SAT 2.2
877.00 2p 1/2NiO SAT 1.0 877.33 2p 1/2NiO SAT 1.5
High res 573.98 2p 3/2Cr 16.4 573.96 2p 3/2Cr 6.6
spectrum 583.18 2p 1/2Cr 8.3 583.16 2p 1/2Cr 3.3
Cr2p 576.79 2p 3/2Cr2O3 50.1 577.14 2p 3/2Cr2O3 59.9
586.99 2p 1/2Cr2O3 25.2 586.34 2p 1/2Cr2O3 30.2
High res 227.73 3d 5/2Mo 24.3 228.38 3d 5/2Mo 24.7
spectrum 230.86 3d 3/2Mo 16.1 231.51 3d 3/2Mo 16.6
Mo3d 228.90 3d 5/2MoO2 21.3 231.17 3d 5/2MoO2 14.4
232.03 3d 3/2MoO2 14.1 234.30 3d 3/2MoO2 9.6
232.10 3d 5/2MoO3 14.6 233.09 3d 5/2MoO3 20.8
235.23 3d 3/2MoO3 9.7 236.22 3d 3/2MoO3 14.0
High res 202.96 3d 5/2NbO 18.8 203.76 3d 5/2NbO 15.5
spectrum 205.68 3d 3/2NbO 12.6 206.48 3d 3/2NbO 10.4
Nb3d 206.85 3d 5/2Nb2O5 41.1 207.56 3d 5/2Nb2O5 44.4
209.57 3d 3/2Nb2O5 27.6 210.28 3d 3/2Nb2O5 29.8
Appendix A: Showing XPS detailed results for wrought alloy before and after polarisation corrosion test.
As-sprayed HVOF coating before corrosion
As-sprayed HVOF coating after Corrosion
Sample Binding Proposed At.
%
24
% %
spectrum energy species of energy species of
(eV) peak (eV) peak
530.38 O 1s 47.0 531.83 O 1s 64.9
Survey 852.38 Ni 2p3/2 30.2 852.83 Ni 2p3/2 12.2
spectrum 576.38 Cr 2p 16.8 576.83 Cr 2p 16.8
230.38 Mo 3d 4.2 232.83 Mo 3d 3.8
206.38 Nb 3d 1.8 206.83 Nb 3d 2.3
High res 852.38 2p 3/2Ni 44.2 853.03 2p 3/2Ni 31.6
spectrum 854.34 2p 3/2NiO 13.0 855.21 2p 3/2NiO 14.0
Ni2p 858.18 2p 3/2Ni SAT 6.8 856.91 2p 3/2Ni(OH)2 19.9
859.34
2p 3/2NiO
SAT 2.2 858.83 2p 3/2Ni SAT 4.8
869.70 2p 1/2Ni 22.5 860.21 2p 3/2NiO SAT 3.0
873.00 2p 1/2NiO 6.6 861.91 2p 3/2Ni(OH)2 SAT 9.8
875.50 2p 1/2Ni SAT 3.5 870.00 2p 1/2Ni 11.0
878.00
2p 1/2NiO
SAT 1.1 873.32 2p 1/2NiO 2.3
874.32 2p 1/2Ni(OH)2 3.6
High res 573.51 2p 3/2Cr 7.6 573.60 2p 3/2Cr 3.7
spectrum 582.71 2p 1/2Cr 3.8 582.80 2p 1/2Cr 1.9
Cr2p 576.26 2p 3/2Cr2O3 58.9 576.88 2p 3/2Cr2O3 62.8
585.46 2p 1/2Cr2O3 29.7 586.33 2p 1/2Cr2O3 31.6
High res 227.57 3d 5/2Mo 38.0 228.22 3d 5/2Mo 12.7
spectrum 230.70 3d 3/2Mo 25.2 231.35 3d 3/2Mo 8.5
Mo3d 229.13 3d 5/2MoO2 10.0 229.94 3d 5/2MoO2 12.3
232.26 3d 3/2MoO2 6.6 232.07 3d 3/2MoO2 8.3
232.39 3d 5/2MoO3 12.1 232.69 3d 5/2MoO3 34.8
235.52 3d 3/2MoO3 8.0 235.82 3d 3/2MoO3 23.4
High res 202.59 3d 5/2NbO 17.1 203.25 3d 5/2NbO 12.4
spectrum 205.31 3d 3/2NbO 11.5 205.97 3d 3/2NbO 8.3
Nb3d 206.21 3d 5/2Nb2O5 42.7 207.36 3d 5/2Nb2O5 47.4
208.93 3d 3/2Nb2O5 28.7 210.08 3d 3/2Nb2O5 31.8