doi:10.4236/cn.2009.11008 Published Online August 2009 (http://www.scirp.org/journal/cn)
The Identification of Frequency Hopping Signal
Using Compressive Sensing
Jia YUAN1, Pengwu TIAN2, Hongyi YU
Department of Communication Engineering, Institute of Information Technology, Zhengzhou, Henan, China Email:1 hyajia@126.com;2 tpw0802@163.com
Abstract: Compressive sensing (CS) creates a new framework of signal reconstruction or approximation from a smaller set of incoherent projection compared with the traditional Nyquist-rate sampling theory. Re-cently, it has been shown that CS can solve some signal processing problems given incoherent measurements without ever reconstructing the signals. Moreover, the number of measurements necessary for most compres-sive signal processing application such as detection, estimation and classification is lower than that necessary for signal reconstruction. Based on CS, this paper presents a novel identification algorithm of frequency hop-ping (FH) signals. Given the hop interval, the FH signals can be identified and the hophop-ping frequencies can be estimated with a tiny number of measurements. Simulation results demonstrate that the method is effective and efficient.
Keywords: compressive sensing, frequency hopping signal, identification
1. Introduction
With so many good advantages such as anti-jam, anti- interception, high security and so on, the technique of frequency hopping spread spectrum (FHSS) has been extensively applied in many areas, especially in military domain. The detection and interception of FH signals can be addressed in several methods of which wide band or channelized receiver, time-frequency distribution, and cyclostationary processing are typical ones [1-4]. For all the methods above, the extremely large requirement of measurements is one of the most serious disadvantages, which can be a bottleneck in the application of identifi-cation of high speed wide band FH signals. Recently, there have been some active attempts on signal process-ing with the advantage of CS for the sparse or compres-sive signals [5-8]. However, most of them are limited within the area of statistical inference tasks which need the prior knowledge of the probability density distribu-tion of signals. Besides, it is seldom to be studied on how to develop the potential of CS to make processing of FH signal which is one of the most important sparse or com-pressive signals.
This paper makes use of the sparsity of FH signals on the local Fourier basis, and then presents a novel identi-fication algorithm of FH signals with the compressive measurements. Given the hop interval, the FH signals can be identified and the hopping frequencies can be es-timated without reconstructing the signals.
2. Compressive Sensing Background
2.1 Representation and Sparsity of Signal
Nyquist-rate sampling is the classical method to describe a signal with its bandlimitedness, while CS aims to com-pletely describe a signal with its sparsity or compressibil-ity to reduce the required number of measurements [9].
A signal can be viewed as an column vector
in with elements
x
N1, 2,...,
N x n n[ ], 1 N. Let the
ma-trix
1, 2,...N
N
have columns which form a
basis of vectors in . And then, any signal can be
expressed as:
x
1
x
N i i is or x s (1)
where is the
s
N1 column vector of weightingco-efficients si x,i .
When we say that x is K-sparse, we mean that it is well
reconstructed or approximated by a linear combination of
just K basis vectors from , with KN . That is,
there are only K of the si in (1) are nonzero and
(N K ) are zero.
2.2 Incoherent Measurements
Consider a generalized linear measurement process of a
signal x which is K-sparse. Let be an M N
THE IDENTIFICATION OF FREQUENCY HOPPING SIGNAL USING COMPRESSIVE SENSING 53
are incoherent with the columns of . The incoherent
measurements can be obtained by computing
M inner
products between x and the rows of as in
,
j j
y x . It can also be expressed as:
y x= s= s (2)
where : is an M N matrix. It is proved that
dose not depend on the signal x and it can be con-structed as a random matrix such as Gaussian matrix. And the CS theory shows that there is an over-measuring
factor such that only
1
c M:cK incoherent
meas-urements are required to reconstruct with high
prob-ability [9-11]. That is, only cK incoherent
measure-ments include all of the salient information in the
K-sparse signal , which provides the theory support on
the signal processing only given the incoherent meas-urements without reconstructing the signals.
x
x
2.3 Reconstruction
With the salient information included in the incoherent measurements, there have been several kinds of
recon-struction algorithms including 1 minimization, greedy
algorithm, matching pursuit and so on [12-15]. Since this paper is concentrated on FH signal identification without signal reconstruction, we don’t discuss reconstruction algorithms in detail here.
l
3. Compressive Identification for FH Signal
With the good sparsity of FH signals on the local Fourier basis, we now show that incoherent measurements can be used to solve the identification problem without ever reconstructing the signal. In this process, it is able to save significantly on the number of measurements required.
3.1 Compressive Identification Problem Setup
FH signals are sparse in a time-frequency representation as short-time Fourier transform, and they are always wideband when there is no prior restriction on the fre-quencies of the local sinusoid [16]. Therefore, the meas-urements obtained with the traditional Nyquist-rate sam-pling could be excessive and hard to meet with the pre-sent ability of hardware instrument.
Now, consider a FH signal which consists of a se-quence of windowed sinusoids with frequencies
distrib-uted between f1 and f2 Hz. The bandwidth of this signal is
B=f2-f1 Hz, which asks for sampling above the Nyquist
rate of 2(f2-f1) Hz to avoid aliasing. However, the expres-sion of the signal at any single hop is extremely simple: it consists of only one sinusoid of which bandwidth is
extremely less than B [16]. Hence, CS could make identi-
1
T T2 T3 T4
' 1
T '
2
T '
3
T '
[image:2.595.334.514.87.141.2]4 T
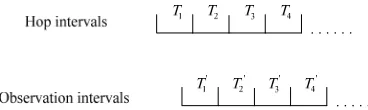
Figure 1. Hop intervals and observation intervals in the condition of 1-sparse
fication of FH signals possible with a sampling rate that is extremely less than the Nyquist rate.
Let the observation interval equal to the hop interval. If the start of the FH signal can be captured exactly, the signal can be observed synchronously as depicted in Fig-ure 1 and it has 1-sparse representation on the local Fou-rier basis within each of hop interval. Otherwise, as de-picted in Figure 2, the signal within each of hop interval will have 2-sparse representation since only two of the hopping frequencies appear in every single observation interval.
We observe y x instead of and our goal is to
identify the FH signal and estimate its hopping
frequen-cies with and its connection with .
x
y
3.2 1-Sparse Compressive Identification
[image:2.595.328.512.433.488.2]The amplitudes of Fourier coefficients of some FH signal within an observation interval have been shown in Figure 3 which dedicates that all the coefficients are almost zero except for only one single large coefficient.
Figure 2. Hop intervals and observation intervals in the condition of 2-sparse
Am
plitude
Figure 3. The amplitudes of Fourier coefficients of some FH signal within an observation interval in the condition of 1-sparse
Frequency (MHz) 1200
1000
800
600
400
200
0
[image:2.595.315.527.525.689.2]
Y
s
M N
p
p
[image:3.595.101.244.88.164.2]s
Figure 4. Measurement process in the condition of 1-sparse
The process of 1-sparse compressive measurement is depicted in Figure 4. We aim to find the position of
non-zero sp indicating the hopping frequency of a particular
interval.
Since y is obtained by multiplying the nonzero sp
by its corresponding column vector p, the hopping
frequency can be estimated given and . A direct method to estimate the position of nonzero
y
p
s is to
search for the position of p which can be decided by
calculating the angles between y and each column vector
of in the vector space as only the angle between y
and
p is zero in the ideal condition. Since is also
a random Gaussian matrix if is chosen to be a
ran-dom Gaussian matrix, the angle between y and another column vector of is also zero with extremely low probability. Taking account of the effect of noise, we design the estimation algorithm of hopping frequency as follows:
1) Obtain the incoherent measurements y with .
2) Calculate the cosine of angles between and each
column vector
y i in the vector space
2 2
y cos( ,y)
y
iH i
i
(3)
where H denotes conjugate transpose.
3) Select the column vector that maximizes cos( ,y)i ,
and define the position of this vector as estimation of hopping frequency
ˆarg max cos( , y)
i i
f (4)
After several intervals of observation and estimation of hopping frequencies, the time-frequency curve of the signal can be obtained and the FH signal has been identi-fied in the condition of 1-sparse.
3.3 2 Sparse Compressive Identification
Different from the condition of 1-sparse, Figure 5 shows that there are two large coefficients within an observation interval as each observation interval covers parts of two hop intervals in the condition of 2-sparse depicted in Fig-ure 2.
Figure 5. The amplitudes of Fourier coefficients of some FH signal within an observation interval in the condition of 2-sparse
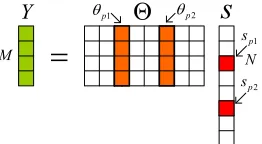
The process of 2-sparse compressive measurement is shown is Figure 3 which dedicates that is a linear combination of two column vectors
y
1
p and p2
cor-responding to the two nonzero coefficients sp1 and sp2
indicating the two hopping frequencies within a particu-lar observation interval. And y is also a linear
combina-tion of another two column vectors of with
ex-tremely low probability, since is a random Gaussian
matrix.
Therefore, the two hopping frequencies can be
esti-mated by deciding the subspace comprised of p1 and
2
p in . The estimation algorithm is as follows:
1) Obtain the incoherent measurements y with .
2) Calculate the orthogonal projection of onto
the subspace comprised of any two column vectors
y Py
ij
L i and j,
y
ij
y L
P P (5)
where
ij
L
P is orthogonal projector expressed by:
1
( )
ij
H H
L
P V V V V (6)
where V i, j.
3) Select the two column vectors that maximize onto the corresponding subspace, and define the posi-tions of these two vectors as estimation of the two hop-ping frequencies
y
P
1 2 , y
ˆ ˆ
[ , ] arg max( )
i j
f f P (7)
Taking account of the repetition of hopping frequen-cies within two consecutive observation intervals in the condition of 2-sparse, we can use the estimation results
Frequency (MHz) 600
500
400
300
200
100
0
Am
plitude
[image:3.595.313.525.90.255.2]THE IDENTIFICATION OF FREQUENCY HOPPING SIGNAL USING COMPRESSIVE SENSING 55
Y
s
M N
1
p
p2 1
p
s
2
p
[image:4.595.108.239.85.157.2]s
Figure 6. Measurement process in the condition of 2-sparse
of the former interval in the latter one. Only in the first interval, the algorithm is a kind of two-dimensional search as two column vectors have to be selected mean-while. And in the successive intervals, it can be executed as a one-dimensional search (twice) as one column vec-tor can be confirmed in according to the position infor-mation of two selected vectors of the former interval. This iterative processing can effectively reduce the computation, but obviously the error propagation can also be introduced. To solve this problem, an updating window is designed to separate the whole observation time into several segments of intervals. And in the first interval of every updating window, the two-dimensional search is executed all over again.
As the condition of 1-sparse, the time-frequency curve of the FH signal can also be obtained after several ob-servation intervals, and the signal can be identified.
4. Simulation Results
To demonstrate the feasibility and effectiveness of the proposed algorithm, a wideband FH signal submerged in additive Gaussian white noise (AWGN) is considered to make the simulation experiments. This FH signal has ten hopping frequencies which are distributed uniformly between 20MHz and 200MHz, and the hop interval is 1ms, i.e. 1000 hops per second. The other main simula-tion parameters are as follows: 2048-point local Fourier
basis is chosen to be , random Gaussian matrix is
chosen to be , and the number of observation
inter-vals is set to 2000. Each experiment is made in the con-dition of both 1-sparse and 2-sparse.
First, the estimation performance of hopping fre-quency is evaluated by normalized mean square error (NMSE) through several intervals of observation, where NMSE is expressed by
'
'
2
1 ˆ 1
NTi i
i i
T
f f
NMSE
N f (8)
where fˆi is the estimation of hopping frequency that
expressed by in the th observation interval and
represents the number of observation intervals which is set to 2000 here.
i
f i
'
T
N
[image:4.595.320.522.90.255.2]Figure 7 and Figure 8 show the performance curves of 1-sparse and 2-sparse respectively.
Figure 7. MSE of estimation with SNR in the condition of 1-sparse, where N=2048 and M represents the number of measurements used in this experiment experiments
Figure 8. MSE of estimation with SNR in the condition of 2-sparse, where N=2048 and M also represents the number of measurements used in this experiment experiments. And the length of updating window is set to 40
Some conclusions can be demonstrated from Figure 7 and Figure 8. First, the hopping frequencies can be effec-tively estimated with a tiny number of measurements when SNR is higher than 8dB. Second, the performance
of estimation degrades with the decrease of M ,
espe-cially in low SNR. And finally, the performance of 1- sparse is better than that of 2-sparse.
Next, the estimated time-frequency curves of the FH signal of 1-sparse and 2-sparse are depicted in Figure 9
and Figure 10 respectively when and SNR
is 10dB.
/16
M N
[image:4.595.314.534.306.487.2]5. Conclusions
[6] HAUPT J, NOWAK R. Compressive sampling for signal detec-tion. Conf. Rec. 2007 IEEE Int. Conf. Acoustics Speech and Signal Processing, 2007, 3: 1509-1512.Based on CS, this paper provides a novel method for the identification of wideband FH signal with a tiny number of incoherent measurements, which is an inspiration of real-time wideband sparse signal processing. This method can also be of great help for the detection and recognition of wideband signal in the non-cooperative communication.
[7] DUARTE M F, DAVENPORT M A, WAKIN M B. Multiscale random projection for compressive classification. Conf. Rec. 2007 IEEE Int. Conf. Image Processing, 2007, 6: 161-164. [8] DUARTE M F, DAVENPORT M A, WAKIN M B, BRANIUK
R G. Sparse signal detection from incoherent projection. Conf. Rec. 2006 IEEE Int. Conf. Acoustics Speech and Signal Proc-essing, 2006, 3: 305-308.
There are many opportunities for future research. Iden-tification without the information of hop interval, the picket fence effect of Fourier transformation on the per-formance of identification, and the theoretical bounds of
M with a given SNR would be discussed in the future
work.
[9] BRANIUK R. Compressed sensing. IEEE Signal Processing Magazine, Jul. 2007, 24(4): 118-121.
[10] DONOHO D. Compressed sensing. IEEE Trans. Inform. Theory, Apr. 2006, 52(4): 1289-1306.
[11] CANDES E, ROMBERG J, TAO T. Robust uncertainty princi-ples: Exact signal reconstruction from highly incomplete fre-quency information. IEEE Trans. Inform. Theory, Feb. 2006, 52(2): 489-509.
REFERENCES
[1] AYDIN L, POLYDOROS A. Hop-timing estimation for FH signals using a coarsely channelized receiver. IEEE Trans.
Communication, Apr. 1996, 44(4): 516-526. [12] DONOHO D, TANNER J. Sparse nonnegative solutions of un-derdetermined linear equations by linear programming. Proc. National Academy Science, 2005, 102(27): 9446-9451.
[2] ZHANG X, DU X, ZHU L. Time frequency analysis of frequency hopping signals based on Gabor spectrum method. Journal of
Data Acquisition & Processing, Jun. 2007, 22(2): 123-135. [13] TTOPP J A. Greed is good: Algorithmic results for sparse ap-proximation. IEEE Trans. Inform. Theory, Oct. 2004, 50(10): 2231-2242.
[3] HIPPENSTIEL R, KHALIL N, FARGUES M. The use of wave-lets to identify hopped signals. In 1997 Fortieth Asilomar Conf.
Signals, System & Computer, 1997, 1: 946-949. [14] HAUPT J, NOWAK R. Signal reconstruction from noisy random projection. IEEE Trans. Inform. Theory, Sep. 2006, 52(9): 4036-4048.
[4] FAN H, GUO Y, XU Y. A novel algorithm of blind detection of frequency hopping signal based on second-order cyclostationar-ity. Proc. 2008 Image and Signal Processing Congr., 2008, 5: 399-402.
[15] CHEN S, DONOHO D, SAUNDERS M. Atomic decomposition by basis pursuit. SIAM J. Sci. Comput., 1998, 20: 33-61. [16] LASKA J, KIROLOS S, MASSOUD Y, BARANIUK R.
Random sampling for analog-to-informaion conversion of wideband signals. IEEE Dallas/CAS Workshop on Design, Application, Integration and Software, Oct. 2006, 119-122. [5] HAUPT J, NOWAK R, YEH G. Compressive sampling for