MFBP2015-‐1-‐5 Final (R3)
Internal physiology of live krill revealed using new aquaria
techniques and mixed optical microscopy and optical coherence
tomography (OCT) imaging techniques
Martin Cox1, So Kawaguchi1, Robert King1, Kishan Dholakia2 and Christian T.A. Brown2
1 Australian Antarctic Division, Kingston, Tasmania, 7050, Australia 2 SUPA, School of
Physics and Astronomy, University of St Andrews, St Andrews, KY 16 9SS, U.K.
(Received23 January 2015; in final form 8 May 2015)
Running head: Internal imaging of live krill physiology
Correspondence: Dr. M. Cox, Australian Antarctic Division, 203 Channel Highway, Kingston, Tasmania, 7050, Australia email: [email protected]
Abstract
The accurate observation of physiological changes on in vivo samples of important
animal species such as Euphasia superba (Antarctic krill) is an important goal in helping
to understand how environmental changes can affect animal development. Using a custom made ‘krill trap’, live un-‐anaesthetized krill were confined for seven hours, during which three hours of optical imaging were obtained and no subsequent ill effects observed. The trap enabled two imaging methods to be employed: Optical Coherence Tomography (OCT) and microscopy. OCT enabled internal structure and tissues to be imaged to a depth of approximately 2 mm and resolution of approximately 12
μm. Microscopy was used to observe heart rate. During our experiments, we imaged a range of internal structures in live animals including the heart and gastric areas. The
trap design enables a new generation of mixed modality imaging of these animals in vivo.
These techniques will enable detailed studies of the internal physiology of live krill to be undertaken under a wide range of environmental conditions and have the potential to
highlight important variations in behaviour and animal development.
Key-‐words: Krill trap, live animal, morphological observations, Optical Coherence Tomography, Optical imaging.
INTRODUCTION
It has long been understood that Antarctic krill (Euphausia superba, herein krill) play a
pivotal role in the Southern Ocean ecosystem (Everson 2000). In order to determine the physiological response of krill to a changing environment, captive populations of krill have been reared in aquaria and subjected to a range of plausible environmental
conditions such as increased temperature and concentrations of C02. Determining the
responses of animals to environment is important when estimating spatial distribution and population changes including total abundance and age structure, all of which can be used to inform resource management decisions (Flores et al. 2012). Observing any environmentally induced physiological effect typically requires the sacrifice of individual animals precluding repeated measures type analysis and requiring large control and treatment group sizes (e.g. Brown et al., 2013).
Optical Coherence Tomography (OCT) is a non-‐invasive, high-‐resolution imaging technique that allows sub-‐surface images to be obtained. OCT has been used to image
various biological processes in zebra fish (Danio rerio), e.g. brain growth (Lin et al.,
2013), and eye structure (Divakar Rao et al., 2006). Recently, OCT has been used to image tissue structure in previously frozen krill samples (Bellini et al., 2014) to a depth of c. 2 mm, with a resolution of c. 12 μm. Whilst the depth penetration of OCT is
relatively short compared to ultrasound (mm cf. cm), the high resolution OCT image enables accurate measurement of distances inside a specimen, hence allowing
morphology to be measured and area and volumes of organs to be calculated. Indeed Bellini et al, (2014) showed that the technique could be used to provide estimates of carapace thickness and heart volume.
The ecological importance of krill, coupled with the potential adverse affects of a changing ocean on the species, led to the establishment of an aquarium research facility at the Australian Antarctic Division (AAD). The aquarium facility supports a population of krill that are used in a raft of experiments, including assessing the affects of changes
in water temperature and CO2 concentration e.g. Kawaguchi et al. (2013), behavioural
(2013). Current experimental procedures typically necessitate krill being sacrificed to determine any effect of environmental change on krill anatomy (e.g. Brown et al., 2013).
Other facets of krill behaviour and physiology in the laboratory setting also typically require the use of invasive methods. For example, heart rate measurements required individuals to be tethered (Ritz et al., 2003). Examination of reproductive performance, again typically requires individual animals to be sacrificed (e.g. Nicol et al., 1995). Determining krill gut content and size is not straightforward (e.g. Perissinotto, & Pakhomov, 1996).
The ultimate aim of a series of OCT krill imaging experiments is to establish a non-‐invasive sampling technique that supports repeated measurements of individual krill used in controlled aquarium settings. The goal of developing repeated measures observation on krill is important as this will enable the progress of an individual animal to be monitored through time and will eventually lead to either experiments with fewer subjects or more treatment levels. The imaging of live krill, reported here, is an
important milestone in this development and extends the post mortem imaging of
preciously frozen krill reported in Bellini et al. (2014).
The key to this live animal imaging development is the use of a ‘krill trap’ that holds an individual krill still to allow high quality OCT imaging without any apparent ill effect for up to seven hours. Whilst confined in the ‘krill trap’, high-‐resolution, mixed modality imaging using OCT and microscopy can be successfully carried out on the heart and gastric areas of individual krill. This report details the experimental set-‐up and demonstrates the successful imaging of live krill by providing example images obtained using both OCT and more conventional microscopic techniques.
Material and methods Live krill trap
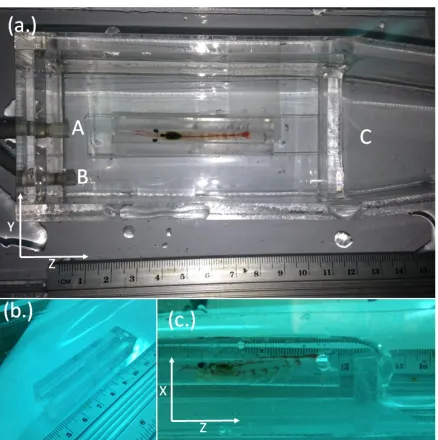
Individual adult krill were held in a transparent acrylic trap that was placed inside an acrylic water bath (Fig. 1a). Upstream of the trap, water was pumped through two openings at a constant combined flow rate of 0.24 l/min. Downstream of the trap, water exited the krill bath via a sluice to ensure a constant flow of exit water to keep the water depth in the bath constant. The ambient air temperature in the laboratory was 15 °C.
The temperature of water entering the tank was 0.5 °C and exiting 0.6 °C. Krill were
held within the water bath in a trap specially designed to minimised horizontal and vertical movement (Fig. 1b.). The top of the trap had a lengthways-‐opening slit of width 2.9 mm to enable imaging directly of the water surface and krill, rather than having to image through acrylic. Water depth above a captive krill was maintained at less than 1 mm by placing acrylic shims under the trap. Figure1c shows a captive krill within the system. The local xyz coordinate system used throughout this work is also illustrated. The complete water bath and krill trap was then mounted on top of a micropositioning stage which allowed precise adjustment of sample position in all three axes. Figures 2 and 3 provide the dimensions and water flow direction for the ‘krill trap’ and water bath respectively.
OCT system and data description
The OCT system was developed at the University of St Andrews and is described in detail in Krstajic et al. (2012). It uses a superluminescent light emitting diode (SLED) operating around 850 nm with a power of ~ 2mW at the sample. The system has
previously been applied to imaging defrosted post-‐mortem krill by Bellini et al. (2014).
images of the yz-‐plane (longitudinal scans with respect to the specimen) to be obtained. Whilst images were normally taken from the top of the specimen across the midline, in some cases the krill sample itself was rotated allowing images to be taken from the side of the specimen.
The second mode of OCT operation uses an external computer-‐controlled linear translation stage to move the krill specimen relative to the OCT objective. In this mode, a series of images spatially referenced in the z-‐dimension for transverse scans or the y direction for longitudinal scans facilitates the construction of a 3D image during post-‐ processing.
OCT data post-‐processing
System calibration, to account for variable refractive index, was accomplished using custom MATLAB code and a derived refractive index of 1.45 for the krill body tissue. The refractive index of krill body tissue was estimated using the technique and custom MATLAB code described in (Bellini et al., 2014, Supplementary information file S1). Once calibrated, lengths and areas could be measured from calibrated images when operating in stationary sampling mode.
To construct 3D images, the series of images generated when scanning along the z-‐dimension whilst operating in mode two were combined using the freely available US National Institutes of Health’s ImageJ package (imagej.net). Within ImageJ, the series of images are combined in a stack and rendered into a 3D array of intensity data that can then be interrogated in 2D planes that cuts the 3D array in any direction.
Optical microscope
In addition to OCT observations, the krill trap also enables optical microscopy to be
carried out using a Leica M205C dissecting stereo-‐microscope with a Leica DFC 450
camera and Leica LAS V4.0 software to collect high-‐resolution video data from which heart rate was observed.
Results
We began our investigations by studying fresh euthanized krill samples. Using these samples meant that images could be obtained before the characteristic cloudiness that affects post mortem samples due to protein denaturisation became a major issue. Figure 4(a) shows a single slice image through the cardiac area of the sample under study in the xy plane. Figure 4(b) shows a composite image of the heart in the yz plane built up using the reslicing capabilities within imagej from multiple horizontal scans spaced by 15 um. Figure 4(c) shows a re-‐sliced image of the fore section of a sample at a depth of approximately 1 mm below the surface and clearly shows the heart, digestive tract and gills. To produce this image, the sample was rotated so that the side of the animal was uppermost. The sample was then scanned in the manner described above allowing the composite image to be formed.
To carry out live animal imaging, it was important to investigate the effect of water over the sample on image quality. Figure 5 shows a single slice image of a freshly euthanized sample with water depth coverings of 0 -‐ 4 mm. The presence of sea water over the region of interest obviously degrades image quality and should be minimized when imaging in vivo samples whilst maintaining conditions to keep the sample healthy. In practice water depth was maintained to < 1 mm throughout live animal imaging experiments.
Following initial trials, we found that live krill specimens could be kept in the krill trap for up to 7 hours with no apparent ill effects whilst OCT imaging was
conducted for up to 4 hours also without apparent ill effect. Although animal movement has some effects on imaging we found that if vertical movement could be kept below ~1mm it was still possible to obtain good quality images.
structure visible below the carapace. The sample was the rotated and images were taken along the z direction allowing the yz slice image along the stomach and gut region shown in Fig. 6c to be obtained.
Following OCT imaging, the trapped animal was transferred to the optical microscope with the trap placed under the microscope, on the stage within the water bath. The heart and the stomach could be readily observed through the transparent carapace and its movements were video recorded for about 15 minutes. Figure 7a.-‐c. show example images of the heart and gastric regions. The heart can clearly be seen
beating (Video 1) and using video heart rate was estimated at 120 beats/min.
After release from the trap, the krill was kept in isolation within the aquarium for 48 hours. No ill effects were noted and the animal appeared healthy, fed normally and was subsequently returned to the aquarium population.
Discussion
The ‘krill trap’ enabled the successful multimodal imaging of live krill. Complimentary imaging techniques of OCT and optical microscopy offer great potential to study the development and behaviour of krill. OCT enables measurements of subsurface
structures, including volumes, whereas the optical microscopy is higher resolution and currently has a higher sampling rate than OCT so is likely to have observed the true heart rate rather than a subset of heart beats. Sampling a subset of a regular signal, in this case heart rate, is known as aliasing and in this instance, could give the observer the impression of a slower heart rate.
movements in its current configuration. Studies of digestion would be improved by real-‐time determination of stomach volumes and movement that would contribute to the understanding of the mechanics of krill feeding behaviour under various situations such as overwintering (e.g. Atkinson et al., 2002), the response of krill in the face of food scarcity (e.g. Meyer, 2012), or feeding response under future climate condition (Saba et al., 2012). Imaging of food digestion and clearance rate in the stomach and gut will further help improve understanding and estimation of gut evacuation and turnover rate which are important parameters to estimate carbon and nutrients recycling and
transport in the marine system (Kawaguchi and Nicol 2014). Imaging shell movement, particularly in response to varying water flow rates through the water bath and krill trap could aid understanding of krill hydrodynamics, and energy budgets (Murphy et al., 2013).
It was not expected that OCT would have a deleterious effect on krill specimens since its optical intensity is well below the intensity that will damage tissue (Drexler et al., 2008). This experiment confirmed that the combination of enclosure in the krill trap and exposure to OCT had no effect on an individual after release. Potentially, the
imaging of live krill will enable controlled experiments to follow an individual through its life cycle stages, including the moult cycle and ovary development without sacrificing the individual. Investigations into the influence of ocean acidification have highlighted
the need to improve the resolution of the CO2 concentration to effect relationship
Kawaguchi et al. (2011). A repeated measures approach may improve statistical power so reducing the number of individuals required to assess a given treatment level,
thereby releasing individuals to be used at different treatment levels Brown & Prescott (1999).
such as Northern krill (Meganyctiphanes norvegica) (for review see Spicer & Saborowski, 2010),
By combining the modalities of OCT and optical imaging, we believe that it is possible to further enhance three dimensional imaging of living specimens providing high quality data from both the surface and from deeper within samples than may be possible using optical techniques alone. In particular the ability of OCT to produce “slice” images enables a form of virtual dissection and allows observation bath to be
undertaken on living samples to complement the views that may be obtained by other techniques.
Conclusions and future directions
The work presented here has demonstrated that imaging both using conventional
techniques and OCT is possible in suitably restrained live animals. The trap design successfully enabled imaging whilst at the same time keeping samples healthy over extended periods. This could be further improved, however, by providing more accurate and repeatable movements of the trapped sample within the water bath and by
providing simple adjustments for the weir at the end of the water bath to allow a constant water level to be maintained. Modifications to the anterior of the trap may be required to ensure that the thoracic feeding apparatus can function unimpeded in studies involving them or where feeding is necessary for digestive observations. Higher quality images might also be possible and air/water scattering artefacts could be
eliminated through the use of water dipping objective lenses in the imaging systems.
digestive and reproductive systems. Similarly, one possible application of OCT is in imaging embryo and larval development. This will allow in-‐depth observation of potential climate change impacts on early life stages, the critical period for successful recruitment of the population (Kawaguchi et al., 2011). Further investigations of the applicability of the technique to small samples at high resolution must be undertaken.
Acknowledgments
The collection and rearing of krill specimens was funded by Australian Antarctic
Division science programme Project 4037 (Experimental Krill Biology: Response of krill to environmental change), and Project 4050 (Assessing change in krill distribution and abundance in Eastern Antarctica). MJC is funded by Australian Research Council grant FS110200057. CTAB acknowledges support for instrument development and shipping costs from the United Kingdom Engineering and Physical Sciences Research Council
Grant EP/M000869/1 (Shaped Light at the Interface).
Live wild krill were caught in the Southern Ocean under permits issued by the
Australian Department of Environment and Heritage under the Environment Protection and Biodiversity Conservation Act 1999, permit WT2005-‐8619 and under the Antarctic Marine Living Resources Conservation Act 1981, permit AMLR 05-‐06_2655.
References
Adams, D. C., Otárola-‐Castillo, E. (2013), geomorph: an r package for the collection and analysis of geometric morphometric shape data. Methods in Ecology and Evolution, 4: 393–399. doi: 10.1111/2041-‐210X.12035
Atkinson, A., et al. "Feeding and energy budgets of Antarctic krill Euphausia superba at
the onset of winter—II. Juveniles and adults." Limnology and Oceanography 47.4 (2002):
953-‐966.
Bellini, N., Cox, M. J., Harper, D. J., Stott, S. R., Ashok, P. C., Dholakia, K., Kawaguchi, S., King, R., Horton, T., and Brown, C. T. A. (2014). The Application of Optical Coherence
Tomography to Image Subsurface Tissue Structure of Antarctic Krill Euphausia superba.
PLoS ONE, 9:e110367
Brown H., Prescott R (1999) Applied mixed models in medicine. Chichester, UK: John Wiley & Sons.
Brown M, Kawaguchi S, Candy S, Yoshida T, Virtue P, Nicol S (2013) Long-‐term effect of photoperiod, temperature and feeding regimes on the respiration rates of Antarctic krill (Euphausia superba). Open Journal of Marine Science 3:40-‐51
Divakar Rao, K., Y. Verma, H. S. Patel, and P. K. Gupta. “Non-‐Invasive Ophthalmic Imaging
of Adult Zebrafish Eye Using Optical Coherence Tomography.” Current Science 90, no. 11
(2006): 1506–10.
Drexler W, Fujimoto JG, editors (2008) Optical coherence tomography: Technology and applications. Berlin Heidelberg, Germany: Springer.
Dubois, A., Vabre, L., Boccara, A., and Beaurepaire E., (2002). High-‐resolution full-‐field
optical coherence tomography with a Linnik microscope, Appl. Opt., 41, 805-‐812.
Everson, I. (ed.) (2000) Krill biology, ecology and fisheries. Fish and Aquatic Resources Series 6. Blackwell Science, Oxford. 372 pp.
Flores, H., Atkinson, A., Kawaguchi, S., Krafft, B.A., Milinevsky, G., Nicol, S., Reiss, C., Tarling, G.A., Werner, R., Bravo Rebolledo, E.B., et al. (2012) Impact of climate change on Antarctic krill. Marine Ecology Progress Series 458: 1-‐19.
Kawaguchi S, Nicol S (2014) Antarctic krill. In: Laffoley D, Baxter J, Thevenon F, Oliver J (eds.) The Significance and Management of Natural Carbon Stores in the Open Ocean. Full report. Gland, Switzerland: IUCN. pp. 69-‐78.
Kawaguchi S, King R, Meijers R, Osborn JE, Swadling KM, Ritz DA, Nicol S (2010) An experimental aquarium for observing the schooling behaviour of Antarctic krill (Euphausia superba). Deep Sea Research Part II: Topical Studies in Oceanography 57:683–692
Kawaguchi, S., Kurihara, H., King, R., Hale, L., Berli, T., Robinson, J.P., Ishida, A., Wakita, M., Virtue, P., Nicol, S., Ishimatsu, A., (2011). Will krill fare well under Southern Ocean acidification? Biology Letters 7, 288–291. doi:10.1098/rsbl.2010.0777
Kawaguchi S, Ishida A, King R, Raymond B, Waller N, et al. (2013) Risk maps for
Antarctic krill under projected Southern Ocean acidification. Nature Climate Change 3:
843-‐847.
Krstajic N, Brown CTA, Dholakia K, Giardini ME (2012) Tissue surface as the reference arm in Fourier domain optical coherence tomography. Journal of Biomedical Optics 17: 071305.
Leitgeb, R., Schmetterer, L., Hitzenberger, C. , Fercher, A., Berisha, F., Wojtkowski, M. & Bajraszewski, T. (2004). Real-‐time measurement of in vitro flow by Fourier-‐domain
color Doppler optical coherence tomography, Opt. Lett. 29, 171-‐173
Letessier, T. B., Kawaguchi, S., King, R., Meeuwig, J. J., Harcourt, R., and Cox, M. J. (2013). A Robust and Economical Underwater Stereo Video System to Observe Antarctic Krill (Euphausia superba). Open Journal of Marine Science, 3(3):148 – 153
Lin, Yu-‐Sheng, Chin-‐Chou Chu, Po-‐Hsiang Tsui, and Chien-‐Cheng Chang. “Evaluation of
Zebrafish Brain Development Using Optical Coherence Tomography.” Journal of
Biophotonics 6, no. 9 (September 2013): 668–78. doi:10.1002/jbio.201200069.
Meyer, B. (2012). The overwintering of Antarctic krill, Euphausia superba, from an
ecophysiological perspective. Polar biology, 35(1), 15-‐37.
Murphy, D. W., Webster, D. R., & Yen, J. (2013). The hydrodynamics of hovering in
Antarctic krill. Limnology and Oceanography: Fluids and Environments, 3(1), 240-‐255.
Nicol S., De La Mare W.K., and Stolp, M. (1995). The energetic cost of egg production in Antarctic krill (Euphausia superba Dana). Antarctic Science, 7, pp 25-‐30.
Nicol, S. (2000). Understanding krill growth and aging: the contribution of experimental
studies. Canadian Journal of Fisheries and Aquatic Sciences, 57(S3), 168-‐177.
Nicol, S. (2003). Living krill, zooplankton and experimental investigations: a discourse
on the role of krill and their experimental study in marine ecology. Mar. Fresh. Behav.
Physiol., 36(4), 191-‐205.
Perissinotto, R., & Pakhomov, E. A. (1996). Gut evacuation rates and pigment
destruction in the Antarctic krill Euphausia superba. Marine Biology, 125(1), 47-‐54. Ritz, D.A., Cromer, L., Swadling, K.M., Nicol S., and Osborn J. (2003). Heart rate as a measure of stress in Antarctic krill, Euphausia superba. Journal of the Marine Biological Association of the UK, 83, pp 329-‐330. doi:10.1017/S002531540300715Xh.
Saba GK, Schofield O, Torres JJ, Ombres EH, Steinberg DK (2012) Increased feeding and
nutrient excretion of adult Antarctic krill, Euphausia superba, exposed to enhanced
carbon dioxide (CO2) PLoS ONE 7(12): e52224. doi:10.1371/journal.pone.0052224
Spicer, J. I., & Saborowski, R. (2010). 4 Physiology and Metabolism of Northern Krill
(Meganyctiphanes norvegica Sars). Advances in marine biology, 57, 91.
Figures
Figure 1 – krill bath and trap arrangement
[image:15.595.74.512.107.547.2]
Figure 2 –Krill trap diagram Figure 3 – Diagram of water bath
[image:16.595.71.510.103.480.2] [image:16.595.73.527.338.560.2]
Figure 4 – OCT images of fresh post-‐mortem krill specimens.
Figure 5 -‐ Examples of OCT images of the same xy slice of krill abdomen
Figure 6-‐ OCT images of living krill.
[image:17.595.73.360.89.401.2] [image:17.595.70.387.402.678.2]
Figure 7 -‐ Optical microscope image of the gastric region
Figure Captions
Figure 1. (a.) Water bath. Water flows in through the two openings (A, B). Water level is maintained by a weir (C). Waste-‐water passes down a spill way to disposal. The balance of flow through A and B is adjusted such that sufficient oxygenation of the animal can be established whilst minimizing any surface ripples that have a major effect on image quality. (b.) Krill containment trap. The top of the box is milled away to enable imaging to take place without light passing through any acrylic. (c.) Photograph of live krill within the trap system. The x,y,z local coordinate system used throughout this work is also shown.
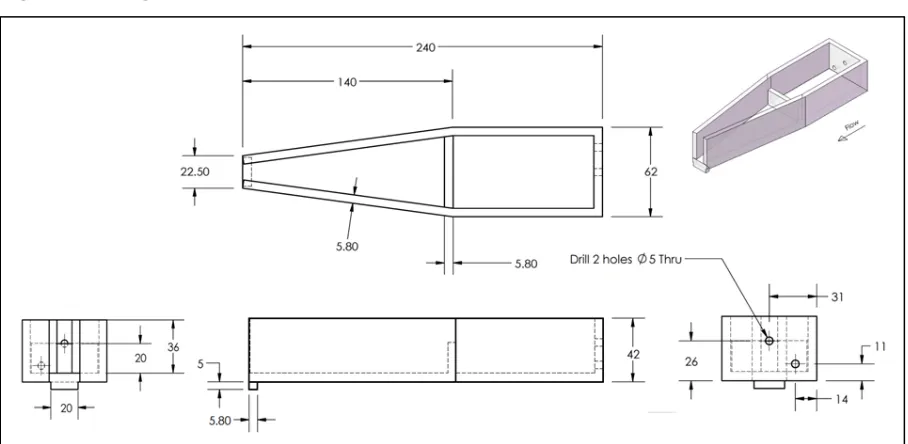
Figure 2 Diagram of the ‘krill trap’ showing flow direction. Lengths in mm. The diagram is not to scale.
Figure 3 Diagram of the water bath showing flow direction. Lengths in mm. The diagram is not to scale.
[image:18.595.72.526.87.311.2]
Figure 4 OCT images of fresh post-‐mortem krill specimens. (a.) Single OCT image slice in the yz plane of an example region of the krill cardiac area. (b.) Reprocessed image, made using imagej, from multiple z-‐slices of the krill heart in the xz plane. The full extent of the heart is clearly visible along with ligament structures for attachment. (c.)
Reprocessed image of the left hand side of the fore section of a krill in the xz plane showing tissue structure from approximately 1 mm depth. In all images a 1 mm scale bar is shown
Figure 5. Examples of OCT images of the same xy slice of krill abdomen taken as the water depth over the sample is progressively increased. (a.) 0 mm depth (b.) 1 mm depth (c.) 2 mm depth (d.) 4 mm depth. The decrease in image quality is apparent and may be related to the increased dispersion present in the sample as well as enhanced scattering losses from the air/water interface and signal absorption in the water.
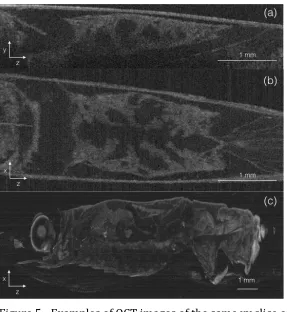
Figure 6. OCT images of living krill. (a.) xy slice across stomach region. (b.) xy slice through cardiac region. An animated sequence of cardiac images showing cardiac motion is available in the supplementary information (S1.) (c.) yz slice along stomach and digestive system. The bright white line on the left hand side of the image is an artifact from a layer of water above part of the sample
Figure 7. Optical microscope image of the gastric region (a.) and of the heart (b.) of a trapped living krill showing that high quality optical images may also be obtained using the trap geometry described.
Video Caption
Video 1. Optical microscopy video of krill observed using a Leica M205C dissecting stereo-‐microscope with a Leica DFC 450 camera and Leica LAS V4.0 software.