Understanding processes of sediment bleaching in glacial settings using
a portable OSL reader
GEORGINA E. KING, DAVID C. W. SANDERSON, RUTH A. J. ROBINSON AND ADRIAN A. FINCH
King, G. E., Sanderson, D. C. W., Robinson, R. A. J. & Finch, A. A. 2014 (October): Understanding processes of sediment bleaching in glacial settings using a portable OSL reader.Boreas, Vol. 43, pp. 955–972. 10.1111/ bor.12078. ISSN 0300-9483.
Analysis of a high-resolution suite of modern glacial sediments from Jostedalen, southern Norway, using a portable optically stimulated luminescence (OSL) reader, provides insights into the processes of sediment bleach-ing in glacial environments at the catchment scale. High-magnitude, low-frequency processes result in the least effective sediment bleaching, whereas low-magnitude, high-frequency events provide greater bleaching opportu-nities. Changes in sediment bleaching can also be identified at the scale of individual bar features: tails of braid-bars and side-attached bar deposits have the lowest portable reader signal intensities, as well as the smallest conventional OSL residual doses. In addition to improving our understanding of the processes of sediment bleaching, portable reader investigations can also facilitate more rapid and comprehensive modern analogue investigations, which are commonly used to confirm that the OSL signals of modern glacial sediments are well bleached.
Georgina E. King ([email protected]), Department of Earth and Environmental Sciences, University of St Andrews, Irvine Building, North Street, St Andrews, Fife KY16 9AL, UK (present address: Institute of Earth Surface Dynamics, University of Lausanne, Quartier UNIL-Mouline, BâtimentGéopolis, 1015 Lausanne, Switzerland), Ruth A. J. Robinson and Adrian A. Finch, Department of Earth and Environmental Sciences, University of St Andrews, Irvine Building, North Street, St Andrews, Fife KY16 9AL, UK; David C. W. Sanderson, Department of Environmental Physics, Scottish Universities Environmental Research Centre, Rankine Avenue, Scottish Enterprise Technology Park, East Kilbride G75 OQF, UK; received 20th October 2013, accepted 19th February 2014.
Optically stimulated luminescence (OSL) dating, is used to successfully date Quaternary sediments in a range of different depositional environments (cf. Wintle 2008; Rhodes 2011). However, one of the key challenges to the successful application of the technique is selecting sediments that have had their luminescence signal fully reset prior to deposition. Whereas partial resetting (bleaching) is not generally expected in aeolian deposits, sediments deposited by fluvial (e.g. Murrayet al. 1995) or glacial processes (e.g. Rhodes & Pownall 1994) can be seriously affected. One approach for assessing the degree of sediment bleaching is through the measurement of the luminescence signal of a modern analogue deposit, which has the same or a similar depositional setting to the geological deposits under investigation (Gemmell 1997; Alexanderson 2007; Bøeet al. 2007; Alexanderson & Murray 2012). However, recent studies into the variability of residual OSL ages in modern glacifluvial sediments has revealed that residual ages vary significantly amongst similar depositional settings, ranging from zero to almost 3000 years for glacifluvial bar deposits from a single catch-ment (Kinget al. 2013). Where OSL dating has been used to date glacial deposits (cf. Thrasheret al. 2009) a range of different residual (unbleached) luminescence signals have been reported for sediments with similar depositional settings from modern analogue investiga-tions (e.g. Alexanderson & Murray 2012). It is there-fore possible that inherited residual ages will be over- or
underestimated if based on a single modern analogue deposit, which is problematic if the residual age comprises a significant proportion of the sample burial age. Considering the importance of signal resetting to successful OSL analyses, it is clear that there is further scope for detailed modern analogue studies to investi-gate the processes of sediment bleaching within differ-ent depositional settings.
The purpose of the present study was to investigate catchment scale variability in the residual signals of modern glacial sediments that have contrasting sedi-ment sources and transport histories, in order that the processes of sediment bleaching may be better under-stood. Understanding which sediments are most likely to have experienced significant bleaching within glacial environments will inform sampling protocols and may therefore improve the accuracy and precision of OSL dating in glacial settings.
Exploring variations in luminescence signals at the catchment scale is difficult because of the significant time required to prepare OSL samples (weeks to months dependent on sample) and for their measurement (days to weeks, dependent on sample), coupled with the often challenging properties of quartz from glacial environ-ments (e.g. Rhodes & Bailey 1997). Quartz has conven-tionally been regarded as the preferred mineral for OSL dating in environments where partial bleaching is likely to occur, as its most readily bleached OSL signal com-ponents can reset more rapidly than corresponding
DOI 10.1111/bor.12078 © 2014 The Authors
signals in feldspars, providing that the illumination field is rich in the near-UV spectrum. However, the sensitivity (brightness) of quartz from glacial sediments is often very low, which necessitates increased measurement time as many aliquots are rejected, and in the worst instances it may not be possible to obtain a quartz OSL age (e.g. Lukaset al. 2007).
Over the past 10 to 15 years, a number of OSL screening methods have been developed that aim to provide insights into the luminescence properties of sediments more rapidly than through conventional OSL analyses. These methods can be grouped into instrumental developments such as the Scottish Univer-sities Environmental Research Centre portable OSL reader (Bishopet al. 2005; Sanderson & Murphy 2010), and methodological developments such as laboratory profiling (Sandersonet al. 2001, 2003; Burbidge et al. 2007), rangefinder ages (Durcan et al. 2009; Roberts et al. 2009) and standardized growth curves (e.g. Roberts & Duller 2004). A number of studies have recently been published that have successfully utilized one (or often more) of these techniques to characterize deposits from different environments, enabling archaeological and environmental questions to be more rapidly addressed (e.g. Muñoz-Salinas et al. 2012; Munyikwa et al. 2012). Kinnaird et al. (2012) used a combination of portable reader (PR) data and labora-tory profiling analyses to gain insights into the palaeoenvironmental history of a coastal setting in Orkney, Scotland. Stang et al. (2012) also contrasted PR data with rapid profiling analyses on untreated sediments using a Risø TL/OSL reader to investigate the history of soil mixing in the San Gabriel Moun-tains, USA. The work reported here uses a combination of rapid portable reader measurements, and conven-tional OSL analyses in order to better understand the likely bleaching opportunities that different glacial and glacifluvial sediments experience throughout transport and deposition at both the catchment and individual landform scales.
Study area
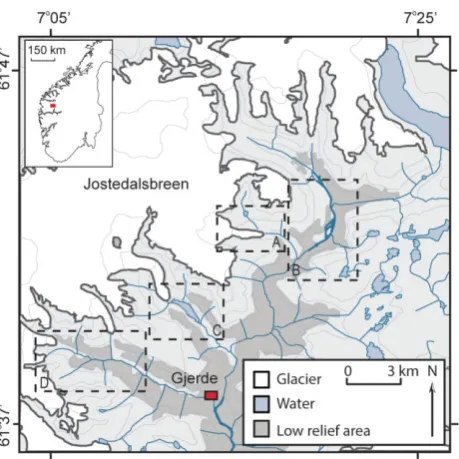
The Jostedalen region of southern Norway is host to the Jostedalsbreen icecap, which is the largest body of ice in mainland Europe (Fig. 1). The Jostedal Plateau is thought to have completely deglaciated 7.5−5.5 cal. ka BP (Nesje & Kvamme 1991; Matthews et al. 2000; Nesjeet al. 2000, 2001), but has experienced significant Neoglaciation since ∼5 ka BP (Shakesby et al. 2004). Various outlet glaciers drain Jostedalsbreen and samples were collected from the Jostedøla (JOS), but four catchments are the focus areas of this research: Bergsetdalen (BERG), Fåbergstølsdalen (FAB), Fåbergstølsgrandane (GRAN) and Nigardsdalen (MJO).
Jostedalen is within the western Gneiss region of Norway (Bryhni & Sturt 1985), and is underlain by bedrock of Precambrian granitic to granodioritic gneiss (Holtedahl 1960; Holtedahl & Dons 1960). The upper catchments of Nigardsbreen and Bergsetdalen are underlain by quartz monzanite, whilst Fåbergstø lsdalen and the majority of Jostedalen are underlain by quartz diorite.
Fåbergstølsdalen (FAB)
Fåbergstølsbreen (61°42′N, 7°17′E) discharges into the E−SE trending Fåbergstølsdalen valley and is drained by a single meltwater stream, which anastomoses in the lower catchment. Very little vegetation is established in the upper catchment where till and early Holocene paraglacial deposits are reworked by debris flows (Ballantyne & Benn 1994), which form the dominant sediment source in addition to direct subglacial inputs. Fåbergstølsdalen has a high degree of hillslope connec-tivity and debris flow material is transported directly into the meltwater stream. The Fåbergstølsdalen catch-ment is 3 km2and 19 samples of glacifluvial bars were collected along a transect of 2.5 km from the ice front, as well as five samples from paraglacial, subglacial and avalanche deposits, which represent sediment sources.
Bergsetdalen (BERG)
[image:2.595.324.554.60.290.2]Bergsetbreen (61°38′51N, 7°06′16E) is a hanging glacier that discharges into the E−NE orientated Krundalen valley, the upper section of which is referred
to as Bergsetdalen. It is the most southern valley sampled within Jostedalen, and is heavily vegetated relative to Fåbergstølsdalen. Sediments are sourced predominantly from subglacial material, although limited reworking of paraglacial deposits within the Little Ice Age (LIA) moraine limit (Bickerton & Matthews 1993) also contributes to the total sediment budget of this catchment. Material is transported by the meltwater stream, which is a similar size to the meltwater stream in Fåbergstølsdalen, but comprises multiple braided bars in the upper catchment and a single meltwater channel in the lower catchment. The Bergsetdalen catchment is 7 km2, and 27 samples were taken predominantly from braided bars in the upper catchment, but also from side-attached bar deposits 3 km from the ice front. Bergsetdalen forms a comple-mentary sample site to Fåbergstølsdalen, as meltwater streams form a significant mode of transport in both catchments but Bergsetdalen does not have the high degree of channel-hillslope connectivity of Fåbergstø-lsdalen. Contrasting these sites may enable the influ-ences of depositional processes and sediment sources to be separated and identified.
Fåbergstølsgrandane (GRAN)
Fåbergstølsgrandane (61°43′39N, 7°21′50E) is the largest sandur in mainland Norway and occupies a catchment of 6 km2. It is sourced from a number of the Jostedalsbreen outlet glaciers including the debris-covered Lodalsbreen within Stordalen. Sediment sources are dominantly subglacial, although paraglacial material from Stordalen and Trongedalen will also con-tribute to the total sediment flux, in addition to material avalanched directly onto the sandur from the valley sides. The Jostedøla river is sourced from these catch-ments and flows across the western and southern flanks of the sandur, and is bordered by a suite of side-attached bar deposits. Fåbergstølsgrandane comprises a series of braided bars, which range from heights of 1 m above the channel bottom in the upper northwest part of the sandur, which is most proximal to the source sediments, to heights of∼30 cm further east and southeast. Clast sizes vary as bar heights reduce from cobble-dominated bars in the northwest to gravel- and sand-dominated bars in the southeast. Samples were collected across two transects. The first comprised nine samples of braided bar deposits and was 1.5 km in length, and the second comprised 11 samples of side-attached bar deposits and was 2 km in length.
Nigardsdalen (MJO)
Subglacial sediment from Nigardsbreen forms the dominant sediment source in Nigardsdalen. Sediment is transported by the meltwater stream into a proglacial lake where a fan delta composed of braided bar depos-its is formed. The bars have maximum heights of 30 cm
across the delta, and clast sizes range from gravels to sands, although occasional cobbles are found in the most glacier-proximal bars. Nigardsdalen forms a com-plementary site to Fåbergstølsgrandane, as although the scale of the braid-bars is smaller, they are formed from similar depositional processes. The Nigardsdalen proglacial delta has shallower relief than the Fåbergstølsgrandane sandur, and the braid-bars will be submerged more regularly in response to small changes in meltwater discharge. It is difficult to provide an esti-mate of the delta size because the exposed area varies depending upon lake level; however, it ranges from approximately 0.03 to 0.08 km2. Fifteen braid-bar deposits were sampled, as well as a single sample of paraglacial sediment near to the ice front.
Sample collection
The objective of this research was to explore the lumi-nescence signals of modern sediments, rather than explore the relative chronologies of different deposits. Sample modernity was ensured through sampling hori-zons that are>2 cm but within a few cm of the sediment surface. Samples from all sites with the exception of Nigardsdalen were collected through covering the sample site with an opaque, plastic bag and sampling directly into transparent sample bags within opaque plastic bags. Samples from Nigardsdalen were collected in opaque plastic tubes. Mainly glacifluvial deposits were sampled as glacifluvial transport and depositional processes are dominant in all of the catchments with the exception of Fåbergstølsdalen, where debris flows contribute significantly to the total sediment flux. Addi-tional samples of subglacial, paraglacial and supraglacial material were taken to characterize other key sediment sources and transport and depositional processes within glacial environments.
Portable reader analyses
Portable reader analyses were carried out using the 2005 Scottish Universities Environmental Research Centre (SUERC) prototype reader in the laboratories at SUERC. Whereas conventional OSL methods are usually applied to a restricted grain size and a single mineral (except polymineral fine-grained analyses), the portable reader facilitates simple measurements of the luminescence response of the multi-mineral bulk deposit without pre-treatment. Under subdued light conditions, 96 bulk samples were decanted into 50 mm Petri dishes for PR analysis and were not given any pre-treatment.
is detected through UG11 filters using an ETL photodetector module with a 25 mm bi-alkali photo-multiplier. The prototype system was capable of continuous-wave stimulation and detection only, and was reliant on manual operation of the stimulation diodes.
The sample measurement sequence used here had 200 s duration comprising a 10 s background acquisi-tion (i.e. no diode stimulaacquisi-tion), followed by 80 s IR stimulated luminescence (IRSL) measurement and a subsequent 10 s post-stimulation phosphorescence (PSP) plus background measurement (i.e. no diode stimulation, Sanderson & Murphy 2010). The IRSL measurements were immediately followed by blue stimulated luminescence (BSL) measurements in the same format and for the same duration (Table 1A). All measurements were performed at room temperature, and samples were not dried prior to analysis. Samples were stored for between one and four weeks at room temperature before measurement.
The luminescence signals measured from multi-mineral bulk sediments are the product of numerous variables, which have been discussed by Sanderson & Murphy (2010). They are dependent on (i) the postdepositional age of the sediment, (ii) the total radiation dose that the sediment has been exposed to during burial, (iii) the degree of signal resetting through sunlight exposure that the sediment experienced prior to deposition, (iv) the sensitivity (brightness) of the luminescence signal of the minerals present, and (v) the sediment grain-size. This research aims to isolate only
one of these controls on the luminescence signals, namely point (iii), which relates to the unbleached frac-tion of the initial luminescence signal and is referred to as the residual luminescence.
The residual signal of a sediment is the product of the initial luminescence signal of its constituent minerals, and the degree of sunlight exposure that it has experi-enced throughout transport and deposition. Through sampling only modern material, the influence of the postdepositional age of the sediment (point (i)) has been circumvented. The influence of the total radiation dose that the samples have received, point (ii), is complex as a residual dose can relate to the dose rate of the sediment source location, rather than the sample location. However, as measured dose rate variations within the different catchments are small (RSD<16%; King 2012), these will have less influence on the result-ant luminescence signals than the effects of partial bleaching. Sample luminescence will also be affected by changing concentrations of different minerals (point (iv)) with different luminescence sensitivities, and by changing grain size populations which experience dif-ferent bleaching opportunities (point (v)); however, such variations may also encode information about the depositional and transport processes that the sediment has experienced.
OSL sample preparation for
conventional analyses
Four K-feldspar samples (JOS13, JOS14, JOS18 and JOS51) were prepared specifically for comparison with the portable reader analyses using conventional methods. Material was desiccated at 50°C to enable calculation of water content, and sieved to extract the 180–212μm grain size fraction selected for analysis. The 180–212μm grain-size fraction was treated with 30% HCl to remove CaCO3 and with H2O2to remove organics. K-feldspar was extracted from the polymineral sample through density separations and the <2.58 g cm−3K-feldspar fraction was not etched (Duller 1992).
Conventional OSL analyses
All conventional OSL analyses were carried out at the University of St Andrews using either a TL-DA-15 (Bøtter-Jensen et al. 2003) or TL-DA-20 Risø reader, equipped with an EMI 9235QA photomultiplier. The detection region was restricted to the blue for the K-feldspar samples using a Corning 7–59 and BG-39 filter. Infrared (∼870 nm) diodes were used for stimula-tion and a 90Sr/90Y beta source was used for irradia-tions. Equivalent dose values were calculated using Analyst v.3.22b (Duller 2005).
[image:4.595.76.311.97.288.2]Feldspar OSL was measured using small (2 mm,∼30 grain) multi-grain aliquots, and a modified single
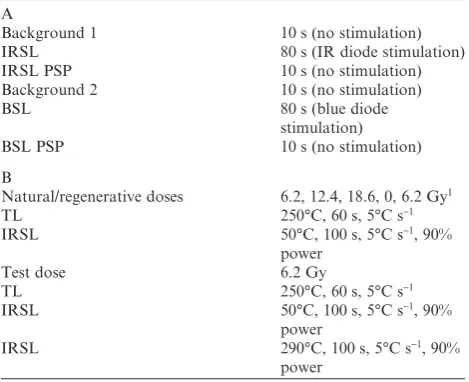
Table 1. A. Portable reader analysis protocol. Stimulation sources are indicated in parentheses. PSP=post-stimulation phosphores-cence. B. Feldspar analysis protocol.
A
Background 1 10 s (no stimulation)
IRSL 80 s (IR diode stimulation)
IRSL PSP 10 s (no stimulation)
Background 2 10 s (no stimulation)
BSL 80 s (blue diode
stimulation)
BSL PSP 10 s (no stimulation)
B
Natural/regenerative doses 6.2, 12.4, 18.6, 0, 6.2 Gy1
TL 250°C, 60 s, 5°C s−1
IRSL 50°C, 100 s, 5°C s−1, 90%
power
Test dose 6.2 Gy
TL 250°C, 60 s, 5°C s−1
IRSL 50°C, 100 s, 5°C s−1, 90%
power
IRSL 290°C, 100 s, 5°C s−1, 90%
power
1Regenerative doses varied dependent upon sampleDebut initial
analyses were carried out with these doses. IRSL=infra-red stimu-lated luminescence, PSP=post-stimulation phosphorescence, BSL=
aliquot regenerative (SAR) dose protocol (Wallinga et al. 2000) whereby the first and second preheat tem-peratures are identical in order to improve sensitivity corrections (after Huot & Lamothe 2003; Blair et al. 2005; Wallinga et al. 2007; Table 1B). A high-temperature IR bleach was incorporated at the end of each SAR cycle (Murray & Wintle 2003; Blair et al. 2005; Buylaertet al. 2007), which is designed to deplete excess signal that may accumulate throughout analysis (recuperation). The recently developed post-IR IRSL protocol (Thomsen et al. 2008; Buylaert et al. 2009), which is less susceptible to anomalous fading (Wintle 1973), was not employed as it is not suitable for young sediments or those that may be partially bleached (Thiel 2011).
The suitability of the selected protocol (Table 1B) was confirmed through a range of dose-recovery and preheat-plateau experiments. Acceptance criteria are (i) recycling ratios within 10% of unity, (ii) signal intensi-ties ≥3σ above background, (iii) recuperation within 10% of the normalized maximum regenerated dose, and (iv) De value uncertainties are ≤10%. K-feldspar De
values were not corrected for anomalous fading, as contrasts in relative residual ages rather than the abso-lute residual ages are of key interest.
Standardized growth curves (SGC) for quartz and polymineral fine grains have recently been investigated by a number of authors (e.g. Roberts & Duller 2004). A set of individual SGCs for each of the four samples were developed from which De values could be
inter-polated (Fig. 2). Standardized growth curve develop-ment greatly increased the rate of analysis. The suitability of the calculated SGCs was evaluated through comparingDevalues calculated from
interpo-lation of the sensitivity-corrected natural luminescence signal (Ln/Tn) onto the SGC with those obtained from a full SAR protocol fitted in Analyst v.3.22b (Duller 2005). To avoid circularity, aliquots used for testing the SGCs were not included in their construction. Fitting uncertainty was calculated using LINEST in Excel 2007, and incorporated together with 1.5% ana-lytical uncertainty.
Dose rate calculations
The environmental radiation dose rate (Dr) must be
determined in order to calculate sample residual age. It is comprised of external contributions from cosmic radiation and the decay of radio-isotopes in the sedi-mentary matrix, as well as from internal contributions from the decay of radio-isotopes within the minerals themselves. The concentrations of U, Th, K and Rb were measured directly using ICP-MS at the Univer-sity of St Andrews. It was not possible to calculateDr
for JOS13 and instead the average value for JOS14 and JOS18 has been used. The K-feldspar samples analysed were not etched, and therefore an alpha con-tribution to their Dr has also been incorporated.
Alpha and beta attenuation factors after Bell (1980), Mejdahl (1979) and Readhead (2002a, b) were used and conversion factors after Adamiec & Aitken (1998). A concentration of 12% K was assumed for the internalβ-dose of K-feldspar samples (Huntley & Baril 1997), and an a-value of 0.15±0.05 (Balescu & Lamothe 1992). Following calculation of Dr (Gy
ka−1), sample age was calculated: Age (ka) = D
[image:5.595.41.275.63.230.2]e/Dr
[image:5.595.41.518.636.717.2](Table 2).
Fig. 2. Typical K-feldspar conventional IRSL decay curve measured using a Risø TL/OSL laboratory system. The inset shows the stand-ardized growth curve for sample JOS13. The standstand-ardized growth curve was constructed from the average dose response of 12 aliquots (1σuncertainties are within the data points). The average Ln/Tn•TD
value for all 48 aliquots of JOS13 is shown on they-axis with 1 standard error uncertainties.
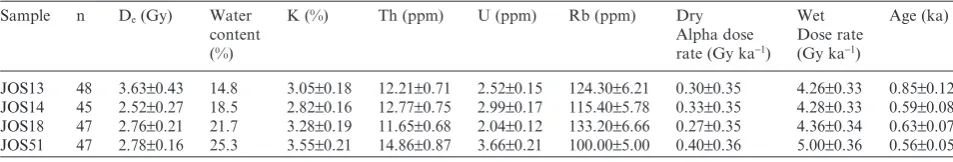
Table 2. Age-modelled Devalues and calculated ages. All samples were modelled with the three-component minimum age model (Galbraith
& Laslett 1993), which was selected using the criteria of Bailey & Arnold (2006) with revised critical values (Arnold 2006) after Thrasheret al. (2009).
Sample n De(Gy) Water
content (%)
K (%) Th (ppm) U (ppm) Rb (ppm) Dry
Alpha dose rate (Gy ka−1)
Wet Dose rate (Gy ka−1)
Age (ka)
Results and discussion
Portable reader analyses
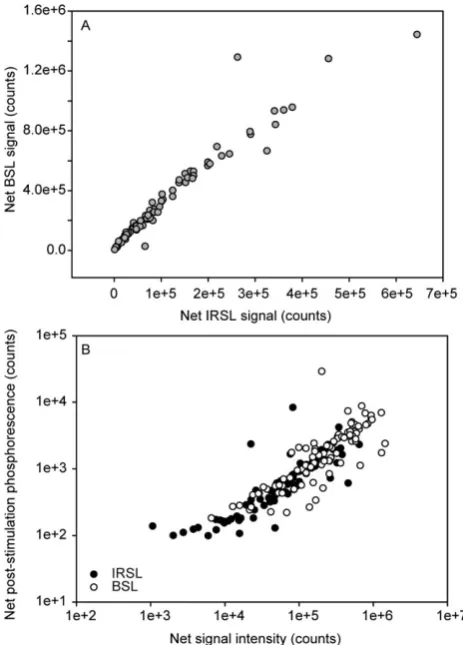
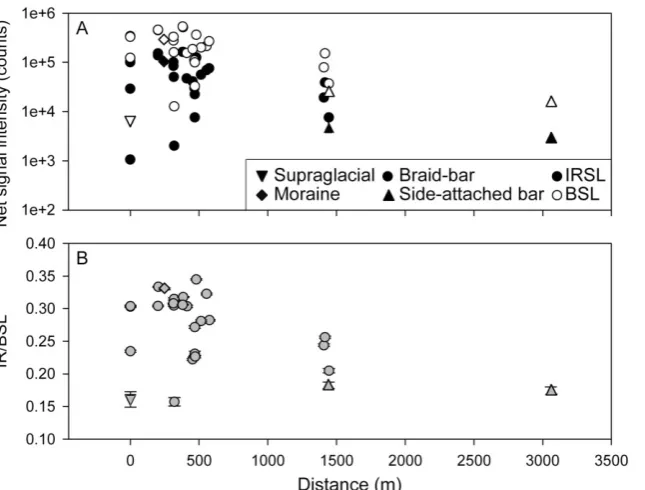
Net IRSL, BSL, IRSL/BSL ratios and PSP were calcu-lated following signal background corrections for all measurements (Table 3). Signals were background cor-rected using the preceding dark count measurement to avoid PSP. All samples exhibited measurable lumines-cence signals that exceeded system dark counts (Fig. 3). Luminescence decay curves are similar for the BSL and IRSL signals, and both can be well fitted with an expo-nential decay (r2>0.9, Fig. 3). All of the samples exhib-ited brighter BSL than IRSL, and samples with dim IRSL also had dim BSL. Stimulating a deposit with infra-red light, prior to blue light can help to isolate the luminescence contributions of different minerals (e.g. Roberts 2007). However, quartz emissions are much less bright than feldspar emissions, and it is thus likely that both IRSL and BSL signals measured from these bulk samples at room temperature are predominantly from feldspars. This is supported by the strong corre-lation (r2 =0.93) between BSL and IRSL signal inten-sities for all samples (Fig. 4A).
Post-stimulation phosphorescence was brightest fol-lowing BSL, and there is a positive correlation between BSL and background-corrected BSL PSP (r2 = 0.60), and IRSL and background-corrected IRSL PSP (r2 = 0.47; Fig. 4B). The subtle variations in PSP intensity, beyond that explained by differences in IRSL and BSL signal intensities, may reflect variations in mineral com-position between samples (Sanderson & Murphy 2010). This paper is concerned with exploring catchment scale changes in sample luminescence residual signals and therefore no further investigations into the causes of PSP variability have been carried out at this stage. Contrasting portable reader and conventional OSL analyses of glacial sediments
Prior to investigating the application of portable reader luminescence measurements to explore the unbleached residual luminescence signals of glacial sediments, it is necessary to understand what the different luminescence signals are responding to. A suite of 27 glacial sediment samples from Jostedalen, which have been previously investigated using conventional quartz and K-feldspar OSL SAR analyses (Kinget al. 2013; 2014), and four K-feldspar samples described here, were also analysed using the portable reader. Portable reader net signal intensities, IR/BSL ratios and conventional OSL age-modelled ages, overdispersion values and average test dose signal intensities (Tx, Table 3) were contrasted
using Pearson’s correlation coefficient (Table 4), calcu-lated in RStudio (R Development Core Team 2011). The test dose is fixed within SAR protocols in order to monitor sensitivity changes, identified as changing lumi-nescence responses, throughout analysis (Murray &
Wintle 2000) and provides information regarding the luminescence sensitivity (brightness) of a sample. Net signal intensities. –For the majority of samples, there is no correlation between the portable reader net signal intensities and Tx signal intensity. However,
whereas the coarse-grained K-feldsparTxsignal
inten-sities of samples from Fåbergstølsgrandane exhibit no relationship with the portable reader signal (r=0.310). Coarse-grained quartzTxsignal intensities of the same
samples do correlate with the portable reader net IRSL signals (r=0.648), and portable reader net BSL signals (r = 0.697), although neither of these correlations is significant at the 95% confidence interval. In contrast the coarse-grained K-feldspar Tx signal intensities of
samples from Nigardsdalen are well correlated with the portable reader net IRSL signal (r = 0.930), which is significant at the 95% confidence interval, and with the portable reader net BSL signals (r = 0.739). On this basis therefore, portable reader net signal intensities may be considered indicative of the sensitivity of the coarse-grained quartz and/or K-feldspar extracts for some, but not all, of the samples presented here.
The portable reader net signal intensities were also contrasted with the age-modelled conventional OSL ages for the different deposits, and all samples exhibit a positive correlation of r≥0.576. Where the quartz and K-feldspar samples are grouped together and ana-lysed, statistically significant correlations are recorded between net IRSL and net BSL and the age-modelled ages for both minerals. Portable reader results are therefore informative about the age-modelled ages of different glacial sediments, which is commonly the most important output of conventional OSL dating. IR/BSL ratios. – Conventional OSL analyses from these catchments have revealed these deposits to be partially bleached with wide and variableDe
distribu-tions (e.g. King et al. 2013), as measured using the sample overdispersion values (σd). The variability in the degree of signal resetting is clearly visible in the port-able reader data, which vary in intensity over several orders of magnitude. Some studies have reported dif-ferential bleaching between quartz and feldspar in glacifluvial depositional settings (e.g. Klasen et al. 2007: fig. 6); therefore, the relative net intensities of the IRSL and BSL signals may also encode information about the degree of partial bleaching of sediments. However, this can only be determined through calcu-lating the IR/BSL ratios of a range of deposits because a baseline IR/BSL ratio must be established. This is because different luminescence signals have different signal intensities, and thus the BSL signal may be brighter than the IRSL signal, whilst relating to a dose of equal amount.
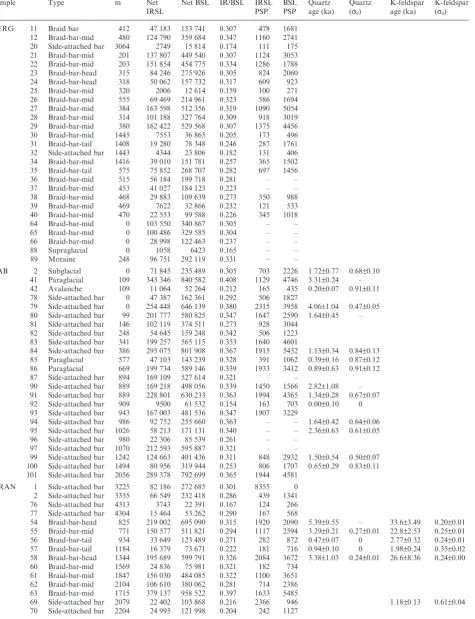
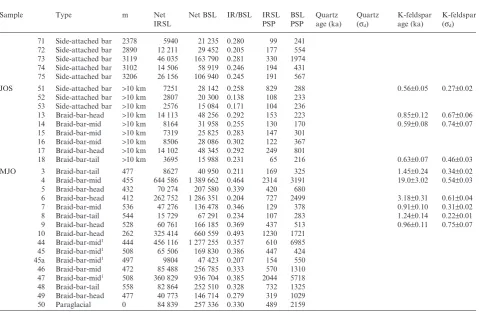
Table 3. SUERC-PR and conventional OSL data summary. m=distance from ice margin. Samples without an overdispersion (σd) value have
fewer than 20 aliquots.
Sample Type m Net
IRSL
Net BSL IR/BSL IRSL PSP
BSL PSP
Quartz age (ka)
Quartz (σd)
K-feldspar age (ka)
K-feldspar (σd)
BERG 11 Braid bar 412 47 183 153 741 0.307 478 1681
12 Braid-bar-mid 480 124 790 359 684 0.347 1160 2741 20 Side-attached bar 3064 2749 15 814 0.174 111 175 21 Braid-bar-mid 201 137 807 449 540 0.307 1124 3053 22 Braid-bar-mid 203 151 854 454 775 0.334 1286 1788 23 Braid-bar-head 315 84 246 275 926 0.305 824 2060 24 Braid-bar-head 318 50 062 157 732 0.317 609 923
25 Braid-bar-mid 320 2006 12 614 0.159 100 271
26 Braid-bar-mid 555 69 469 214 961 0.323 586 1694 27 Braid-bar-mid 384 163 598 512 356 0.319 1090 5054 28 Braid-bar-mid 314 101 188 327 764 0.309 918 3019 29 Braid-bar-mid 380 162 422 529 568 0.307 1375 4456
30 Braid-bar-mid 1445 7553 36 865 0.205 173 496
31 Braid-bar-tail 1408 19 280 78 348 0.246 287 1761 32 Side-attached bar 1443 4344 23 806 0.182 131 406 34 Braid-bar-mid 1416 39 010 151 781 0.257 365 1502 35 Braid-bar-tail 575 75 852 268 707 0.282 697 1456
36 Braid-bar-mid 515 56 184 199 718 0.281 – –
37 Braid-bar-mid 453 41 027 184 123 0.223 – –
38 Braid-bar-mid 468 29 883 109 639 0.273 350 988
39 Braid-bar-mid 469 7622 32 866 0.232 121 533
40 Braid-bar-mid 470 22 553 99 588 0.226 345 1018
64 Braid-bar-mid 0 103 550 340 867 0.305 – –
65 Braid-bar-mid 0 100 486 329 585 0.304 – –
66 Braid-bar-mid 0 28 998 122 463 0.237 – –
88 Supraglacial 0 1058 6423 0.165 – –
89 Moraine 248 96 751 292 119 0.331 – –
FAB 2 Subglacial 0 71 845 235 489 0.305 703 2226 1.72±0.77 0.68±0.10 41 Paraglacial 109 343 346 840 582 0.408 1129 4746 3.31±0.24 – 42 Avalanche 109 11 064 52 264 0.212 165 435 0.20±0.07 0.91±0.11 78 Side-attached bar 0 47 387 162 361 0.292 506 1827
79 Side-attached bar 0 254 448 646 139 0.380 2315 3958 4.06±1.04 0.47±0.05 80 Side-attached bar 99 201 777 580 825 0.347 1647 2590 1.64±0.45 – 81 Side-attached bar 146 102 119 374 511 0.273 928 3044
82 Side-attached bar 248 54 645 159 248 0.342 506 1223 83 Side-attached bar 341 199 257 565 115 0.353 1640 4601
84 Side-attached bar 386 295 075 801 908 0.367 1915 5432 1.13±0.34 0.84±0.13 85 Paraglacial 577 47 103 143 239 0.328 391 1062 0.39±0.16 0.87±0.12 86 Paraglacial 669 199 734 589 146 0.339 1933 3412 0.89±0.63 0.91±0.12 87 Side-attached bar 894 169 109 527 614 0.321 – –
90 Side-attached bar 889 169 218 498 056 0.339 1450 1566 2.82±1.08 – 91 Side-attached bar 889 228 801 630 233 0.363 1994 4365 1.34±0.28 0.67±0.07 92 Side-attached bar 909 9500 61 532 0.154 163 703 0.00±0.10 0 93 Side-attached bar 943 167 003 481 536 0.347 1907 3229
94 Side-attached bar 986 92 752 255 660 0.363 – – 1.64±0.42 0.64±0.06 95 Side-attached bar 1026 58 213 171 131 0.340 – – 2.36±0.63 0.61±0.05
96 Side-attached bar 980 22 306 85 539 0.261 – –
97 Side-attached bar 1070 212 593 595 887 0.321 – –
99 Side-attached bar 1242 124 663 401 436 0.311 848 2932 1.50±0.54 0.50±0.07 100 Side-attached bar 1494 80 956 319 944 0.253 806 1707 0.65±0.29 0.83±0.11 101 Side-attached bar 2056 289 378 792 699 0.365 1944 4581
GRAN 1 Side-attached bar 3225 82 186 272 685 0.301 8355 0 2 Side-attached bar 3335 66 549 232 418 0.286 439 1341 76 Side-attached bar 4313 3743 22 391 0.167 124 266 77 Side-attached bar 4304 15 464 53 262 0.290 167 568
54 Braid-bar-head 825 219 002 695 090 0.315 1920 2090 5.39±0.55 – 33.6±3.49 0.20±0.01 55 Braid-bar-mid 771 150 577 511 821 0.294 1117 2594 3.29±0.21 0.27±0.01 22.8±2.53 0.25±0.01 56 Braid-bar-tail 934 33 649 123 489 0.271 282 872 0.47±0.07 0 2.77±0.32 0.24±0.01 57 Braid-bar-tail 1184 16 379 73 671 0.222 181 716 0.94±0.10 0 1.98±0.24 0.35±0.02 58 Braid-bar-head 1344 195 689 599 791 0.326 2084 3672 3.38±1.03 0.24±0.01 26.6±8.36 0.24±0.00
60 Braid-bar-mid 1569 24 836 75 981 0.321 182 734
61 Braid-bar-mid 1847 156 030 484 085 0.322 1100 3651 62 Braid-bar-mid 2104 106 610 380 062 0.281 714 2386 63 Braid-bar-mid 1715 379 137 958 522 0.397 1633 5485
69 Side-attached bar 2079 22 402 103 868 0.216 2366 946 1.18±0.13 0.61±0.04
of variability is not recorded within the IR/BSL ratios: values range from 0.14 to 0.50. Changing IR/BSL ratios are likely to be dependent upon the influx of sediments of unsorted mineralogy, as well as variable sunlight exposure histories, whereas the
over-dispersion values of conventional single-aliquot OSL measurements reflect the differential bleaching of min-erals of a single type (assuming that there are no mineral inclusions) and grain size. Correlation coeffi-cients are also low between IR/BSL ratios and overdispersion values (Table 4), which highlights that for these samples portable reader IR/BSL ratios are relatively insensitive to the effects of partial bleaching, in comparison to conventional single-aliquot OSL analyses. This may be a consequence of measuring the luminescence response of grams, rather than milligrams of material as is done in conventional single-aliquot OSL investigations, or alternatively reflect that a dif-ferent variable, such as mineralogical composition is controlling the changing IR/BSL ratios of these depos-its. It is also likely that both the IR and post-IR BSL signals are dominated by the luminescence response of feldspars, masking any differential bleaching between quartz and feldspar.
Summary of comparisons between portable reader and conventional SAR analyses. –Comparison of the port-able reader and conventional SAR data for a range of different glacial sediments has shown that the portable reader analyses provide an effective screening
mecha-Table 3. Continued
Sample Type m Net
IRSL
Net BSL IR/BSL IRSL PSP
BSL PSP
Quartz age (ka)
Quartz (σd)
K-feldspar age (ka)
K-feldspar (σd) 71 Side-attached bar 2378 5940 21 235 0.280 99 241
72 Side-attached bar 2890 12 211 29 452 0.205 177 554 73 Side-attached bar 3119 46 035 163 790 0.281 330 1974 74 Side-attached bar 3102 14 506 58 919 0.246 194 431 75 Side-attached bar 3206 26 156 106 940 0.245 191 567
JOS 51 Side-attached bar >10 km 7251 28 142 0.258 829 288 0.56±0.05 0.27±0.02
52 Side-attached bar >10 km 2807 20 300 0.138 108 233 53 Side-attached bar >10 km 2576 15 084 0.171 104 236
13 Braid-bar-head >10 km 14 113 48 256 0.292 153 223 0.85±0.12 0.67±0.06
14 Braid-bar-mid >10 km 8164 31 958 0.255 130 170 0.59±0.08 0.74±0.07
15 Braid-bar-mid >10 km 7319 25 825 0.283 147 301 16 Braid-bar-mid >10 km 8506 28 086 0.302 122 367 17 Braid-bar-head >10 km 14 102 48 345 0.292 249 801
18 Braid-bar-tail >10 km 3695 15 988 0.231 65 216 0.63±0.07 0.46±0.03
MJO 3 Braid-bar-tail 477 8627 40 950 0.211 169 325 1.45±0.24 0.34±0.02
4 Braid-bar-mid 455 644 586 1 389 662 0.464 2314 3191 19.0±3.02 0.54±0.03
5 Braid-bar-head 432 70 274 207 580 0.339 420 680
6 Braid-bar-head 412 262 752 1 286 351 0.204 727 2499 3.18±0.31 0.61±0.04
7 Braid-bar-mid 536 47 276 136 478 0.346 129 378 0.91±0.10 0.31±0.02
8 Braid-bar-tail 544 15 729 67 291 0.234 107 283 1.24±0.14 0.22±0.01
9 Braid-bar-head 528 60 761 166 185 0.369 437 513 0.96±0.11 0.75±0.07
10 Braid-bar-head 262 325 414 660 559 0.493 1230 1721 44 Braid-bar-mid1 444 456 116 1 277 255 0.357 610 6985
45 Braid-bar-mid1 508 65 506 169 830 0.386 447 424
45a Braid-bar-mid1 497 9804 47 423 0.207 154 550
46 Braid-bar-mid 472 85 488 256 785 0.333 570 1310 47 Braid-bar-mid1 508 360 829 936 704 0.385 2044 5718
48 Braid-bar-tail 558 82 864 252 510 0.328 732 1325 49 Braid-bar-head 477 40 773 146 714 0.279 319 1029
50 Paraglacial 0 84 839 257 336 0.330 489 2159
[image:8.595.77.557.79.393.2]1Manual operation error resulted in no PSP measurement.
[image:8.595.75.310.513.680.2]nism for relative OSL sample age using either the IRSL or BSL net signal intensities. However changing IR/BSL ratios are unable to identify heterogeneous bleaching in individual samples, which is the key cause of overdispersion measured during conventional OSL analyses for these different glacial deposits. Instead the
ratios most likely reflect changing mineralogical com-positions of the deposits, either by provenance or as a function of sediment sorting throughout transport and deposition. These comparisons show that portable reader analyses provide useful insights into the conven-tional OSL properties of individual mineral and grain-size extracts, and their relative residual doses. The remainder of this paper will explore the potential of portable reader analyses for the investigation of sedi-ment bleaching within glacial environsedi-ments.
Portable reader analyses of sediments from the Jostedøla
The majority of samples analysed in this research are modern glacifluvial deposits that comprise either side-attached or braid-bars which are proximal to the ice front (within 3 km). Within glacial environments, partial bleaching of sediments that have been trans-ported over relatively short distances is known to be problematic (e.g. Berger 1990). A suite of six braid-bar deposits and three side-attached bar deposits were ana-lysed from the Jostedøla river at distances>10 km from any glacial source. As these sediments have been trans-ported much greater distances than the sediments ana-lysed from the glacial catchments, they are more likely to have had their luminescence signals fully reset and provide a control on the effects of partial bleaching, which are often attributed to short transport distances within glacial environments.
[image:9.595.40.272.63.386.2]The IRSL and BSL signal intensities vary between the different side-attached bar and braid-bar deposits, and braid-bar-head deposits have the greatest IRSL and BSL signal intensities. The average IRSL signal intensity for the braid-bar head deposits is 14 108±8 counts (n=2, uncertainty is the standard deviation at 1σ), and the average BSL signal intensity is 48 837±21 counts. In contrast, the braid-bar-mid deposits sampled have average IRSL signal intensity of 7996±611 counts and average BSL signal intensity of 29 120±3304 counts
Fig. 4. A. Correlation of net IRSL and BSL signal intensities. B. Correlation of net signal intensities and poststimulation phosphores-cence for all samples analysed.
Table 4. Pearson’s r correlation coefficients for conventional SAR OSL analyses and portable reader net IRSL, BSL and IRSL/BSL ratios. Ages are the age-modelled ages, maximum ages are calculated from the highest Devalue measured for a single aliquot of each sample.σd=
overdispersion.
Mineral Site n Pearson’s r
Net IRSL vs. average Tx
signal intensity
Net BSL vs. average Tx
signal intensity
Net IRSL vs. age Net BSL vs. age n IR/BSL vs.σd
Quartz FAB 15 0.259 0.184 0.629 0.576 13 −0.194
Quartz GRAN 5 0.648 0.697 0.748 0.817 –2 –
Feldspar GRAN 6 0.310 0.254 0.8421 0.9281 6 −0.226
Feldspar MJO 6 0.9301 0.739 0.9661 0.765 6 0.361
Feldspar JOS 4 0.069 0.048 0.795 0.752 4 0.384
Quartz 20 0.287 0.224 0.6541 0.6571 18 0.186
Feldspar 16 0.315 0.294 0.6251 0.6071 16 0.096
1Significant at the 95% confidence interval.
[image:9.595.44.521.570.683.2](n= 3), i.e. braid-bar-mid deposits have signals∼50% smaller than head deposits. The braid-bar-tail deposit (JOS18) has the lowest IRSL (3695 counts) and BSL (15 988 counts) signal intensities of the braid-bar deposits. Following the good correlation between portable reader signal intensities and SAR quartz and K-feldspar age-modelled ages, the different signal intensities between the bar-heads, bar-mids and bar-tail are interpreted to reflect improved sediment bleaching and reducing residual doses with transport across the bar features, rather than changing mineralogical com-positions. This may be a consequence of changing water depths, and increased opportunities for sub-aerial exposure during transport across braid-bars.
The side-attached bar deposits have similar lumines-cence properties to the braid-bar-mid and -tail deposits; IRSL signal intensities are 4211±2643 counts and BSL signal intensities are 20 277±4891 counts (n =3). This suggests that side-attached bar deposits are also better bleached than braid-bar-head deposits, and that the braid-bar-mid and tail deposits and side-attached bar deposits have experienced similar degrees of sediment bleaching, perhaps due to having similar exposure potential as a consequence of similar transport pro-cesses and rates. Whereas braid-bar-head deposits are essentially comprised of higher grain sizes and sediment that accumulates under deeper and more turbulent flows, sediment on braid-bar-mids, -tails and side-attached bars may be transported under lower energy conditions and at lower transport rates across the bar, providing improved bleaching opportunities.
The coarse-grain (180–212μm) K-feldspar fraction of a braid-bar-head (JOS13), -mid (JOS14) and -tail deposit (JOS18), as well as one of the side-attached bar deposits (JOS51), have been dated using a SAR proto-col, resulting in ages of<1 ka (Table 2). The braid-bar-head deposit (JOS13) has the greatest residual age (0.85±0.12 ka) of the deposits analysed, whereas the side-attached bar deposit (JOS51) has the lowest residual age (0.56±0.05 ka), which is within uncertain-ties of the braid-bar-mid (JOS14) and -tail (JOS18) deposits (Table 2). Overdispersion values are more variable and range from 27±2% (n= 47) for the side-attached bar deposit (JOS51), to 74±7% (n=45) for the braid-bar-mid deposit (JOS14). An increase in over-dispersion is recorded between the braid-bar-head (JOS13) and the -mid and -tail deposits (JOS14, JOS18), and is interpreted to reflect increased sediment bleaching with transport across bar features (King et al. 2013). The conventional OSL data support the observations made from the portable reader signal intensities, and show that sediments may not be com-pletely bleached even after transport over>10 km from glacial source regions, but that side-attached bar depos-its and braid-bar-tail deposdepos-its have both the lowest conventional OSL residual doses and portable reader luminescence signal intensities.
Portable reader analyses: Fåbergstølsdalen and Bergsetdalen
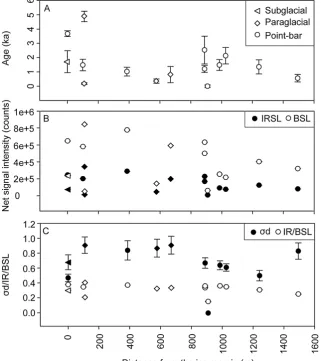
Fåbergstølsdalen. – Glacifluvial side-attached bar deposits were sampled along a transect from the ice margin up to 2 km from the glacial snout in Fåbergstølsdalen, and various source sediments includ-ing subglacial and paraglacial material were also sampled. The portable reader IRSL signal intensities of the side-attached bar deposits range from 9500 to 343 346 counts and net BSL signal intensities also vary over an order of magnitude from 52 338 to 841 870 counts. The different side-attached bar deposits sampled do not exhibit any systematic variation in IRSL net signal intensities throughout the catchment (Fig. 5), similar to the results of conventional quartz OSL analyses (Fig. 6A), which showed only a slight reduction in residual age with transport distance (King et al. 2013). However there is a slight reduction in BSL signal intensity with transport distance (Fig. 6B). Com-parison of the portable reader IRSL and BSL net signal intensities with conventional quartz OSL data (Fig. 6) shows that they follow broadly similar trends to the age-modelled ages. Overdispersion values are more variable than the IR/BSL ratios (Fig. 6C), in agreement with the low correlation coefficient between these vari-ables (Table 4).
The different source sediments have different lumi-nescence signal intensities, which are dependent upon the specific deposit type. FAB42 is an avalanche deposit, and has one of the lowest IRSL signal sities (11 064 counts) and the lowest BSL signal inten-sity recorded for the Fåbergstølsdalen samples. These low values can be explained by the high bleaching opportunities of material exposed at the surface fol-lowing transport via avalanching, and similarly low values are obtained when this deposit is dated using conventional quartz SAR: 0.18±0.06 ka (King et al. 2013). In contrast, FAB41 is a slope failure deposit and has the brightest IRSL and BSL signal intensities of the Fåbergstølsdalen samples as well as one of the greatest residual ages of sediments from this catch-ment: 3.31±0.24 ka (King et al. 2013). In contrast to an avalanche deposit (e.g. FAB42), material trans-ported by slope failure through debris flows and sheet wash (e.g. FAB41, FAB86) has more limited sunlight exposure opportunities, although this is dependent upon the scale and duration of the event. The vari-ability in the properties of the different source sedi-ment types highlights the variety and complexity of the different depositional processes operating within Fåbergstølsdalen.
Con-ventional quartz SAR analyses were attempted on 10 samples from Bergsetdalen; however, low signal inten-sities and poor recycling ratios meant that analyses were not pursued (King 2012). Samples from Bergsetdalen have amongst the lowest IRSL and BSL signal intensities of the entire sample suite (Fig. 7). IRSL and BSL signal intensities vary by one order of magnitude between the various braid-bar deposits analysed, and IRSL signals are an order of magnitude smaller than BSL signals. Two side-attached bar deposits (BERG20 and BERG32) were also sampled from Bergsetdalen, and have some of the lowest net luminescence signals recorded within the catchment (Table 3). A single supraglacial sample (BERG88) was
[image:11.595.42.522.63.501.2]analysed and has the lowest net BSL signal (6423 counts) and IRSL signal (1058 counts) intensities measured for the Bergsetdalen samples. This deposit is likely to be completely bleached based upon its depo-sitional context, and thus this provides a benchmark against which the degree of bleaching of the other sediments within this catchment can be evaluated. A moraine deposit (BERG89) was also analysed from Bergsetdalen, and has a net IRSL signal intensity of 96 751 counts, which is one of the highest signal inten-sities measured for this catchment, although BERG27 and BERG29, which are braid-bar deposits, have the brightest net IRSL and net BSL signals, respectively.
Sediments in Bergsetdalen are sourced from subglacial material and paraglacial material on the west valley side, which has been exposed by recent glacial retreat, as well as a limited volume of supraglacial mate-rial. The meltwater stream dissects a single moraine in the upper catchment, and a limited amount of material is obtained from snow avalanching; however, apart from these minor contributors there are no other direct sedi-ment inputs into the meltwater channel. Consequently the residual luminescence signals are anticipated to reduce with transport throughout the catchment, as material has greater opportunity for sunlight exposure. A weak trend towards reducing net signal intensity with increasing transport distance was recorded in Bergsetdalen (Figs 7, 8), showing that sediments in Bergsetdalen are better bleached as meltwater transport distance increases in agreement with previous observa-tions elsewhere (e.g. Gemmell 1999).
Comparisons of portable reader analyses: Fåbergstøls-dalen and BergsetFåbergstøls-dalen. –The residual IRSL and BSL signals in Fåbergstølsdalen were greater than those
recorded in Bergsetdalen for transport over similar dis-tances (Figs 6, 8). A slight reduction in signal with increasing transport is recorded for the BSL signal in Fåbergstølsdalen (Fig. 6B), whereas both the IRSL and BSL signals decrease in Bergsetdalen (Fig. 8). The difference in signal intensities and changing residual luminescence signals can be explained by the contrasting geomorphology and transport processes of the two catchments. Transport and deposition in Fåbergstølsdalen involve the remobilization of paraglacial sediments by debris flows throughout the entire upper catchment, whereas most of the sediment transported in Bergsetdalen is entrained from deposits within∼300 m of the glacial snout. Thus, source sedi-ments are transported over longer distances prior to deposition in the Bergsetdalen meltwater stream, which affords improved bleaching opportunities.
[image:12.595.75.397.66.428.2]If the entrainment of source materials does explain the differences in luminescence signal intensities recorded between the two catchments, then the upper 300 m of Bergsetdalen may reflect a similar variability in lumines-cence intensities to that recorded across the entire
Fig. 6. Comparison of portable reader and conventional SAR data for
Fåbergstølsdalen catchment. Examination of Fig. 8 shows that signals vary most in the upper catchment of Bergsetdalen, and that the range of luminescence inten-sities recorded for the different signals reduces with increasing transport distance; variations in signal intensities are greater than those recorded in Fåbergstølsdalen (Fig. 6B). The source sediments between the two catchments are similar, in that they comprise subglacial and paraglacial sediments; however, the total flux of paraglacial sediments in Fåbergstølsdalen is much greater. Thus, the increased variability in signal intensities recorded in Bergsetdalen is likely to reflect sediments approaching complete signal bleaching, whereas deposits in Fåbergstølsdalen
retain a greater residual dose. The contrasting behav-iour between Bergsetdalen and Fåbergstølsdalen shows that portable reader measurements of bulk sediments are sensitive to differences in residual luminescence signals caused by changing source sediment inputs and sediment transport processes.
Portable reader analyses: Fåbergstølsgrandane
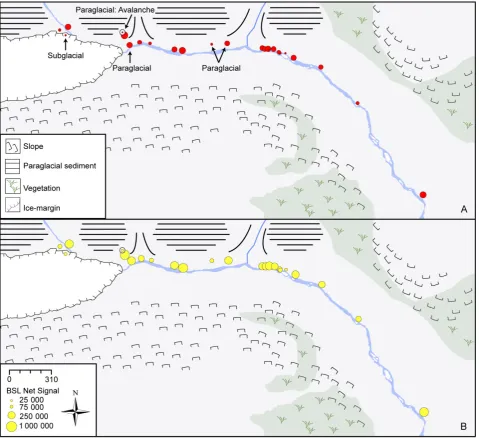
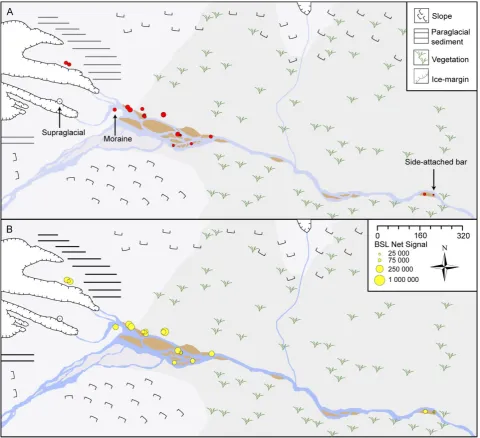
[image:13.595.41.522.63.501.2]Fåbergstølsgrandane has some of the largest and small-est residual IRSL and BSL signals of the different catchments analysed (maximum IRSL: 379 137 and maximum BSL: 958 522 counts; minimum IRSL: 3743 and minimum BSL: 21 235 counts). When considering
the spatial distribution of these data and their specific depositional contexts, the extreme values are the product of two distinct depositional environments (Fig. 9). The greatest IRSL and BSL signals are asso-ciated with braid-bar deposits along the northeast sandur side, whereas the smallest signals are associated with a suite of side-attached bar deposits adjacent to the main meltwater channel. These results are similar to those observed for bar-head deposits, and braid-bar-mid, -tail and side-attached bar deposits from the Jostedøla.
The depositional setting may explain some of the contrasting luminescence properties. The various braid-bar deposits that exhibit the greatest lumines-cence signals are farthest from the main meltwater channel (∼200 m), and thus are only mobilized during high-frequency, low-magnitude events. Turbulent flows result in limited bleaching opportunities as sun-light exposure is reduced both by attenuation of inci-dent rays throughout a turbulent water column (Jerlov 1976) and also by rapid sediment transport. Such episodic transport of material limits the bleach-ing opportunities of sediments deposited at the braid-bar-heads (e.g. GRAN54, GRAN58). However, transport and quiescence across the bar features during waning flow, which results in the downstream accretion of bar tails (e.g. GRAN56, GRAN57), allows relatively more opportunities for sediment bleaching. Portable reader luminescence signals can be seen to reduce across individual bar features (Fig. 9): GRAN54, GRAN55 and GRAN56 are sampled from the braid-bar-head, -mid and -tail of the same feature. The rate of down-bar bleaching can be much higher
than an average downstream bleaching rate for channel deposits, a phenomenon that is similar to the very different rates of grain-size decrease on indi-vidual bars and channel deposits (Rice & Church 2010). King et al. (2014) recorded the same relation-ship in conventional OSL dating of coarse-grained quartz and K-feldspar. Braid-bar-tail deposits there-fore show the best bleached material using conven-tional OSL dating and also the smallest portable reader luminescence signal intensities. In contrast to the braid-bar-head deposits, the side-attached bar deposits (e.g. GRAN76), which form the second depo-sitional environment, are reworked during moderate discharge. This results in more frequent transport events as moderate discharges occur more frequently than elevated discharges, therefore increasing the opportunities for sediment bleaching. These observa-tions are also supported by the portable reader and K-feldspar SAR data for the side-attached bar and braid-bar deposits from the Jostedøla discussed above. There are no samples that investigate the rate of bleaching across an individual side-attached bar.
[image:14.595.80.403.62.307.2]It is not possible to separate the two different depo-sitional sub-environments for Fåbergstølsgrandane completely using the PR luminescence signals alone, because the braid-bar-tail deposits from the first envi-ronment have residual luminescence signals as low as the side-attached bar deposits. Luminescence signal intensity data cannot therefore be taken in isolation of depositional context (i.e. spatial location) when making inferences about specific depositional path-ways, although it does encode information about depositional processes. Both the braid-bar-tail and
side-attached bar deposits have the lowest IRSL and BSL signals (Table 3) and are likely to be suitable for conventional luminescence dating because they are well bleached. This proposition is validated through the observations of King et al. (2014) that braid-bar-tail deposits have the lowest residual luminescence signals during conventional coarse-grained K-feldspar and quartz single aliquot SAR analyses; thus these data also show that the portable reader can be used as an effective screening mechanism in sample selection.
Portable reader analyses: Nigardsdalen
The final catchment investigated is Nigardsdalen, which has a dominant sediment source of subglacial material that is transported via the meltwater stream onto the proglacial fan delta. The fan delta comprises a
suite of braid-bar deposits, and as such forms a similar depositional environment to that identified for the northeast of Fåbergstølsgrandane, although sediments have a maximum transport distance of ∼500 m. Nigardsdalen exhibits the greatest residual lumines-cence intensities of the different catchments analysed (maximum IRSL: 644 586 counts, maximum BSL: 138 9662 counts; Fig. 10); however, the residual ages of bar-head deposits (e.g. MJO6) from this catchment determined from the SAR of coarse-grained K-feldspar are lower than those recorded in Fåbergstølsgrandane (Kinget al. 2014). Thus, the high residual luminescence signals are potentially caused by different mineralogy, which has greater luminescence sensitivity due to dif-ferences in the bedrock geology between the two catch-ments: Fåbergstølsgrandane is underlain by quartz diorite, whereas the upper catchment of Nigardsdalen is underlain by quartz monzanite. Therefore although
[image:15.595.201.520.63.489.2]75 000 250 000 1 000 000 25 000
the relative signal intensities of different samples can be usefully contrasted, caution should be taken in making inferences about residual doses between catchments from signal intensity data alone.
The net IRSL and BSL signals both vary over two orders of magnitude within Nigardsdalen, and exhibit a clear reduction in signal intensity during downstream transport across the delta (Fig. 10), which is conducive with increasing opportunities for bleaching with trans-port distance. Improved bleaching is also visible across individual bar features, e.g. MJO9, MJO7 and MJO8 are sampled from the braid-bar-head, -mid and -tail of the same feature. A more complicated pattern is recorded amongst MJO5, MJO4 and MJO3, which are sampled from a braid-bar-head, -mid and -tail of the same feature, as MJO4 has the brightest signal intensity
(IRSL 644 586 counts, BSL 138 9662 counts). This reflects the location of sample MJO4 adjacent to a cross-over chute channel, and highlights the sensitivity of luminescence signals to transport and depositional processes. Bar morphology and bar-channel interac-tion influence the PR luminescence signal of a sediment and again highlight the importance of careful sample selection when glacifluvial sediments are collected.
[image:16.595.77.397.62.510.2]The IRSL and BSL signal intensities reduce dramati-cally across the fan delta, showing that bleaching occurs very rapidly over short distances (<560 m) within this depositional environment. Following from the observations discussed for braid-bar deposits from the Jostedøla and Fåbergstølsgrandane, this suggests that transport across the Nigardsdalen delta comprises multiple steps during moderate flows, rather than rapid
transport during periods of elevated discharge. This is because lower energy transport processes within this specific depositional environment results in better opportunities for sunlight exposure and sediment bleaching. The best-bleached samples are braid-bar-tail deposits (e.g. MJO3), which supports observations from the Jostedøla and Fåbergstølsgrandane that the best-bleached material in braid-bar systems is that sampled from braid-bar-tails. However, a fan delta deposit results from flow expansion and this lateral spreading (rather than vertical accumulation) of sedi-ment may provide bleaching opportunities for more sediment grains during deposition.
Conclusions
The residual luminescence signals of different modern glacifluvial sediments sampled from a suite of different glacial catchments have been shown to vary dependent upon specific depositional setting. Use of a portable OSL reader facilitated the rapid analysis of 96 samples enabling investigation of sediment bleaching at both the catchment scale, and across individual glaciofluvial bar features. Contrasting net IRSL and BSL signals meas-ured using the PR with conventional OSL ages has shown that for these deposits, the luminescence signals of bulk, multi-mineral samples that have experienced no pretreatment prior to measurement provide insights into conventional single mineral, single grain-size OSL ages. Residual luminescence signals reduce with increas-ing transport distance and associated improved bleach-ing opportunities in all catchments with the exception of Fåbergstølsdalen, where the influx of paraglacial mate-rial results in elevated residual luminescence signals. Braid-bar-tail deposits and side-attached bar deposits have been shown to be best bleached in a range of different glacifluvial environments. These observations will help to inform sampling procedures for conven-tional OSL dating applications, helping to reduce the likelihood of sampling partially reset sediments.
Modern analogue investigations are frequently employed within conventional OSL dating projects to identify depositional sub-environments which contain sediments that have been fully reset. The portable reader provides a rapid, cheap and effective means of screening samples for conventional luminescence analyses, and can be used independently with informa-tion about deposiinforma-tional setting to make inferences about the relative bleaching opportunities offered by different transport and depositional processes.
Acknowledgements.−G.E. King undertook this research whilst in receipt of NERC studentship F008589/1 and is SAGES affiliated. L. Carmichael and S. Fisk (SUERC) and R. Sommerville, A. Calder and D. Herd (University of St Andrews) are thanked for laboratory assistance. D. Lowry (University of St Andrews), E. Harris (Swansea University), L. Baek Nielson, C. Caballero and A. Cullens (IceTroll) are thanked for fieldwork assistance. Financial support in the form of
a New Workers Research Award is acknowledged from the Quater-nary Research Association. Mark Bateman and Sébastien Huot are thanked for their constructive comments on an earlier version of this manuscript.
References
Adamiec, G. & Aitken, M. J. 1998: Dose-rate conversion factors: update.Ancient TL 16, 37–46.
Alexanderson, H. 2007: Residual OSL signals from modern Greenlandic river sediments.Geochronometria 26, 1–9.
Alexanderson, H. & Murray, A. S. 2012: Luminescence signals from modern sediments in a glaciated bay, NW Svalbard.Quaternary Geochronology 10, 250–256.
Arnold, L. J. 2006:Optical dating and computer modelling of arroyo epicycles in the American Southwest. D.Phil. thesis, University of Oxford, 735 pp.
Bailey, R. M. & Arnold, L. J. 2006: Statistical modelling of single grain quartz d-e distributions and an assessment of procedures for estimating burial dose.Quaternary Science Reviews 25, 2475–2502. Balescu, S. & Lamothe, M. 1992: The blue emission of K-feldspar coarse grains and its potential for overcoming TL age underesti-mation.Quaternary Science Reviews 11, 45–51.
Ballantyne, C. K. & Benn, D. I. 1994: Paraglacial slope adjustment and resedimentation following recent glacier retreat, Fåbergstølsdalen, Norway.Arctic and Alpine Research 26, 255–269. Bell, W. T. 1980: Alpha dose attenuation in quartz grains for
thermoluminescence dating.Ancient TL 12, 4–8.
Berger, G. W. 1990: Effectiveness of natural zeroing of the thermoluminescence in sediments.Journal of Geophysical Research 95, 12375–12397.
Bickerton, R. W. & Matthews, J. A. 1993: Little ice age variations of outlet glaciers from the Jostedalsbreen ice-cap, Southern Norway: a regional lichenometric-dating study of ice-marginal moraine sequences and their climatic significance.Journal of Quaternary Science 8, 45–66.
Bishop, P., Sanderson, D., Hansom, J. I. M. & Chaimanee, N. 2005: Age-dating of tsunami deposits: lessons from the 26 December 2004 tsunami in Thailand.Geographical Journal 171, 379–384. Blair, M. W., Yukihara, E. G. & McKeever, S. W. S. 2005:
Experi-ences with single-aliquot OSL procedures using coarse-grain feld-spars.Radiation Measurements 39, 361–374.
Bøe, A. G., Murray, A. & Dahl, S. O. 2007: Resetting of sediments mobilised by the LGM ice-sheet in southern Norway.Quaternary Geochronology 2, 222–228.
Bøtter-Jensen, L., McKeever, S. W. S. & Wintle, A. G. 2003: Opti-cally Stimulated Luminescence Dosimetry. 355 pp. Elsevier Science, Amsterdam.
Bryhni, I. & Sturt, B. A. 1985: Caledonides of southwestern Norway. InGee, D. E. & Sturt, B. A. (eds.):The Caledonide Orogen, 89–109. John Wiley & Sons, Chichester.
Burbidge, C. I., Sanderson, D. C. W., Housley, R. A. & Allsworth Jones, P. 2007: Survey of Palaeolithic sites by lumines-cence profiling, a case study from Eastern Europe. Quaternary Geochronology 2, 296–302.
Buylaert, J. P., Murray, A. S., Thomsen, K. J. & Jain, M. 2009: Testing the potential of an elevated temperature IRSL signal from K-feldspar.Radiation Measurements 44, 560–565.
Buylaert, J. P., Vandenberghe, D., Murray, A. S., Huot, S., De Corte, F. & Van den Haute, P. 2007: Luminescence dating of old (>70 ka) Chinese loess: a comparison of single-aliquot OSL and IRSL tech-niques.Quaternary Geochronology 2, 9–14.
Duller, G. A. T. 1992: Luminescence chronology of raised marine terraces, south-west North Island, New Zealand. Ph.D. thesis, Uni-versity of Wales, 147 pp.
Duller, G. A. T. 2005:Luminescence Analyst. 43 pp. University of Wales, Aberystwyth.
Galbraith, R. F. & Laslett, G. 1993: Statistical models for mixed fission track ages.Radiation Measurements 21, 459–470. Gemmell, A. M. D. 1997: Fluctuations in the thermoluminescence
signal of suspended sediemnt in an alpine glacial meltwater stream. Quaternary Science Reviews 16, 281–290.
Gemmell, A. M. D. 1999: IRSL from fine-grained glacifluvial sedi-ment.Quaternary Science Reviews 18, 207–215.
Holtedahl, O. 1960:Geology of Norway. 540 pp. I Kommisjon Hos H. Aschehoug & Co., Oslo.
Holtedahl, O. & Dons, J. A. 1960: Geologisk kart over Norge Berggrunnskart (Geological map of Norway (Bedrock)). Scale 1: 1 000 000.Norges Geologiske Undersøkelse 208.
Huntley, D. J. & Baril, M. R. 1997: The K content of the K-feldspars being measured in optical dating or in thermoluminescence dating. Ancient TL 15, 11–13.
Huot, S. & Lamothe, M. 2003: Variability of infrared stimulated luminescence properties from fractured feldspar grains.Radiation Measurements 37, 499–503.
Jerlov, N. G. 1976:Marine Optics. 231 pp. Elsevier, New York. King, G. E. 2012:Fundamental and sedimentological controls on the
luminescence of quartz and feldspar. Ph.D. thesis, University of St Andrews, 372 pp.
King, G. E., Robinson, R. A. J. & Finch, A. A. 2013: Apparent OSL ages of modern deposits from Fåbergstølsdalen, Norway: implica-tions for sampling glacial sediments.Journal of Quaternary Science 28, 673–682.
King, G. E., Robinson, R. A. J. & Finch, A. A. 2014: Towards successful OSL sampling strategies in glacial environments: deci-phering the residual OSL signals of quartz and K-feldspar from modern glacial sediments.Quaternary Science Reviews 89, 94–107. Kinnaird, T. C., Sanderson, D. C. W. & Woodward, N. L. 2012: Applying luminescence methods to geoarchaeology: a case study from Stronsay, Orkney.Earth and Environmental Science Transac-tions of the Royal Society of Edinburgh 102, 1–9.
Klasen, N., Fiebig, M., Preusser, F., Reitner, J. M. & Radtke, U. 2007: Luminescence dating of proglacial sediments from the Eastern Alps.Quaternary International 164–165, 21–32.
Lukas, S., Spencer, J. Q. G., Robinson, R. A. J. & Benn, D. I. 2007: Problems associated with luminescence dating of Late Quaternary glacial sediments in the NW Scottish Highlands. Quaternary Geochronology 2, 243–248.
Matthews, J. A., Olaf Dahl, S., Nesje, A., Berrisford, M. S. & Andersson, C. 2000: Holocene glacier variations in central Jotunheimen, southern Norway based on distal glaciolacustrine sediment cores.Quaternary Science Reviews 19, 1625–1647. Mejdahl, V. 1979: Thermoluminescence dating: beta-dose
attenua-tion in quartz grains.Archaeometry 21, 61–72.
Muñoz-Salinas, E., Bishop, P., Zamorano, J.-J. & Sanderson, D. 2012: Sedimentological processes in lahars: insights from optically stimulated luminescence analysis.Geomorphology 136, 106–113. Munyikwa, K., Brown, S. & Kitabwalla, Z. 2012: Delineating
strati-graphic breaks at the bases of postglacial eolian dunes in central Alberta, Canada using a portable OSL reader.Earth Surface Pro-cesses and Landforms 37, 1603–1614.
Murray, A. S. & Wintle, A. G. 2000: Luminescence dating of quartz using an improved single-aliquot regenerative-dose protocol. Radiation Measurements 32, 57–73.
Murray, A. S. & Wintle, A. G. 2003: The single aliquot regenerative dose protocol: potential for improvements in reliability.Radiation Measurements 37, 377–381.
Murray, A. S., Olley, J. M. & Caitcheon, G. G. 1995: Measurement of equivalent doses in quartz from contemporary water-lain sedi-ments using optically stimulated luminescence.Quaternary Science Reviews 14, 365–371.
Nesje, A. & Kvamme, M. 1991: Holocene glacier and climate variations in western Norway: evidence for early Holocene glacier demise and multiple Neoglacial events.Geology 19, 610–612. Nesje, A., Matthews, J. A., Dahl, S. O., Berrisford, M. S. &
Andersson, C. 2001: Holocene glacier fluctuations of Flatebreen and winter-precipitation changes in the Jostedalsbreen region, western Norvay, based on glaciolacustrine sediment records.The Holocene 11, 267–280.
Nesje, A., Dahl, S. O., Andersson, C. & Matthews, J. A. 2000: The lacustrine sedimentary sequence in Sygneskardvatnet, western Norway: a continuous, high-resolution record of the Jostedalsbreen ice cap during the Holocene.Quaternary Science Reviews 19, 1047–1065.
R Development Core Team 2011:R: A Language and Environment for Statistical Computing. R Foundation for Statistical Comput-ing, Vienna.
Readhead, M. L. 2002a: Absorbed dose fraction for87Rbβparticles.
Ancient TL 20, 25–28.
Readhead, M. L. 2002b: Addendum to ‘Absorbed dose fraction for
87Rbβparticles’.Ancient TL 20, 47.
Rhodes, E. J. 2011: Optically stimulated luminescence dating of sedi-ments over the past 200,000 years.Annual Review of Earth and Planetary Sciences 39, 461–488.
Rhodes, E. J. & Bailey, R. M. 1997: The effect of thermal transfer on the zeroing of the luminescence of quartz from recent glaciofluvial sediments.Quaternary Science Reviews 16, 291–298.
Rhodes, E. J. & Pownall, L. 1994: Zeroing of the OSL signal in quartz from young glaciofluvial sediments.Radiation Measurements 23, 581–585.
Rice, S. P. & Church, M. 2010: Grain-size sorting within rivers bars in relation to downstream fining along a wandering channel. Sedimentology 57, 232–251.
Roberts, H. M. 2007: Assessing the effectiveness of the double-SAR protocol in isolating a luminescence signal dominated by quartz. Radiation Measurements 42, 1627–1636.
Roberts, H. M. & Duller, G. A. T. 2004: Standardised growth curves for optical dating of sediment using multiple-grain aliquots. Radia-tion Measurements 38, 241–252.
Roberts, H. M., Durcan, J. A. & Duller, G. A. T. 2009: Exploring procedures for the rapid assessment of optically stimulated lumi-nescence range-finder ages. Radiation Measurements 44, 582– 587.
Sanderson, D. C. W. & Murphy, S. 2010: Using simple portable OSL measurements and laboratory characterisation to help understand complex and heterogeneous sediment sequences for luminescence dating.Quaternary Geochronology 5, 299–305.
Sanderson, D. C. W., Bishop, P., Houston, I. & Boonsener, M. 2001: Luminescence characterisation of quartz-rich cover sands from NE Thailand.Quaternary Science Reviews 20, 893–900.
Sanderson, D. C. W., Bishop, P., Stark, M. T. & Spencer, J. Q. 2003: Luminescence dating of anthropogenically reset canal sediments from Angkor Borei, Mekong Delta, Cambodia. Quaternary Science Reviews 22, 1111–1121.
Shakesby, R. A., Matthews, J. A. & Winkler, S. 2004: Glacier vari-ations in Breheimen, southern Norway: relative-age dating of Holocene moraine complexes at six high-altitude glaciers. The Holocene 14, 899–910.
Stang, D. M., Rhodes, E. J. & Heimsath, A. M. 2012: Assessing soil mixing processes and rates using a portable OSL-IRSL reader: preliminary determinations.Quaternary Geochronology 10, 314– 319.
Thiel, C. 2011:On the applicability of post-IR IRSL dating to different environments. Ph.D. thesis, Freien Universitat Berlin, 186 pp. Thomsen, K. J., Murray, A. S., Jain, M. & Bøtter-Jensen, L. 2008:
Laboratory fading rates of various luminescence signals from feldspar-rich sediment extracts.Radiation Measurements 43, 1474– 1486.
Thrasher, I. M., Mauz, B., Chiverrell, R. C. & Lang, A. 2009: Lumi-nescence dating of glaciofluvial deposits: a review.Earth-Science Reviews 97, 145–158.
Wallinga, J., Bos, A. J. J., Dorenbos, P., Murray, A. S. & Schokker, J. 2007: A test case for anomalous fading correction in IRSL dating.Quaternary Geochronology 2, 216–221.
Wallinga, J., Murray, A. & Wintle, A. 2000: The single-aliquot regenerative-dose (SAR) protocol applied to coarse-grain feldspar. Radiation Measurements 32, 529–533.
Wintle, A. G. 1973: Anomalous fading of thermoluminescence in mineral samples.Nature 245, 143–144.