The relation between variation in size of the
primordial follicle pool and age at natural
menopause
M. Depmann1, M.J. Faddy2, Y.T. van der Schouw3, P.H.M. Peeters3, S.L. Broer1, T.W. Kelsey4, S.M. Nelson5, F.J.M. Broekmans1
1Department of Reproductive Medicine & Gynecology, University Medical Center Utrecht,
Heidelberglaan 100, 3584 CX, Utrecht, The Netherlands;2School of Mathematical Sciences,
Queensland University of Technology, Brisbane, Australia;3Julius Center for Health Sciences and Primary Care, University Medical Center Utrecht, Universiteitsweg 100, 3584 CG, Utrecht, The Netherlands;4 School of Computer Science, University of St. Andrews, Scotland, United Kingdom;5School of Medicine, University of Glasgow, Glasgow Scotland, United KingdomKey terms:non-growing follicles, menopause, prediction, AMH, AFC
Context:Menopause has been hypothesized to occur when the non-growing follicle (NGF) number
falls below a critical threshold. Age at natural menopause (ANM) can be predicted using NGF numbers and this threshold. These predictions support the use of ovarian reserve tests, reflective of the ovarian follicle pool, in menopause forecasting.
Objective: To investigate the hypothesis that age-specific NGF numbers reflect age at natural
menopause.
Design and Setting: Histologically derived NGF numbers obtained from published literature
(n⫽218) and distribution of menopausal ages derived from the population based Prospect-EPIC
cohort (n⫽4037) were combined.
Participants:NGF data were from single ovaries that had been obtained post-natally for various
reasons, such as elective surgery or autopsy. From the Prospect-EPIC cohort, women aged 58 years and older with a known ANM were selected.
Interventions:None
Main Outcome Measure(s):Conformity between observed age at menopause in the Prospect-EPIC
cohort and NGF-predicted age at menopause from a model for age-related NGF decline con-structed using a robust regression analysis. A critical threshold for NGF number was estimated by comparing the probability distribution of age at which NGF numbers fall below this threshold with the observed distribution of ANM from the Prospect-EPIC cohort.
Results:The distributions of observed age at natural menopause and predicted age at natural
menopause showed close conformity.
Conclusion:The close conformity observed between NGF-predicted and actual age at natural
menopause supports the hypothesis that that the size of the primordial follicle pool is an important determinant for the length of the individual ovarian lifespan and supports the concept of meno-pause prediction using ovarian reserve tests, such as anti-Müllerian hormone and antral follicle count, as derivatives of the true ovarian reserve.
ISSN Print 0021-972X ISSN Online 1945-7197 Printed in U.S.A.
Copyright © 2015 by the Endocrine Society Received February 2, 2015. Accepted April 20, 2015.
Abbreviations:
F
rom conception to menopause, a dynamic decline in the primordial follicle pool occurs within the human ovary. It is postulated that the final menstrual period co-incides with a decline of the follicle pool below a critical threshold (1– 4). At this threshold the ovary becomes in-sufficient for maintaining the production of mature oocytes within the framework of a menstrual cycle and menopause, defined as the cessation of menstrual cycles, occurs. Various models have been designed to determine the rate of decline of the follicle pool with advancing age, as well as to quantify the critical threshold for cycle ces-sation, however no consensus has been reached thus far (1– 4).In recent years research focused on providing methods for individualized predictions of the age at natural meno-pause (ANM) (5–7). It has been postulated that these pre-dictions could be extended to predict the end of natural fertility (8 –10) and be used to identify women at greater risk of cardiovascular and neurological disease (11, 12), osteoporosis (13), or breast and intestinal cancer (14) due to either early or late menopause.
Individual predictions of ANM have been based on markers indirectly reflecting the size of the primordial fol-licle pool such as anti-Müllerian hormone (AMH) (6, 7, 15–17). However, model imprecision limits their clinical utility at the current time. The biological basis for these prediction models is the assumption that the size of the primordial follicle pool present at birth or later on in life is the determining factor in age at menopause, and that ovarian reserve tests may accurately capture this pool size at any age (18). The association between the primordial follicle pool number and age at natural menopause has not been examined in detail, and follow up studies will remain elusive.
The aim of this current paper is therefore to investigate the hypothesis that the size of the primordial follicle pool is the main determinant for the length of the individual ovarian lifespan. This is done by modeling the decline in numbers of follicles with increasing age. A model for age at menopause is then based on the number of primordial follicles declining below a critical threshold for cycle ces-sation. The distribution of predicted age at menopause from this modeling is compared with observed data on age at menopause. Demonstrating a clear link between the ‘true’ ovarian reserve and age at natural menopause could then provide some rationale for the use of ovarian reserve tests in clinical practice.
Materials and Methods
Subjects
Two databases were used to investigate the above formulated aim. For the purpose of creating predictions of age at menopause
based on primordial follicle numbers, the nongrowing follicle (NGF) database, as considered by Wallace et al (19), was used to estimate a model for the age dependent decline in the number of primordial follicles. In this database the histologically derived number of NGFs in human ovaries of eight different cohorts (1, 4, 20 –25) were combined to form one large database. From this database, a selection of cases was made for use in the present analysis.
First, a selection was made based upon age at specimen col-lection, with only data from ovaries obtained postnatally being used. Furthermore, in cases where a single person provided two ovaries, the mean number of NGFs from the both ovaries was used in order to prevent overrepresentation of these cases. This was in accord with results of Hansen et al (4), were no significant difference was apparent in the number of NGFs between left and right ovaries collected from a single person. Considering the fact that it is not practically possible to determine the amount of time an ovary has been void of follicles, providing an age at the time the ovary reached a NGF count of zero is not possible. Further-more, it is not possible to determine that an ovary is actually devoid of follicles. For these reasons, it was decided to exclude zero counts rather than make arbitrary adjustments to these and other low counts as was done with the data used by Wallace et al (19). After applying these criteria, 218 cases provided NGF counts from the equivalent of a single ovary, with the original low counts being used without any adjustment.
The second database, providing the observed distribution of ages at natural menopause, is the Prospect-European Prospective Investigation into Cancer and Nutrition (Prospect-EPIC) data-base. A total of 17 357 women, aged 50 to 70 years, were re-cruited between 1993–1997 from a nationwide breast cancer screening program in the Netherlands (26, 27). Via extensive questionnaires menopausal status as well as reproductive health was assessed. Menopause was defined according to the World Health Organization definition: the absence of spontaneous menstrual bleeding for more than 12 months. For the current study, a cross-sectional sample of women aged over 58 years at study recruitment with a recorded natural menopause was se-lected in order to prevent overrepresentation of women who reach menopause at an early age. Including only women of age over 58 years will ascertain that the full normal range of meno-pausal ages has been recorded. Furthermore, exclusion criteria were the use of medication interfering with menstrual cycles, ovarian abnormalities or surgery, and surgery on the uterus pro-hibiting menstrual cycles. Applying the above mentioned selec-tion criteria reduced the total of available participants to 4037.
Analyses
Under the hypothesis that menopause occurs when the num-ber of NGFs falls below a critical threshold, this regression based model for NGF decline enabled the construction of a probability distribution for age at menopause for a given threshold to be derived from the following relationship:
Probability that NGF count at ageyis below threshold⫽ probability that menopause has occurred before agey.
For this derivation of a distribution of ages at menopause, the residual standard deviation in the regression model (for NGFs) was adjusted to allow for the possibility of excess variation in NGF counts compared with variation in menopausal ages, as was necessary in the previous modeling of AMH and menopause (29).
This gives linked models for both age at menopause and de-clining NGF count with increasing age. Maximum likelihood estimation was then used with the Prospect-EPIC menopausal age data and the NGF count data to estimate all model param-eters, including the critical threshold NGF number.
Finally, individual prediction of age at menopause could be made from a nomogram of age specific NGF percentile bands constructed from the estimated NGF regression model (ie, a very low age specific NGF count would place a woman below the fifth percentile, whereas a high age specific NGF count would place her in a higher percentile band). Prediction of age at menopause then follows from the corresponding percentiles of the estimated distribution of menopausal ages.
All calculations were done using MATLAB® numerical
software.
Results
As described, the selection criteria reduced the size of the NGF database from 325 cases to 218, and the size of the Prospect-EPIC cohort from 17 357 to 4037 women. De-tails of all the studies in the original NGF database, and the number of remaining specimens in the adjusted NGF data after applying our selection criteria are depicted in Table 1.
The follicle counts in the NGF data ranged between 9 and 402 018 per ovary. The age range of subjects at the time of obtaining the ovary specimens was 0 to 51 years, with more details given in Supplemental Table 1. The mean age at menopause in the Prospect-EPIC data was
50.2 years (AD 4.2 years), mean age at inclusion was 63.05 years (SD 3.4 years).
Textbox 1 shows all parameter estimates from the model fitting. Figure 1 demonstrates the fit of the qua-dratic regression model of log(NGF count) on age to the NGF count data, showing the reducing mean and increas-ing residual standard deviation with increasincreas-ing age. The mean function of age from the earlier NGF analysis (19) is shown for comparison. The two mean functions are sim-ilar for ages up to 45 years (with the Wallace et al (19) mean within 95% confidence limits of the quadratic re-gression), but diverge somewhat after that age due to the different treatment of low counts in the data (R2values
0.72 from the current analysis and 0.70 from the 2010 analysis).There was significant left-skewness in the distri-bution of the residual variation from the regression of log(NGF count) on age (p-value⬍0.001), suggesting that these residuals were not normally distributed (ie, more observations above the estimated mean than below it). The negative quadratic component of the regression was significant (p-value ⬍ 0.001), corresponding to acceler-ated decline in later years. There was also a significant (p-value⬍0.001) increase in the residual standard devi-ation of log(NGF count) with increasing age. This shows that the logarithmic transformation had overcompensated for the heterogeneous variation in the untransformed NGF data (demonstrated in Figure 1 by the gradual broad-ening of the 90% probability range with increasing age). The estimate of the value of the critical threshold of num-ber of nongrowing follicles from a single ovary for the occurrence of menopause was 498 NGFs.
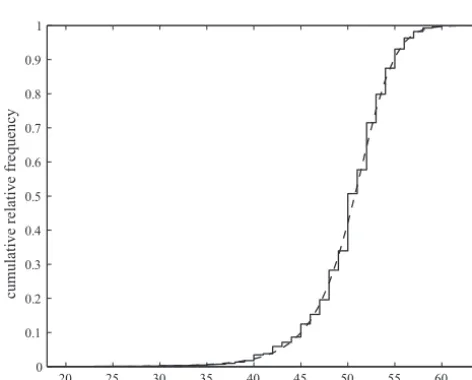
[image:3.594.50.551.650.743.2]Figure 2 shows the fit of the derived distribution of menopausal ages, predicted by the number of nongrowing follicles falling below this critical threshold, compared with the observed menopausal ages in the Prospect-EPIC data. Good agreement was observed between observed and predicted ages at menopause. There was significantly less variation (p-value⬍0.001) needed to explain the vari-ation in menopausal ages than that apparent from the
Table 1. Outline of case selection from the NGF database; # specimens NGF 2010 is the number of specimens included in the original database; # specimens NGF 2015 is the equivalent number of single ovaries of casesⱖ16 yr included in the current analyses. (†original data referred to more specimens than those used in the 2010 database.)
Author Year # specimensNGF 2010 Age at NGF count Origin of specimens NGF counting method # specimensNGF 2015 Reason for exclusion of NGF 2015
Block 1952 86 6 – 44 yr Accidental death, suicide, acute illness/ infection Model based 43 Presence of two ovaries per woman
Block 1953 19 fetal Abortion Model based 0 Fetal specimens
Baker 1963 11 fetal Spontaneous abortion, unknown Beaumont & Mandl 0 Fetal specimens
Richardson 1987 9† 45–51 yr Elective surgery Model based 13 Postmenopausal women
Gougeon 1987 52 19 –50 yr Surgery for various conditions Linthern- Moore 43 Presence of two ovaries per woman
Bendsen 2006 11 fetal abortion Bouin 0 Fetal specimens
Forabosco 2007 15 fetal- 1 yr Abortion, maternal disease Cavalleiri 1 Fetal specimens
Hansen 2008 122 0 –51 yr Oophorectomy or donor specimens fractionator/ optical dissector 118 Fetal specimens and NGF counts of zero
regression analysis of log(NGF count) on age, with the residual standard deviation from the regression analysis reduced by an estimated factor of 0.70.
Figure 3 shows a nomogram in which the fifth, 10th, 25th, 50th, 75th, 90th and 95th age-specific percentiles of NGF counts are depicted. The estimated critical threshold in NGFs at which menopause occurs is also indicated in this figure (498 follicles, see Textbox 1). Furthermore, the corresponding percentiles of the distribution of age at menopause derived from the NGF count are shown adja-cent to the NGF peradja-centiles.
Discussion
In this study we have demonstrated that the predicted age at menopause based on the decline of the primordial fol-licle pool shows close conformity with the observed age at menopause. This close conformity supports the hypothe-sis that the size of the primordial follicle pool is an im-portant determinant for the length of the individual ovar-ian lifespan. These results strengthen the current interest in the prediction of age at menopause using markers reflect-ing the ovarian pool of primordial follicles such as AMH or AFC.
This study is the first to assess the relation between predicted age at menopause based on the nongrowing fol-licle pool and the observed age at menopause. Wallace et al (19) did model NGF decline in relation to age using the original NGF dataset. A NGF threshold of 1000 follicles was used for the occurrence of menopause assuming a mean age at menopause of 51 years. The threshold of 498 NGFs present in a single ovary estimated in the current analysis is significantly lower (p-value⬍0.001) than the threshold of 1000 follicles used in this previous publica-tion. The difference here most likely stems from our sharp-ened inclusion criteria for the ovarian specimens in cases providing low NGF counts or NGF counts of zero, which were set at an artificial minimum higher than the estimated NGF count in the data used by Wallace et al (19). In the
0 10 20 30 40 50
101 102 103 104 105 106
age (years)
[image:4.594.298.529.429.612.2]NGF count
Figure 1. NGF counts (circles) from the 2015 data and (dots) from the
2010 data. The quadratic regression (solid line) fitted to the 2015 data with 95% confidence intervals (dotted lines) and 90% prediction intervals (dash-dotted lines). The Wallace-Kelsey model as fitted to the 2010 data is also depicted (dashed line).
20 25 30 35 40 45 50 55 60 0
0.1 0.2 0.3 0.4 0.5 0.6 0.7 0.8 0.9 1
age (years)
cumulative relative frequency
Figure 2. Observed distribution of menopausal ages from the
Prospect-EPIC data (solid line, N⫽4037) compared with the distribution (dashed line, N⫽218) derived from NGF count falling below a critical threshold, where close agreement is apparent.
15 20 25 30 35 40 45 50 55 102
103 104 105
age (years)
NGF count
42.7y 45.0y
48.1y 50.7y
53.0y 5456.0y.9y
threshold
Figure 3. Nomogram showing 5% & 95% (dotted lines), 10% &
[image:4.594.39.275.512.702.2]current analysis, NGF counts of 0 were excluded but low NGF counts were kept at their original numbers. This resulted in the inclusion of a subset of lower NGF counts, thereby pulling down the mean NGF count. This in turn resulted in a lower estimate of the NGF threshold at which menopause is expected to occur. The effect of the inclusion of lower NGF counts is demonstrated in Figure 1 were the mean function of age is depicted for both the current model and the 2010 model (19). As depicted, the two mean functions are similar up to 45 years of age. However after this age the lines diverge due to the lower NGF count pulling down the mean in the current analysis. We feel that by including NGF counts at their original number, the threshold as currently calculated more accurately repre-sents the “true threshold”.
In order to get good agreement between the observed and predicted ages at menopause (as depicted in Figure 2), the residual standard deviation from the regression model of log(NGF count) had to be reduced by a factor of 0.70 when constructing the NGF predictive distribution of age at menopause. This excess variation in NGF could be due to differences in NGF counting methods. Block et al (20) counted nongrowing follicles in one slice of ovarian tissue per 200 slices with a slice thickness of 20 – 40m. Rich-ardson et al (1) counted one slice per 100 with a slice thickness of 10m whereas Gougeon et al (23) counted an unknown number of slices with a thickness of 10 m. Forabosco et al (25) consecutively sliced each ovary in one 1-m thick and 10 100-m thick slices and counted every 1 m thick slice, lastly, Hansen et al (4) sliced the total ovary into slabs of 1 mm, selected 8 of these slabs to slice them further into slices of 25m thickness and eventually counted follicles in one in every 10 of these slices. Another potential source of variation in NGF number is the dif-ference in counting accuracy that could have originated from technical developments. In the first papers included in the NGF data (1, 20, 23) manual counting methods were used, whereas in the papers by Forabosco et al (25) and Hansen et al (4) an automatic counting method was applied. However, since the first paper in the NGF data-base was published in 1951 and the most recent in 2008, the occurrence of some variation in counting methods is almost inevitable.
The effect of excess residual variation in NGF counts on prediction of menopausal ages can be incorporated in the modeling by having a variable critical threshold at which menopause occurs that is positively correlated with NGF counts. This would result in a higher critical threshold for women with high NGF counts and a lower threshold for women with low NGF counts. This is indicated in Figure 3 by an interquartile range for this variation which
addi-tional calculations suggest could be as much as 175 - 1357 nongrowing follicles.
A possible limitation of this study is the fact that data from two different datasets were combined in order to estimate the level of agreement between the observed and predicted ages at menopause. The Prospect-EPIC study is a population-based sample of healthy women, and is likely to represent the distribution of age at menopause of a Caucasian population. Unfortunately, no baseline char-acteristics are available for the NGF dataset, hence limit-ing the possibility of checklimit-ing the comparability of the two datasets. Virtually all the ovarian specimens, although macroscopically described as normal, were derived post mortem or during gynecological surgery. As for the cases in the post mortem group, causes for demise may be con-sidered as not affecting ovarian reserve. However, the group from which ovaries were obtained due to gyneco-logical conditions, may introduce some bias.
To investigate if reasons for ovarian removal affected the model estimates, a sensitivity analysis was performed with the specimens categorized as being obtained from postmortem cases (n⫽88) when death had occurred “sud-denly” (for instance in a motor vehicle accident), from women providing specimens after gynecological surgery (n⫽129) or for “other” reasons (n⫽1). This sensitivity analysis was done by deleting subsets of data categorized according to reason for ovarian removal from the full da-taset and then redoing of the parameter estimation (note that afterwards, the deleted data were replaced before de-letion of the next subset of data). The variation between the different estimates so obtained was assessed and found to be a little more than might be expected from random deletions (Supplemental figure 1). There is some con-founding here in that the second (postsurgery) category contained a preponderance of older ages, while a prepon-derance of younger ages was apparent in the first (post mortem) category, which would contribute to some of these differences. A good level of qualitative similarity was apparent among the different estimates. Menopausal threshold estimates were comparable, as was the signifi-cant left-skewness in the distribution of (log) NGF resid-uals. Also, the increasing standard deviation of these re-siduals with increasing age was consistently apparent, as was the observation that there was more variation in NGF counts than necessary to describe variation in menopausal ages. This sensitivity analysis suggests that the NGF data are sufficiently homogenous without any obvious biases to justify the linking of these data with the Prospect-EPIC data.
the life year in which menopause occurred had been a long time ago. However, a sufficient validity and reproducibil-ity of estimating age at menopause based on these ques-tionnaires has been reported in several studies (30, 31). In one study comparing age at menopause derived from re-peated questionnaires with a 7–9 year interval, the agree-ment between initial and delayed recordings was shown to be high (31).
The strength of the current study is the fact that the model provides some unique evidence regarding the pre-diction of age at menopause from what is generally con-sidered to be the true ovarian reserve.
Due to the inherent necessity to remove an ovary to quantify the primordial follicle pool, it is not feasible to assess, in vivo, the relationship between the true ovarian reserve and natural age at menopause. Hence, models have been designed to predict age at natural menopause using derivatives of this true ovarian reserve such as AMH or the AFC, or proxy variables such as oocyte yield after ovarian stimulation for IVF. (5, 6, 15–17, 29, 32–37) Yet no re-search has been designed to investigate the assumption made in these models that the size of the ovarian follicle pool is indeed the determining factor in the occurrence of menopause.
We do not see clinical utility for the NGF threshold/ nomogram in the prediction of menopause. With the re-sults of the present study, demonstrating the link between the size of the follicle pool and age at menopause, we have provided some further rationale for the use of derivatives of the true ovarian reserve in menopause prediction. Pre-dictions that can potentially be used in the identification of women at risk of early menopause.
Conclusion
This study has shown that the age dependent decline in the number of nongrowing follicles can be used to construct a distribution of age at natural menopause, which is close to the observed distribution. This supports the hypothesis that the size of the ovarian follicle pool is an indicator for age at menopause. It thereby provides support for the con-cept of prediction of age at menopause using markers re-flective of the true ovarian reserve, such as AMH or the AFC.
Acknowledgments
Address all correspondence and requests for reprints to: Corre-sponding author and person to whom requests should be ad-dressed: M. Depmann, MD, Department of Reproductive Med-icine, Gynecology, University Medical Center Utrecht,
Heidelberglaan 100, 3584 CX, Utrecht, The Netherlands, Phone:⫹31– 88755–5890, E-mail: m.depmann@gmail.com.
This work was supported by .
Disclosure statement:MD, MJF, YTvdS, PHM, SLB, and
TWKhave nothing to disclose; SMN is a member of the external advisory board for MSD, Merck Serono, Ferring Pharmaceuti-cals and Roche Diagnostics and is in receipt of a research grant from Roche Diagnostics.; FJMB receives monetary compensa-tion: member of the external advisory board for Merck Serono, The Netherlands; consultancy work for Gedeon Richter, Bel-gium; educational activities for Ferring BV, The Netherlands; strategic cooperation with Roche on automated AMH assay development
References
1. Richardson SJ, Senikas V, Nelson JF.Follicular depletion during the menopausal transition: Evidence for accelerated loss and ultimate exhaustion.J Clin Endocrinol Metab. 1987;65(6):1231–1237. 2. Faddy MJ, Gosden RG, Gougeon A, Richardson SJ, Nelson JF.
Ac-celerated disappearance of ovarian follicles in mid-life: Implications for forecasting menopause.Hum Reprod. 1992;7(10):1342–1346. 3. Wallace WH, Kelsey TW.Ovarian reserve and reproductive age may be determined from measurement of ovarian volume by transvaginal sonography.Hum Reprod. 2004;19(7):1612–1617.
4. Hansen KR, Knowlton NS, Thyer AC, Charleston JS, Soules MR, Klein NA.A new model of reproductive aging: The decline in ovarian non-growing follicle number from birth to menopause.Hum Re-prod. 2008;23(3):699 –708.
5. Tehrani FR, Solaymani-Dodaran M, Azizi F.A single test of an-timullerian hormone in late reproductive-aged women is a good predictor of menopause.Menopause. 2009;16(4):797– 802. 6. Broer SL, Eijkemans MJ, Scheffer GJ, van Rooij IA, de Vet A,
Them-men AP, Laven JS, de Jong FH, Te Velde ER, Fauser BC, Broekmans FJ.Anti-mullerian hormone predicts menopause: A long-term fol-low-up study in normoovulatory women.J Clin Endocrinol Metab. 2011;96(8):2532–2539.
7. Tehrani FR, Solaymani-Dodaran M, Tohidi M, Gohari MR, Azizi F.Modeling age at menopause using serum concentration of anti-mullerian hormone. J Clin Endocrinol Metab. 2013;98(2):729 – 735.
8. Wood JW.Fecundity and natural fertility in humans.Oxf Rev Re-prod Biol. 1989;11:61–109.
9. Eijkemans M, Habbema J, te Velde E.Age at last childbirth and fertility at young age. In: Eijkemans MJ, Academic Thesis; Fertility in populations and in patients. 2004;23.
10. Nelson SM, Telfer EE, Anderson RA.The ageing ovary and uterus: New biological insights.Hum Reprod Update. 2013;19(1):67– 83. 11. Shuster LT, Rhodes DJ, Gostout BS, Grossardt BR, Rocca WA.
Premature menopause or early menopause: Long-term health con-sequences.Maturitas. 2010;65(2):161–166.
12. Rocca WA, Shuster LT, Grossardt BR, Maraganore DM, Gostout BS, Geda YE, Melton LJ,3rd.Long-term effects of bilateral oopho-rectomy on brain aging: Unanswered questions from the mayo clinic cohort study of oophorectomy and aging. Womens Health (Lond Engl) 2009;5(1):39 – 48.
13. Gallagher JC.Effect of early menopause on bone mineral density and fractures.Menopause2007;14(3 Pt 2):567–571.
14. Hartge P.Genetics of reproductive lifespan.Nat Genet. 2009;41(6): 637– 638.
15. Sowers MR, McConnell D, Yosef M, Jannausch ML, Harlow SD, Randolph JF, Jr.Relating smoking, obesity, insulin resistance, and ovarian biomarker changes to the final menstrual period.Ann N Y Acad Sci2010;1204:95–103.
age at menopause from serum antimullerian hormone concentra-tion.Menopause. 2011;18(7):766 –770.
17. Dolleman M, Depmann M, Eijkemans MJ, Heimensem J, Broer SL, van der Stroom EM, Laven JS, Van Rooij IA, Scheffer GJ, Peeters PH, van der Schouw YT, Lambalk CB, Broekmans FJ. Anti-mulle-rian hormone is a more accurate predictor of individual time to menopause than mother’s age at menopause.Hum Reprod. 2014; 29(3):584 –591.
18. Hansen KR, Hodnett GM, Knowlton N, Craig LB.Correlation of ovarian reserve tests with histologically determined primordial fol-licle number.Fertil Steril. 2011;95(1):170 –175.
19. Wallace WH, Kelsey TW.Human ovarian reserve from conception to the menopause.PLoS One. 2010;5(1):e8772.
20. BLOCK E.Quantitative morphological investigations of the follic-ular system in women; variations at different ages.Acta Anat (Basel)
1952;14(1–2):108 –123.
21. BLOCK E.A quantitative morphological investigation of the fol-licular system in newborn female infants.Acta Anat (Basel)1953; 17(3):201–206.
22. BAKER TG.A quantitative and cytological study of germ cells in human ovaries.Proc R Soc Lond B Biol Sci1963;158:417– 433. 23. Gougeon A, Chainy GB.Morphometric studies of small follicles in
ovaries of women at different ages.J Reprod Fertil. 1987;81(2): 433– 442.
24. Bendsen E, Byskov AG, Andersen CY, Westergaard LG.Number of germ cells and somatic cells in human fetal ovaries during the first weeks after sex differentiation.Hum Reprod. 2006;21(1):30 –35. 25. Forabosco A, Sforza C.Establishment of ovarian reserve: A
quan-titative morphometric study of the developing human ovary.Fertil Steril. 2007;88(3):675– 683.
26. Boker LK, van Noord PA, van der Schouw YT, Koot NV, Bueno de Mesquita HB, Riboli E, Grobbee DE, Peeters PH.Prospect-EPIC utrecht: Study design and characteristics of the cohort population. european prospective investigation into cancer and nutrition.Eur J Epidemiol. 2001;17(11):1047–1053.
27. Riboli E, Hunt KJ, Slimani N, Ferrari P, Norat T, Fahey M, Char-rondiere UR, Hemon B, Casagrande C, Vignat J, Overvad K, Tjon-neland A, Clavel-Chapelon F, Thiebaut A, Wahrendorf J, Boeing H, Trichopoulos D, Trichopoulou A, Vineis P, Palli D, Bueno-De-Mes-quita HB, Peeters PH, Lund E, Engeset D, Gonzalez CA, Barricarte A, Berglund G, Hallmans G, Day NE, Key TJ, Kaaks R, Saracci R.
European prospective investigation into cancer and nutrition (EP-IC): Study populations and data collection.Public Health Nutr
2002;5(6B):1113–1124.
28. Jones MC, Faddy MJ.A skew extension of the t-distribution, with applications.Journal of the Royal Statistical Society: Series B (Sta-tistical Methodology). 2003;65(1):159 –174.
29. Dolleman M, Faddy MJ, van Disseldorp J, van der Schouw YT, Messow CM, Leader B, Peeters PH, McConnachie A, Nelson SM, Broekmans FJ.The relationship between anti-mullerian hormone in women receiving fertility assessments and age at menopause in sub-fertile women: Evidence from large population studies.J Clin En-docrinol Metab. 2013;98(5):1946 –1953.
30. Colditz GA, Stampfer MJ, Willett WC, Stason WB, Rosner B, Hen-nekens CH, Speizer FE.Reproducibility and validity of self-reported menopausal status in a prospective cohort study.Am J Epidemiol. 1987;126(2):319 –325.
31. den Tonkelaar I.Validity and reproducibility of self-reported age at menopause in women participating in the DOM-project.Maturitas. 1997;27(2):117–123.
32. Broekmans FJ, Faddy MJ, Scheffer G, te Velde ER.Antral follicle counts are related to age at natural fertility loss and age at meno-pause.Menopause2004;11(6 Pt 1):607– 614.
33. van Disseldorp J, Faddy MJ, Themmen AP, de Jong FH, Peeters PH, van der Schouw YT, Broekmans FJ.Relationship of serum antimul-lerian hormone concentration to age at menopause.J Clin Endo-crinol Metab. 2008;93(6):2129 –2134.
34. Freeman EW, Sammel MD, Lin H, Gracia CR.Anti-mullerian hor-mone as a predictor of time to menopause in late reproductive age women.J Clin Endocrinol Metab. 2012;97(5):1673–1680. 35. Freeman EW, Sammel MD, Lin H, Boorman DW, Gracia CR.
Con-tribution of the rate of change of antimullerian hormone in estimat-ing time to menopause for late reproductive-age women.Fertil Steril
2012;98(5):1254 –9.e1–2.
36. La Marca A, Sighinolfi G, Papaleo E, Cagnacci A, Volpe A, Faddy MJ.Prediction of age at menopause from assessment of ovarian reserve may be improved by using body mass index and smoking status.PLoS One. 2013;8(3):e57005.