S
c
h
o
o
l
o
f
E
c
o
n
o
m
ic
s
&
F
in
a
n
c
e
D
is
c
u
s
s
io
n
P
a
p
e
r
s
School of Economics & Finance Discussion Paper Series issn 0962-4031
http://ideas.repec.org/s/san/wpecon.html
The Technological Specialization of
Countries: An Analysis of Patent
Data
Lucio Picci and Luca Savorelli
School of Economics and Finance Discussion Paper No. 1301 7 Jan 2013
JEL Classification: O31; O34.
The Technological Specialization of Countries: An Analysis of Patent Data
Lucio Picci and Luca Savorelli1
4 July 2013
Abstract
New methods of analysis of patent statistics allow assessing country profiles of technological specialization for the period 1990-2006. We witness a modest decrease in levels of specialization, which we show to be negatively influenced by country size and degree of internationalization of inventive activities.
JEL classification: O31; O34.
Keywords: Patents; Internationalization; Specialization; Technological Sectors.
1
1. Introduction
Several studies in the past have documented a rise in technological specialization of countries. In particular, Archibugi and Pianta (1992) found that technological specialization increased over the period 1975-1988, and tended to be higher in smaller countries. Cantwell and Vertova (2004) reached similar conclusions, showing that country-level technological specialization is more pronounced in the years between 1965 and 1990 when compared to that observed in previous periods. In this paper, we update this debate for the post-1990 years, considering a broader set of countries and overall employing improved methodologies, and we test the effects of country size and internationalization of R&D on technological specialization. Using patent data, we first assess country profiles of technological specialization. We identify inventions with patent applications, corresponding to filings to all patent offices in the world of at least marginal significance (De Rassenfosse et al., 2013) as reported in the Patstat database (European Patent Office, 2013a and 2013b). In this way, although acknowledging the usual caveats that pertain to the use of patent data, we obtain a comprehensive view on the production of inventions at the world level. Adopting these new methods of analysis effectively overcomes the shortcomings of previous works. Former research approaches focused only on one (albeit important) patent office, such as the USPTO. As such, these studies were affected by a home-bias effect that resulted in a serious sample selection-bias (see for example Cantwell and Vertova, 2004, who are able to consider only eight, mostly large countries).
In the period 1990-2006, we find a modest decrease in the technological specialization of countries, indicating a trend reversal with respect to the findings of other studies analysing previous decades. We take into consideration two broad determinants of specialization. The first pertains to country size. Larger countries have access to a wider pool of resources and a larger domestic market. Therefore, larger nations are expected to be less specialized than smaller nations. Our results confirm this presumption and the findings by Archibugi and Pianta (1992) and Cantwell and Vertova (2004).
specialization. Contrarily, we find that internationalization has a significantnegativeeffect on specialization. In the concluding sections, we propose an explanation for this seemingly counter intuitive result. However, as a practical consequence, this paper indicates that further theoretical work is needed to better understand the determinants of country technological specialization.
2. The data
Patent statistics computations are based on the methodology illustrated in De Rassenfosse et al. (2013), while for the computations of measures of internationalization we adopt one of the metrics introduced by Picci (2010).2 We use the Patstat database (European Patent Office, 2013a and 2013b) and we consider all priority applications filed at any of a group of 50 patent offices from 1990 to 2006 for 34 countries, representing the virtual totality of worldwide patenting activity.3 Our analyses thus include 10,222,306 priority applications. As a note, the term patent applications will be henceforth simplified topatents.
Patents can be fractionally assigned to countries either according to the nationality of the inventor(s) (“inventor criterion”) or of the applicant(s) (“applicant criterion”). In this paper we use the inventor criterion and we define a patent as “national” if all of its inventors and applicants are from the same country, and as “international” otherwise.4 Picci (2010) analyses a sample of 1000 such “international” patents to find that in 79% of cases the applicant is a MNE’s subsidiary or headquarters, with an additional 15% of cases involving firms that are not multinationals.5Patent data allow us to distinguish technologies according to the WIPO’s International Patent Classification (WIPO, 2013). Throughout this study, we adopt the taxonomy proposed by Schmoch (2008), who identifies 35 technologies. We regroup them
2
The methodology (De Rassenfosse et al., 2013) takes full advantage of the fact that Patstat allows to track multiple applications in different patent offices claiming the right to priority for the same invention, and to avoid double counting within patent families. Considering patent applications, instead of granted patents, allows for the analysis of more recent data (since the granting process may take several years). In what follows, whenever for simplicity we mention patents, in fact we always mean patent applications.
3
The 34 countries are: 30 OECD countries (excluding Czech Republic, Estonia, Iceland, and Slovenia); two countries invited to open discussions for membership to the OECD: China, India; Chile and Taiwan. The 50 patent offices that we consider are the national patent offices of the same countries, plus those of Brazil, Bulgaria, Cyprus, Czech Republic, Estonia, Honk Kong, Iceland, Indonesia, Latvia, Lithuania, Malta, Romania, Russia, Singapore, Slovenia, South Africa and the European Patent Office.
4
Note that we use the term “international” (patent application) purely out of convenience, and with no reference to where the first filing occurred – nationally, to a regional office such as the European Patent Office, or via the so called “international route”.
5
into five macro-technologies, which we index as s=1,2…5: electrical engineering (1), instruments (2), chemistry (3), mechanical engineering (4), and other fields (5).6
3. The empirical model
In this section we first introduce measures of country size, technological concentration, and internationalization, before finally presenting our empirical strategy. We identify country size with so called “inventory size”, Invit, representing the total fractional counting of patent
applications of country i in year t, using the inventor criterion. The year subscript is henceforth omitted for the sake of simplicity.
Country technological specialization is measured by means of the same index employed in Cantwell and Vertova (2004):
i TRCA i TRCA i σ μ =
Spec , (1)
where μTRCA and σTRCA are, respectively, the mean and the standard deviation of the index of Technological Revealed Comparative Advantage (hence, TRCA), introduced by Soete (1987).7 Spec is therefore the inverse of the coefficient of variation of TRCA and is dimensionless. Higher (lower) values of Spec represent lower (higher) technological specialization. Intuitively, Spec = 1 if the distribution of technological sectors is exponential (since μTRCA=σTRCA).
We measure internationalization through the InvAppInv measure (which we call Iai), introduced in Picci (2010). It is a relative measure expressing the share of international patents in a country’s portfolio:
, Inv InvApp = Iai i ij i (2) 6
These computations also are done fractionally, such that patents with multiple codes belonging to more than one macro-technology are counted appropriately. See Appendix A for a detailed description of the constituent technologies in terms of the IPC classification, and how they are aggregated to form the five macro-technologies.
7
TRCAsirepresents a country’s worldwide patenting share in one sector relative to its world share of patenting
activity:
s si s i si i si si si Inv Inv Inv Inv = TRCA / / ,
whereInvsiis the fractional count of patents in sectors=1, …,5in countryiaccording to the inventor criterion.
TRCAsiis greater than 1 if countryiis relatively specialized in sectors, and below 1 otherwise. For previous
whereInviis the total fractional counting for countryiusing the inventor criterion;InvAppij
is a fully fractional count of patent applications involving inventors of country i and applicants of countryj, in a given year.
Using the indices (1) – (3), we adopt a very simple baseline empirical model:
it t it
it
it = Log Inv Iai Year
Spec 12 ( )3 , (3)
whereYeartare time (year) fixed effects and εit is the error term. The log transformation
for the inventory size variable is justified in Hart (1991). The empirical model is aimed at identifying the parameters of interest by exploiting cross-sectional variations of the data; this explains the absence of country fixed effects. The presence of such effects would result in a “within” fixed-effect estimator, which would solely reflect the variation of the data in the time series dimension. However, we will also adapt the model so as to consider such “within” variations, using a dynamic model.
Reverse causality may be present. With respect to a country’s size, Koren and Tenreyro (2013) posit that more technologically diversified economies are able to better absorb shocks, and thus technological specialization may hinder growth and eventually result in smaller inventory size. In regard to internationalization, greater specialization might in turn attract further R&D activities by MNEs, consequently increasing the level of internationalization. For these reasons, we also use two-stage least squares, employing the lags of the two main dependent variables as instruments. We also consider “within” variation. First, we estimate long-difference variations on a cross-section of data. In addition, we also adopt a dynamic panel-data model, utilizing both a standard OLS Fixed Effects estimator and Arellano and Bond (1991) one-step estimator.
4.Results
Table 1 shows that technological diversification, as measured by the world average of Spec, has slightly increased across the period under consideration. The same result applies if we focus on an alternative measure of technological specialization, the Krugman (1991) index of technological specialization (see Appendix B), which is highly negatively correlated withSpec.
The last column shows that internationalization has increased since 1990, implying a negative correlation between internationalization and specialization.
[Table 2 about here]
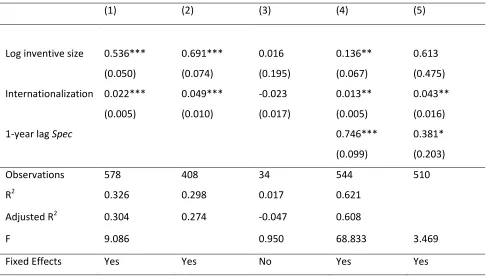
Table 2 shows the results of the estimated empirical models. The dependent variable is always our measure of diversification Spec, with the exception of Column 3, where the dependent variable is the variation of Spec between 1990 and 2006. Column 1 shows OLS estimates. Both country size and the degree of internationalization in the production of technologies have a strong and highly significant positive effect. The results change only marginally when employing an Instrumental Variable estimator (Column 2), where the 5thlags of the two dependent variables are used as instruments8. Both specifications include year fixed effects. In Column 3 the dependent variable is the difference ΔSpec=Speci,2006 Speci,1990. The model enquires whether the values of the two independent variables in the first year of the sample (Invi, 1990 andIaii, 1990) have an effect in explainingchangesin the dependent variable.
The answer is negative for both variables of interest. In Columns 4 and 5 we check whether the effects that we find when looking at the cross-sectional variation of the data (Columns 1 and 2) are also present when we use the aforementioned within variation of the data to identify the parameters of interest. The dynamic nature of the model causes the simple OLS Fixed Effects estimator to be biased, but taking into account the considerations in Attanasio et al. (2000) on dynamic panel data models in instances when T is rather large, we also show those results (Column 4), together with Arellano and Bond (1991) one-step estimates (Column 5).
When using a standard Fixed Effect estimator (Column 4) we find a significant effect for both variables.9Arellano-Bond one-step instrumental variable estimator (Column 5), however, indicates that the effect of country size, while correctly signed, is not significant at conventional levels (p-value = 0.205). Overall, looking at the within variation of the data confirms our results.
8
Changing the order of the lag, from 1 to 10, leaves the results qualitatively unchanged.
9
5.Conclusions and discussion
This paper shows that technological country specialization in recent times did not increase as it had been previously demonstrated in research on the 1970s and 1980s. In fact, specialization slightly decreased during the period under review in this study. Our estimates show that both country size and country internationalization have a negative effect on the degree of country specialization. The former effect is expected. The latter finding is to some extent surprising, since from the theory of comparative advantage we would rather expect a positive association between internationalization and specialization. Identifying the channels through which internationalization influences technological specialization is an open question. A tentative explanation of our results could be along the lines proposed by Caselli et al. (2012); internationalization of R&D might be motivated by strategies to reduce domestic, sector-specific technological shocks by diversifying inventive activities. Additionally, comparative advantage motives may be at work in the opposite direction, i.e., an increase in specialization may lead to a subsequent increase in a country’s exposure to sector-specific shocks. If this holds, the balance between shock-minimization and comparative advantage motives is what determines the observed outcomes.
Appendix A - Taxonomy of technologies (Schmoch, 2008)
Electrical engineering, s=1
1 - Electrical machinery, apparatus, energy: F21#, H01B, H01C, H01F, H01G, H01H, H01J, H01K, H01M, H01R, H01T, H02#, H05B, H05C, H05F, H99Z. 2 - Audio-visual technology:G09F, G09G, G11B, H04N-003, H04N-005, H04N-009, H04N-013, H04N-015, H04N-017, H04R, H04S, H05K. 3 - Telecommunications:G09F, G09G, G11B, H04N3, H04N5, H04N9, H04N13, H04N15, H04N17, H04R, H04S, H05K, H04W, G08C, H01P, H01Q, H04B, H04H, H04J, H04K, H04M, H04N1, H04N7, H04N11, H04Q, H04W.4 - Digital communication : H04L. 5 - Basic communication processes:H03.6 - Computer technology: G06 (but not G06Q), G11C, G10L.7 - IT methods for management:G06Q.8 - Semiconductors:H01L.
Instruments, s=2
9 - Optics:G02, G03B, G03C, G03D, G03F, G03G, G03H, H01S.10 - Measurement:G01B, G01C, G01D, G01F, G01G, G01H, G01J, G01K, G01L, G01M, G01N, G01N33G01P, G01R, G01S, G01V, G01W, G04, G12B, G99Z. 11- Analysis of biological materials: G01N33. 12 - Control: G05B, G05D, G05F, G07, G08B, G08G, G09B, G09C, G09D. 13 - Medical technology: A61B, A61C, A61D, A61F, A61G, A61H, A61J, A61L, A61M, A61N, H05G.
Chemistry, s=3
14 - Organic fine chemistry: C07B, C07C, C07D, C07F, C07H, C07J, C40B, A61K8, A61Q. 15 -Biotechnology: C07G, C07K, C12M, C12N, C12P, C12Q, C12R, C12S. 16 - Pharmaceuticals: A61K, A61K8, A61P (added, not present in WIPO document). 17 - Macromolecular chemistry, polymers: C08B, C08C, C08F, C08G, C08H, C08K, C08L 18 - Food chemistry: A01H, A21D, A23B, A23C, A23D, A23F, A23G, A23J, A23K, A23L, C12C, C12F, C12G, C12H, C12J, C13D, C13F, C13J, C13K. 19 - Basic materials chemistry: A01N, A01P, C05, C06, C09B, C09C, C09F, C09G, C09H, C09K, C09D, C09J, C10B, C10C, C10F, C10G, C10H, C10J, C10K, C10L, C10M, C10N, C11B, C11C, C11D, C99Z.20 - Materials, metallurgy:C01, C03C, C04, C21, C22, B22.21 -Surface technology, coating: B05C, B05D, B32, C23, C25, C30.22 - Micro-structure and nano-technology:B81, B82. 23 - Chemical engineering:B01B, B01D0, B01D1, B01D2, B01D, B01D41, B01D5 (added, not clear in WIPO document), B01D8 (added, not clear in WIPO document), B01D9 (added, not clear in WIPO document), B01D43, B01D57, B01D59, B01D6, B01D7, B01F, B01J, B01L, B02C, B03, B04, B05B, B06B, B07, B08, D06B, D06C, D06L, F25J, F26, C14C, H05H. 24 -Micro-structure and nano-technology: A62D , B01D45 , B01D46 , B01D47 , B01D49 , B01D50 , B01D51 , B01D52 , B01D53, B09, B65F, C02, F01N, F23G, F23J, G01T, E01F8, A62C.
Mechanical engineering, s=4
25 - Handling: B25J, B65B, B65C, B65D, B65G, B65H, B66, B67. 26 - Machine tools:B21, B23, B24, B26D, B26F, B27, B30, B25B, B25C, B25D, B25F, B25G, B25H, B26B. 27 - Engine pumps, turbines: F01B, F01C, F01D, F01K, F01L, F01M, F01P, F02, F03, F04, F23R, G21, F99Z. 28 -Textile and paper machines: A41H, A43D, A46D, C14B, D01, D02, D03, D04B, D04C, D04G, D04H, D05, D06G, D06H, D06J, D06M, D06P, D06Q, D99Z, B31, D21, B41. 29 - Other special machines: A01B, A01C, A01D, A01F, A01G, A01J, A01K, A01L, A01M, A21B, A21C, A22, A23N, A23P, B02B, C12L, C13C, C13G, C13H, B28, B29, C03B, C08J, B99Z, F41, F42. 30 -Thermal processes and apparatus: F22, F23B, F23C, F23D, F23H, F23K, F23L, F23M, F23N, F23Q, F24, F25B, F25C, F27, F28. 31 - Mechanical elements: F15, F16, F17, G05G. 32 -Transport:B60, B61, B62, B63B, B63C, B63G, B63H, B63J, B64.
Other fields, s=5
Appendix B – Krugman index of technological specialization.
The Krugman (1991) specialization index (hence, TS) expresses the degree by which country shares of different technologies differ with respect to the shares prevailing in the rest of the world:
) α (α abs =
TS s,i s, i =
s
i
5
1
,
whereabsindicates the absolute value, αs,i is the share of technologys(s=1,2,…5in our case) in countryi and αs,i is the share of technology sin the rest of the world. It is easy to show
that 0≤ TSi ≤ 2. At its lower bound, the technological structure of a country is the same as the rest of the world. At its upper bound, the country does not share any technology with the rest of the world.
Acknowledgements
We would like to present our thanks to the audience of the 2012 Workshop “Competition, innovation and competition policy”, University of St Andrews, of the 2012 OECD Workshop “Patent Statistics for Decision Makers”, of seminar’s participants at the Scuola Superiore Sant’Anna, at the University of St Andrews, for their useful comments and insights.
References
Archibugi, D., Pianta, M., 1992. Specialization and size of technological activities in industrial countries: The analysis of patent data, Research Policy, 21 (1), 79-93.
Arellano, M., Bond., S., 1991. Some tests of specification for panel data: Monte Carlo evidence and an application to employment equations. Review of Economic Studies, 58, 277–97.
Attanasio, O. P., Picci, L., Scorcu, A. E., 2000. Saving, growth, and investment: a macroeconomic analysis using a panel of countries. Review of Economics and Statistics 82 (2), 182-211.
Caselli, F., Koren, M., Lisicky, M., Tenreyro, S., 2012. Diversification through trade. Society for Economic Dynamics Meeting Papers n. 539.
De Rassenfosse, G., Dernis, H., Guellec, D., Picci, L., van Pottelsberghe de la Potterie, B., 2013. The worldwide count of priority patents: A new indicator of inventive performance. Research Policy 42 (3), 720 – 737.
European Patent Office, 2013a. PATSTAT database, April 2013 Edition.
European Patent Office, 2013b. Data catalogue for the EPO Worldwide Patent Statistical Database, April 2013 Edition.
Guellec, D., van Pottelsberghe de la Potterie, B., 2001. The internationalization of technology analysed with patent data. Research Policy 30 (8), 1253-1266.
Hart, P.E., 1995. Galtonian regression across countries and the convergence of productivity. Oxford Bulletin of Economics and Statistics 57, 287–293.
Koren, M., Tenreyro, S., 2013. Technological diversification. The American Economic Review 103 (1), 378-414.
Krugman, P. R., 1991. Geography and trade. MIT press, Cambridge, Massachusetts.
Patel, P., Pavitt, K., 1991. Large firms in the production of the world’s technology: an important case of ‘non-globalisation’. Journal of International Business Studies 22 (1), 1-22.
Picci, L., 2010. The Internationalization of inventive activity: A gravity model using patent data. Research Policy, 39 (8), 1070-1081.
Schmoch, U., 2008. Concept of a technology classification for country comparisons. Final report to the World Intellectual Property Organisation (WIPO). Available online: http://www.WIPO.int/export/sites/www/ipstats/en/statistics/patents/pdf/WIPO_ipc_tec
hnology.pdfaccessed online: 4 July 2013.
Tables
Table 1. Patents specialization and internationalization.
Period Spec TS Iai
1990 – 1993 2.529 .428 8.305 1994 – 1997 3.018 .382 9.135 1998 – 2002 3.428 .377 12.405 2003 – 2006 3.147 .378 12.645
Notes: Spec is the inverse of the coefficient of variation of the TRCA index.TSis Krugman's (1991) index of technological
[image:12.595.71.558.359.635.2]specialization.Iaiis theInvAppInvmeasure of internationalization of R&D activities in Picci (2010).
Table 2. Estimates
(1) (2) (3) (4) (5)
Log inventive size 0.536***
(0.050)
0.691***
(0.074)
0.016
(0.195)
0.136**
(0.067)
0.613
(0.475)
Internationalization 0.022***
(0.005)
0.049***
(0.010)
-0.023
(0.017)
0.013**
(0.005)
0.043**
(0.016)
1-year lagSpec 0.746***
(0.099)
0.381*
(0.203)
Observations 578 408 34 544 510
R2 0.326 0.298 0.017 0.621
Adjusted R2 0.304 0.274 -0.047 0.608
F 9.086 0.950 68.833 3.469
Fixed Effects Yes Yes No Yes Yes
Notes:The independent variable in Columns 1,2,4,5 is theSpecindex of specialization. In Column (3) it is the variation of
Specbetween 1990 and 2006. Column (1) displays the results for the OLS regression. Column (2) displays the results for the
Instrumental Variable model. Column (3) displays the OLS results for changes inSpec. Column (4) employs the Fixed
Effects estimator, and Column (5) employs the Arellano – Bond estimator. *** indicates significant at 1% level; ** at 5%