R E S E A R C H A R T I C L E
Moving on and moving out: The implications of socio
‐
spatial
mobility for union stability
Marina Shapira
1|
Vernon Gayle
2|
Elspeth Graham
31
University of Stirling, Stirling, UK
2
University of Edinburgh, Edinburgh, UK
3
University of St Andrews, St Andrews, UK
Correspondence
Marina Shapira, University of Stirling, Stirling, UK.
Email: [email protected]
Funding information
ESRC, Grant/Award Numbers: ES/K007394/1 and RES‐625‐28‐0001
Abstract
This study explores the role of family migration in the life course of couples. We ask
whether internal migration and residential mobility for contemporary dual
‐
earner
couples has negative consequences for the stability of their partnership and investigate
whether any negative changes in partners' employment characteristics following family
migration are associated with higher risks of dissolution of their unions.
We use the British Household Panel Survey, which provides nationally representative
data on households and couples, over the period of 18 years and has a wide range of
potentially important prospective and retrospective information on households and
individuals. We undertake a duration analysis of union dissolution by modelling the
hazard of union dissolution.
The findings show that union stability is affected by spatial moves
—
geographically
mobile couples are at higher risk of union dissolution. Long
‐
distance internal migration
and frequent moves increase the risk, whereas short
‐
distance residential moves are
associated with greater union stability. Overall, we found that the negative effect of
family migration on union stability is relatively small and decreases over the time.
Similarly, positive effects that some types of family migration might have on union
stability also tend to decrease over the time.
We found that the risk of union dissolution is better explained by partners' socio
‐
demo-graphic characteristics (age and level of education), and by the characteristics of their
union such as its type and duration. Union stability is also associated with the
employ-ment and occupational characteristics of both partners, as well as with changes in these
characteristics. Negative changes in occupational position or employment status of
either partner, but especially of the male partner, increase the risk of union dissolution.
However, the effect of changes in the employment characteristics of each partner on
the union stability is relatively small and tend to disappear over the time.
We found some evidence that the impact of the negative changes in employment
characteristics of geographically mobile couples postmigration on the stability of their
union is mediated by the gender of the partner who experienced these changes.
Neg-ative changes in the employment status of the male partner postmigration slightly
increase the risk of union dissolution, whereas negative changes in female partner's
employment postmigration slightly decrease that risk. We found that the risk to the
-This is an open access article under the terms of the Creative Commons Attribution‐NonCommercial‐NoDerivs License, which permits use and distribution in any
medium, provided the original work is properly cited, the use is non‐commercial and no modifications or adaptations are made.
© 2018 The Authors.Population, Space and PlacePublished by John Wiley & Sons Ltd.
DOI: 10.1002/psp.2180
Popul Space Place. 2018;e2180. https://doi.org/10.1002/psp.2180
union's stability is highest immediately after the adverse changes in the male partner
employment status happen, but that the risk reduces with the passage of time.
K E Y W O R D S
BHPS, family life, longitudinal analysis, socio‐economic mobility, spatial mobility
1
|I N T R O D U C T I O N
Living arrangements are influenced by social and demographic trends and
changes in social norms related to marriage, childbearing, and women's
employment (Andersson, 2002; Bures, 2009). As a result, family life has
been reshaped, with cohabitation becoming more usual aspect (Beaujouan
& Ní Bhrolcháin, 2011) and union dissolution (i.e., a split for an unmarried
couple, and a separation or a divorce for a married couple) becoming a
common demographic feature in many Western countries including the
UK (e.g., Boyle, Kulu, Cooke, Gayle, & Mulder, 2008; Wu & Penning,
2017). The factors that are associated with union dissolution are numerous
and include increased diversity within populations. Contemporary partners
are bringing to the union different attitudes and expectations about family
life, preferences about the type of union, different perceptions about
gender roles, and differences in socio‐economic status, and in educational
characteristics. Contemporary partners in a union often have different
prior cohabitation/marital histories, children from previous unions, etc.,
and these previous experiences influence union stability (e.g., Wu &
Penning, 2017; Feijten & van Ham, 2013; Goldscheider, Kaufman, &
Sassler, 2009; Boyle, et al., 2008; Reczek, Elliott, & Umberson, 2009;
Lehrer & Chiswick, 1993; Morgan & Rindfuss, 1985; Glick, 1977, 1988).
This increased diversity in the experiences of partners in a union is
linked to increased socio‐economic and geographical mobility. It can
be argued that both types of mobility have an increasing impact on
family life, and on union stability. Yet the role of family migration on
the subsequent stability of a union, which is the focus of the present
study, is largely underexplored. Although there are several studies that
examine the effect of family life‐course events such as union
forma-tion and union dissoluforma-tion on subsequent residential mobility (e.g.,
Asher & Bloom, 1982; Clark, 2013; Cooke, Mulder, & Thomas, 2016;
Feijten & van Ham, 2013; Flowerdew & Al‐Hamad, 2004; Wu &
Penning, 2017), only a few studies have considered the potential
impact of family migration on the subsequent union stability, and even
fewer studies have attempted to model this impact using life‐history
data (e.g., Boyle, et al., 2008; Frank & Wildsmith, 2005; Mincer,
1978; Muszynska & Kulu, 2007; Trovato, 1986). Furthermore,
although many studies have looked into the relationship between
spa-tial and socio‐economic mobility of couples (e.g., Clark & Morrison,
2012; Clark, van Ham, & Coulter, 2014; Clark & Withers, 2002;
Fielding, 1996; Savage, 1988; van Ham & Manley, 2014), there are
no previous studies that attempt to disentangle the interaction
between geographic mobility, social‐economic mobility (both upwards
and downwards), and the stability of cohabitation/marriage unions,
which is the second focus of the present study.
In this paper, we examine the impact of family migration for British
married and cohabitating couples, along with the accompanying
changes in employment status and occupational position for both
part-ners, on the stability of their unions using longitudinal data for years
1991–2008 from the British Household Panel Survey (BHPS).
2
|M I G R A T I O N , E M P L O Y M E N T , A N D
U N I O N S T A B I L I T Y
2.1
|Family migration and union stability
Union dissolution is a widespread demographic feature in the Western
societies. Studies show that union dissolution has become an
increas-ingly common experience (Milan, Wong, & Ve′zina, 2014). Studies also
show that life‐course transitions such as dissolution of a union are
dependent upon and shaped by previous life‐course transitions,
including the timing and sequencing of such events as marriage,
child-birth, employment and retirement, (e.g., Wu & Penning, 2017).
Among the factors that affect union stability is the type of union:
married couple are less likely to separate than cohabitating couples
(Hoem & Hoem, 1992). A higher number of previous unions is positively
correlated with union instability (e.g., Martin & Bumpass, 1989; Reczek,
et al., 2009). Duration of the union and the presence of younger children
are also consequential for union stability: longer unions are more likely to
survive and couples with young children are more likely to stay together
(Manning, 2004; Waite & Lillard, 1991; but also see Chan & Halpin, 2003,
who found evidence to the contrary in the UK). Age at union formation is
negatively correlated with union dissolution (Chan & Halpin, 2003).
Values and attitudes, in particular the gender role attitudes of the
part-ners in a union, are important and research evidence shows that unions
where women hold more egalitarian views are more likely to dissolve
(Cooke, 2008; de Graff & Kalmijn, 2006; Lye & Biblarz, 1993; but see
Bianchi, Milkie, Sayer, & Robinson, 2000).
Educational and employment characteristics, as well as the
differ-ences between partners in these characteristics, were also identified as
consequential for union stability. Increased educational level, labour
mar-ket participation, and occupational attainment of women are generally
believed to be contributors to union instability through reduced women's
financial dependence on their partners (Becker, 1974; Mincer, 1978; Chan
& Halpin, 2003). Yet the evidence regarding the relationship between the
level of education of female partners and the stability of their unions is
sometime contradictory. Although there is some evidence that separation
has become more common in relationships where the woman is better
educated, there is also research evidence that better educated couples
are less likely to divorce (e.g., Morgan & Rindfuss, 1985).
There is an extensive literature showing that migration can be a very
changes in residence have been found to influence psychological well‐
being and has been linked to depression (Magdol, 2002; Makowsky,
Cook, Berger, & Powell, 1988; McCollum, 1990; Meyer, 1987; Weissman
& Paykel, 1972). It seems reasonable to expect, therefore, that migration
may affect union stability and lead to union dissolution.
Family migration often brings changes in the partners' employment
characteristics, such as labour market participation, occupational
stand-ings, and wages. Both partners in a couple may experience negative
changes in their employment characteristics postmigration. Studies show
that the unemployment rates of married male migrants are lower at the
point of destination than at the point of origin, but that their
unemploy-ment rates at the destination point are higher than those of nonmigrant
males at the destination (Mincer, 1978). Yet studies also show that family
spatial moves, and especially the male partner's employment‐related
migration more often benefits the male spouse at the expense of the
female spouse than the other way around (Bird & Bird, 1985). Shortly
after migration, female migrants are more likely to be economically
inac-tive or unemployed than nonmigrant women with similar characteristics
(Boyle, Cooke, Halfacree, & Smith, 1999a,b; Boyle, Cooke, Halfacree, &
Smith, 2001; Gayle, Boyle, Flowerdew, & Cullis, 2008; Kulu & Milewski,
2007; Shihadeh, 1991). When employed, female migrants tend to be
underemployed, having lower incomes and working shorter hours, for
example, than non‐migrant women with similar characteristics (e.g.,
Boyle, et al., 2003; Boyle, et al., 1999a; Boyle, et al., 2001; Cooke, 2001,
2004; Cooke & Bailey, 1999; Clark & Withers, 2002; Withers & Clark,
2006). The female spouse's potential personal losses from the move are
smaller if she was not employed prior to migration or was employed in
a job with a good degree of spatial transferability (Bird & Bird, 1985).
Negative changes in employment status and characteristics (such as
exist from employment, reduced working hours, and worsened
occupa-tional status) are linked to union stability. Although unemployment for
either partner might have a negative impact on the quality of marital
rela-tionships, unemployment of the male partner has the potential to increase
the family's financial hardship to a greater extent than the female
partner's unemployment and has been found to have a negative impact
on family stability (e.g., Bailey, Blake, & Cooke, 2004; Boyle, et al., 2003;
Broman, Hamilton, & Hoffman, 1990; Cooke, 2001, 2004; Gayle, et al.,
2008; Morrison & Lichter, 1988; Peterson, Steinmaiz, & Sussman, 1999).
2.2
|Tied spouses and tied migrants: Gendered
impact of spatial mobility on socio
‐
economic outcomes
of the partners in a family union
Migration is often undertaken to enhance individuals' socio‐economic
outcomes. In accordance with the economic model of family migration
(Bergstrom, 1996; DaVanzo, 1976; Jacobsen & Levin, 2000; Sjaastad,
1962), families move when the perceived gains of moving surpass the
costs. Yet the impact of migration on the socio‐economic outcomes of
partners in union might be different for the initiator of migration and
for their partner. Mincer (1978) a was among the first to analyse
migra-tion taking family context into consideramigra-tion. He explored the effect of
family ties on the probability of migration and on consequent changes
in employment and earnings of family members, as well as on family
integrity itself. He examined the phenomena of“tied moving”and“tied
staying”and defined“tied”persons in the family as those whose gains
from migration were dominated by gains or losses of the spouse (ibid.)
consequently describing potential losses from migration experiences by
the“tied”partner as“net personal loss”versus“net family gain”(ibid.).
Historically, in Britain, female employment was seen as subsidiary
(Kelan, 2008). Due to lower earning power and discontinuous labour force
participation, women were more likely to be “tied” spouses and“tied”
movers than men (Shihadeh, 1991; Bird & Bird, 1985; Boyle & Halfacree,
1999). It was taken for granted that priority would be given to employment
opportunities for the male partner and employment‐related spatial moves
were almost always associated with the male partner's career. Of all the
dramatic changes in patterns of employment in Western industrialised
economies over the past 50 years, among the most notable has been the
significant rise in female labour market participation and the increasing
het-erogeneity of female work experiences (Fraser, 1994; Lewis, 2001). The
contemporary British labour market is characterised by dual‐earner
cou-ples, where both partners engage in employment (Bailey et al., 2004;
Bardasi & Gornick, 2003; Bures, 2009; Gornick & Meyers, 2004).
Although male partner's employment continued to play an
impor-tant role in migration decisions, occupational characteristics of women
started to play an increasing role in family migration decisions (Smits,
et al., 2004). In dual‐earner couples, a decision to move is shaped by
considerations of losses or gains for each of the partners, and
career‐related and earning‐related variables of both partners at
cur-rent location affect their migration decision (Lichter, 1982). Clark and
Huang (2006) demonstrated that economic gains from moving for
dual‐earning couples are modest and come when women enter the
labour market after migration. Female partners with higher levels of
education, higher occupational status, or higher contributions to family
earnings are those who stand to lose most as the result of family
migration (Lichter, 1980, 1983, 1988; Morrison & Lichter, 1988).
Indeed, dual‐earning couples are less likely to move than couples
where only one partner is employed (e.g., Shields & Shields, 1993; Clark
& Huang, 2006). Recent research shows that“tied migration”is becoming
relatively rare and not limited just to women: rates of tied migration are
similar for men and women (e.g., Cooke, 2013). Cooke (2013) analysed
not only those who moved but also those who would not have moved
had they been single (tied migrants) and those who did not move but
would have moved had they been single (“tied”stayers). He concluded that “tied staying”is both more common than tied migration and equally expe-rienced by men and women. In modern dual‐earning/dual‐career couples,
there is no longer an obvious“lead migrant”and a“trailing spouse”(ibid.).
When employment opportunities arise that require migration, it is
reasonable to assume that the decision to migrate will be negotiated
rather than being automatically structured by the couple's established
gender roles. Cooke (2008) demonstrated the importance of the
gen-der role beliefs of partners in a union in the relationship between the
family migration decision and the female partner's employment status.
Thus, families have a lower probability of moving when the wife is
employed and the couple shares egalitarian gender role beliefs. An “egalitarian”couple has a higher probability of moving when the wife is unemployed and wants to work. If a couple is not“egalitarian”then
according to Clark (ibid.), the migration decision is dominated by the
husband's labour market characteristics.
Given these recent trends of an increase in the share of dual‐
important to understand the joint impact of family migration and the
accompanying changes in the labour market characteristics
experi-enced by either/both of partners in a union, on the stability of that
union and on the likelihood of union dissolution.
2.3
|Relating geographical and social mobility to
union stability
The effect of spatial mobility on family life goes beyond the stress that
partners might experiences due to negative changes in employment
characteristics of one or both of the partners. Even if spatial mobility
brings positive changes in employment characteristics, the partners
might still find the situation challenging. Thus, Tzeng and Mare (1995)
found that positive changes in wives' socio‐economic and labour force
characteristics over the course of their marriages increase the odds of
marital disruption. This negative effect of upward social mobility on
family stability is not very surprising. After all, both geographic and
social mobility bring change and uncertainty, might sever existing ties
with familiar social and/physical surroundings, and lead to isolation
and stress, hence, affecting various aspect of the family life.
Indeed, social and geographic mobility have lots in common. First
of all, these two types of mobility are often conflated by participants:
social mobility may necessitate spatial mobility on varying scales (daily,
permanent, etc.). Social mobility might be linked directly to
geographical mobility, so that those individuals who are best able to
move geographically are also most likely to achieve intragenerational
social mobility (i.e., within the course of their working life). Very often
to become socially mobile one first needs to become spatially mobile
(Clark & Morrison, 2012; Clark et al., 2014; Clark & Withers, 2002;
Fielding, 1996; Savage, 1988). Studies show that spatially mobile
indi-viduals are more likely to be employed, and/or to live in a better
neighbourhood postmigration than spatially immobile individuals
(Clark & Morrison, 2012; Clark & Withers, 2002; Clark et al., 2014).
Because spatial and socio‐economic mobilities have many
similar-ities in terms of their consequences for individuals involved (Clark
et al., 2014), it is reasonable to suggest that the study of the
relation-ship between spatial mobility and union stability would benefit if
information about related changes in labour market participation,
employment and earnings is also considered. Moreover, one can
expect, that theories and hypotheses that relate between geographical
mobility and family life would also be relevant for studying the
rela-tionship between the latter and social mobility (ibid.).
Based on the similarities between special and social mobility
outlined above, the following hypotheses can be drawn regarding
the impact of either/both of these mobilities on family life:
The selectivity hypothesis suggests that geographically and/or
socially mobile people are less likely to establish family or partnership
unions because they are preselected according to their socio‐
demo-graphic and characteristics—as a rule such individuals are often
youn-ger, better educated, more individualistic, career oriented, etc. (e.g.,
Bartram, Poros, & Monforte, 2014; Harris & Todaro, 1970; Mincer,
1978). A similar line of reasoning could be used to suggest that not
only do socially and/or spatially mobile individuals postpone the union
formation, but once in a union they might more readily opt for union
dissolution when problems and tensions arise in the union (Allan &
Hawkins, 2017). Therefore, according to the selectivity of migration
hypothesis geographically and socio‐economically mobile couples are
more likely to exit the existing union than nonmobile couples.
Similarly, to the selectivity of migration hypothesis, the
socialisation hypothesissuggests that mobile people are less likely to
establish family or partnership unions and are also less likely to remain
in such unions compared to nonmobile individuals. This hypothesis
relies on the premise that geographically and socially mobile people
would move away from physical and social environment of their origin,
with particular social norms, which may encourage early union
forma-tion and discourage separaforma-tion (Kulu, 2005). Geographically and
socially mobile individuals become exposed to new environments,
where it might be more common to stay single or where separation
is more socially acceptable. This socialisation hypothesis is matched
well with theadaptation hypothesis, which suggests that as time goes
by, the behaviour of mobile individuals increasingly comes to resemble
the dominant behaviour at the destination (ibid.).
To the contrary, In contrastthe isolation hypothesissuggests that
any move between social/physical environments forces individuals
into a new, potentially hostile environment, where they are poorly
integrated and do not receive support from former networks.
There-fore, increased bonds in the family might be viewed as a coping
strat-egy in a situation of social isolation, with mobile individuals becoming
more oriented towards their families, and partners becoming more
reliant on each other (Andersson, 2002; Kasarda & Billy, 1985; Mulder
& Malmberg, 2014; Mulder & Wagner, 2001). Thus, according to the
isolation hypothesis, socially and/or geographically mobile couples
are more likely to stay together after migration than nonmobile
couples.
2.4
|Aims of this study and the research hypotheses
This study aims to address a gap in the research evidence and to
contribute to a better understanding of the relationship between
family migration and union stability. We investigate the impact of
family migration and (related) changes in employment and occupation
statuses of both partners on the union stability of married and
cohabitating couples in Britain during the period 1991–2008.
2.4.1
|Research question
The overarching research question is “does family migration and
subsequent changes in employment characteristic of the partners in
a union increase the risk of union dissolution and, if so, under what
circumstances?”
2.4.2
|Research hypotheses
The following research hypothesis are tested in order to answer this
research question:
H1. The selectivity of migration hypothesis leads to the
expectation that spatially mobile couples will have higher
rates of union dissolution than nonmobile couples. The
selectivity hypothesis also suggests that couples that
move frequently may have the very characteristics that
dissatisfaction with the current state of affair,
individual-ism, and orientation towards professional success), and
therefore couples that undertake repeated migrations
are more likely to experience union dissolution.
H2. The socialisation hypothesis suggests that union
dissolution rates would be highest soon after the couple
moved to new, unknown surroundings, and needed to
adjust to these surroundings. However, according to
the adaptation hypothesis, with the passage of time
after migration, the union dissolution rates of“movers”
would become similar to those of nonmovers in their
locality of destination. Based on the socialisation
hypothesis, one can also expect that long‐distance
migration would bring a greater disruption from habitual
surroundings and hence increase the risk of union
disso-lution compared to short‐distance migration.
H3. “Tied moving”hypothesis: The existing evidence on
“tied” movers and on the differential impact of family migration on the socio‐economic outcomes of the male
and female partners in a union suggests that the
relation-ship between the change in employment characteristics
postmigration and union stability would also be
differen-tiated by (a) the gender of the partner who is
experienc-ing these changes and (b) the initiator of the migration.
H3.1. Couples with“tied”movers (i.e., couples where one
partner moved for employment reasons associated with
the other partner) would be less stable and more at risk
of union dissolution than couples that moved for a
com-mon aim (either employment‐related or other, such as
moving for accommodation reasons).
H3.2. It could be expected that negative changes in
employment characteristics post‐migration of the“tied”
mover would be less consequential for union stability
than the negative changes in employment characteristics
of the partner who initiated the migration.
H4. Existing research on the impact of family migration
on the socio‐economic outcomes of partners in a couple
suggests that the impact of family migration on union
sta-bility is heightened if one of the partners or both partners
experience changes in their employment and occupational
characteristics post‐migration. However, we expect that
the effect of the negative changes in employment
charac-teristics of partners on union stability will be gendered.
H4.1. Because male partners are more likely to initiate a
move for a job‐related reasons we expect that negative
changes in employment characteristics of male partners
postmigration will be linked to a higher risk of union
dis-solution than negative changes in employment
character-istics of female partners post‐migration.
H4.2. Because female partners are more likely lose local
ties and support and friendship networks after moving,
they are more likely to suffer from social isolation in the
new place especially of they become unemployed or
eco-nomically inactive. Therefore, we expect that if female
partner employment characteristics worsen after a move,
this would encourage female partners to hold on to the
partnership and thus reduce the odds of union dissolution.
The study tests these hypotheses, controlling for other factors
that are expected to influence union dissolution, such as individual
characteristics of the partners (age, level of education, employment
status and occupation, attitudes to gender roles, etc.) and
charac-teristics of their unions (such as the type of the union, the length
of the union, the number of previous unions, the presence and
age of the children, and the gender role beliefs of the partners in
the union).
We use longitudinal data to study the effects of family migration,
including both internal, long‐distance migration and short‐distance
residential moves, on union dissolution (defined as divorce or
separa-tion of married couples and a split of cohabitating couples) and
exam-ine the joint effects of family migration and changes in employment
status and occupational characteristics of both members
postmigration, on the stability of the couple's union.
3
|M E T H O D O L O G Y
3.1
|Survey data
The BHPS is a large‐scale panel study which was carried out between
1991 and 2008 (see Taylor, Brice, Buck, & Prentice‐Lane, 2010) and
was then subsumed into Understanding Society—The UK Household
Longitudinal Study. The BHPS dataset is especially well suited to the
current analyses because it provides a nationally representative
sample and allows tracking of the residential moves of households
and examination of the short‐term and long‐term consequences of
the moves on family stability over a long period (up to 18 years).
The structure of the BHPS enables the linking of prospective
data to retrospective data on partnership, employment, and
migra-tion histories. The core data collecmigra-tion instrument in the BHPS is
an interview with all adult members of the household. The design
of the BHPS facilitates the linking of individual‐level information
for the head of household and their spouse and thus the creation
of records for couples, which was done in this study. Due to the “following rules”of the survey, adults continue to be tracked even after they leave the household. This is especially critical for the study
of union dissolution.
We created a specialised dataset from the BHPS, which allows
the joint investigation of partnership history, the couple's migration
history and the employment history of both partners. Our subsample
are couples (females aged 16–64 and their spouses living in Britain
between 1991 and 2008). We follow couples in unions (marriage or
cohabitation) until either the union dissolves or they are censored
at the end of the study period. The respondents were asked about
of separation and dates of divorce are recorded; we used the date of
the separation rather than divorce date as the end of the union.
To create records for couples, we selected into our sample
indi-viduals from the BHPS who lived with a partner at any time during
the lifetime of the BHPS (which included both cohabitating and
married couples). We selected female respondents (aged 16–64) first,
and to every female respondent record, we attached information
about her partner/s. Respondents who never had a partner during
the lifetime of the BHPS were excluded. For those female respondents
who had several cohabiting partners during the lifetime of the BHPS,
we created a record, which contained information about their partners
in the current or the most recent union. The final dataset consists of
2,342 couples; there are 24,166 union‐year observations, and on
aver-age 1,375 observations per wave. The variables used in this study are
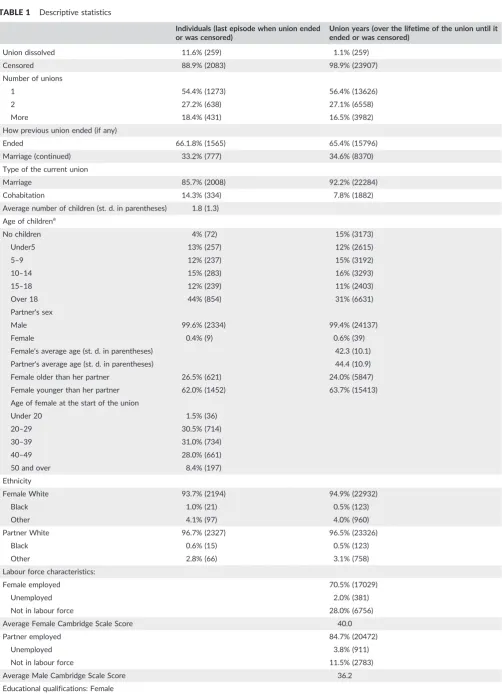
described in Table 1.
The focus of the study is spatial mobility and employment and
occupational changes and union dissolution of married and
cohabita-tion couples. The outcome variable is union dissolucohabita-tion.
Family migration was defined as change of address for both
part-ners in the couple, between any two consecutive annual BHPS
house-hold interviews. If such change took place, the respondents were
asked about the date of their move, and about the distance of the
move and the reasons for the move. Using this information, we
constructed a migration history dataset from the BHPS data for waves
1–18 (UK Data Archive Study Number 5151) for each respondent
before combining the migration histories of the male and the female
partners into a single record.
To exclude possibility that only one partner moved spatially
whereas the other partner stayed behind, we defined spatially mobile
couples as those couples where both partners were movers and
belonged to the same household after the move.
Knowing the dates of spatial moves and the dates of union
disso-lutions was crucial for the aims of our study because this allowed us to
establish the sequence of the events and to model the causal
relation-ship between family migration and union dissolution.
The BHPS contains suitable measures of family and home life.
The records for each couple were augmented with data from the
BHPS Consolidated Marital Cohabitation and Fertility Histories
dataset (UK Data Archive Study Number 5629) for the female
part-ners, and other relevant information about each partner's date of
birth, ethnicity, religion, education, employment, and occupational
characteristics.
The BHPS contains appropriate information on employment,
although it does not record the date when changes in employment
or occupational characteristics of the respondents happen. These
changes can be established through a comparison of the employment
and occupational characteristics of respondents between any two
consecutive BHPS waves. Therefore, although we are able to establish
whether these changes happened during the same year as a spatial
move, it is not possible to establish whether changes in the
employ-ment and occupational characteristics of either partner occurred prior
to, or after, the family migration event. Without an established a time
sequence between these event we cannot claim that changes in the
movers' employment and occupational characteristics were caused
by the move because we cannot exclude the possibility that these
changes took place prior to the move and perhaps contributed to
the decision about family migration.1
Therefore, although our main focus is on the way spatial moves
impact union stability and union dissolution, we also consider how
overall changes in employment and occupational characteristics affect
union stability and then examine the combined effect of the spatial
move and changes in the employment and occupational status of each
partner postmigration on the stability of the union.
3.2
|Analytical method
We estimated Cox proportional hazard models for survival analysis of
couples' unions. The method does not assume any particular
distribu-tion within the independent variables, but it does assume that the
effects of the independent variables on survival are constant over time
and are additive on one scale (Cox & Oakes, 1984; Singer & Willett,
1993).
The dependent variable in the model was the hazard of union
dis-solution for a couple. Independent variables captured (a) the impact of
the baseline (i.e., the duration of the union over the years of the
BHPS); (b) the effects of a time‐varying variable that is a continuous
function of the duration of the BHPS (e.g., the age of the partners,
number of previous migrations/moves, time since the last migration/
move, the length of the union in months from the time it started,
and the age of the couple's children); (c) the values of a time‐constant
variable (e.g., gender, race, religion age when union started, age
differ-ence in the couple, and attitudes to gender roles); and (d) the effects
of time‐varying variables whose values can change only at discrete
times (e.g., level of education, employment status and occupational
status and the changes in those). To test the proportional hazard
assumption, we fitted models where some covariates (e.g., distance
of migration, reasons for migration, and changes in both partners'
employment and occupational characteristics) have both time‐
invari-ant and time‐variant components (i.e., the main effect and the
interac-tion with the time variable; Statacorp 11 2009; Longhi & Nandi, 2015;
Boyle, Feng, & Gayle, 2009). To control for the clustering of events
within individuals and possible unobserved determinants of union
dis-solution, we fitted our models with robust standard errors.
4
|R E S U L T S
4.1
|Descriptive statistics
There was only one same‐sex couple in the dataset, therefore, we
decided not to differentiate between heterosexual and same‐sex
couples. Over the lifetime of the unions, the average age of female
respondents is 42 years whereas the average age of their partners is
46 years. Twenty‐six percent of female respondents are older than
their partners, while 62% of them are younger than their partners.
Twenty‐eight percent of the female respondents and 24% of the male
1
TABLE 1 Descriptive statistics
Individuals (last episode when union ended or was censored)
Union years (over the lifetime of the union until it ended or was censored)
Union dissolved 11.6% (259) 1.1% (259)
Censored 88.9% (2083) 98.9% (23907)
Number of unions
1 54.4% (1273) 56.4% (13626)
2 27.2% (638) 27.1% (6558)
More 18.4% (431) 16.5% (3982)
How previous union ended (if any)
Ended 66.1.8% (1565) 65.4% (15796)
Marriage (continued) 33.2% (777) 34.6% (8370)
Type of the current union
Marriage 85.7% (2008) 92.2% (22284)
Cohabitation 14.3% (334) 7.8% (1882)
Average number of children (st. d. in parentheses) 1.8 (1.3)
Age of childrena
No children 4% (72) 15% (3173)
Under5 13% (257) 12% (2615)
5–9 12% (237) 15% (3192)
10–14 15% (283) 16% (3293)
15–18 12% (239) 11% (2403)
Over 18 44% (854) 31% (6631)
Partner's sex
Male 99.6% (2334) 99.4% (24137)
Female 0.4% (9) 0.6% (39)
Female's average age (st. d. in parentheses) 42.3 (10.1)
Partner's average age (st. d. in parentheses) 44.4 (10.9)
Female older than her partner 26.5% (621) 24.0% (5847)
Female younger than her partner 62.0% (1452) 63.7% (15413)
Age of female at the start of the union
Under 20 1.5% (36)
20–29 30.5% (714)
30–39 31.0% (734)
40–49 28.0% (661)
50 and over 8.4% (197)
Ethnicity
Female White 93.7% (2194) 94.9% (22932)
Black 1.0% (21) 0.5% (123)
Other 4.1% (97) 4.0% (960)
Partner White 96.7% (2327) 96.5% (23326)
Black 0.6% (15) 0.5% (123)
Other 2.8% (66) 3.1% (758)
Labour force characteristics:
Female employed 70.5% (17029)
Unemployed 2.0% (381)
Not in labour force 28.0% (6756)
Average Female Cambridge Scale Score 40.0
Partner employed 84.7% (20472)
Unemployed 3.8% (911)
Not in labour force 11.5% (2783)
Average Male Cambridge Scale Score 36.2
Educational qualifications: Female
respondents have no educational qualifications, whereas about 13% of
female respondents and 14% of male respondents have degree‐level
academic qualifications. Two percent of the female respondents are
unemployed and 28% are economically inactive at some point during
the lifetime of the BHPS. By contrast, 4% of male respondents are
unemployed, and 12% are outside the labour force. Socio‐economic
sta-tus is measured using the Cambridge Occupational Scale (see Stewart,
Prandy, & Blackburn, 1980). The average Cambridge Scale Score2for
the female respondents is 40 and 36 for the male respondents.
We investigate a series of background variables that previous
studies have indicated are associated with union dissolution. About
11% of female respondents and 17% of the male respondents
reported that they held traditional views on gender roles within the
family. Only 11% of females and 8% of male said that they were
mem-bers of a religious group. Ninety‐four percent of the females and 97%
percent of their partners are self‐classified as White British.
4.2
|Dissolution of marriages and cohabitating
unions
For our sample of households, union dissolution is relatively rare.
Overall, 11.6% of unions were dissolved within the lifetime of the
panel (259 out of 2,343), and 86% of couples were married at some
point during the panel. This latter figure may initially seem high but
is plausible because we are analysing current (or most recent) unions.
For a third of couples, their current marriage is a continuation of a
pre-vious cohabitation.
A total of 1.5% of female respondents entered their most recent
union when under age 20; 30% entered their current union between ages
20 and 29, 31% began their most recent unions between ages 30 and 39,
and the remaining 36% entered their current union aged 40 or older.
The average number of children is 1.8 per couple. Over the
lifetime of the unions, 15% of couples had no children under 18 years
of age, 12% of couples had children under age 5, 15% had children
aged between 5 and 9, 16% had children aged between 10 and 14,
and 11% had children aged between 15 and 18 years old.
4.3
|Migration
‐
related variables
The survey collected information on the date of the migration, reasons
for the migration, and the distance of the migration. We distinguish
between short‐distance (or residential) moves (under 30 miles) and
long‐distance migration within the UK (30 plus miles) and constructed
time‐changing variables for the number of previous migrations and for
the length of time since the last migration. The migration‐related
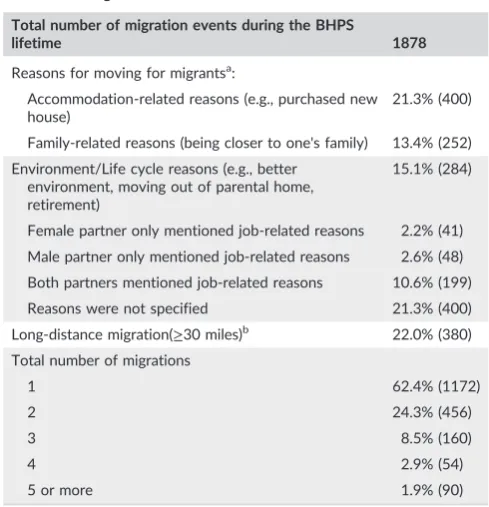
variables are presented in Table 2.
There are 1,878 migration events within the lifetime of the panel
(i.e., 24,166 union years). Sixty‐two percent of geographically mobile
couples moved only once, 24% moved twice, and the rest of the
migrants moved three or more times. Among spatially mobile couples,
28.2 miles was the average distance of a move. Only 22% of couples
moved 30 miles or more.
4.4
|Reasons for migration
In the BHPS, respondents were asked to report their reasons for
mov-ing (postmigration) and were able to give more than one reason. It is a
challenging task to capture the complexity of the reasons behind
fam-ily migration, especially when the partners in the couple are asked
about reasons post‐migration. It is possible that reasons a move given
by“movers”give postmigration (as in the BHPS) are slightly different
from those they used in their decision‐making process about
migra-tion. Yet we have no reasons to believe that the reasons given by
the movers postmigration are uncorrelated with the reasons that
influ-enced their migration decision in the first place.
The reasons for migration provided in the survey can be broadly
categorised as (a) migration for accommodation‐related reasons (this
includes buying, selling, and moving into larger or smaller
accommoda-tion), (b) family‐related reasons (e.g., moving in with family members or
moving closer to relatives), (c) environmental and lifecycle‐related
rea-sons (e.g., health, better environment, improved safety, retirement, or
academic study), and (d) job‐related reasons. If a respondent reported 2
[image:8.595.43.556.59.228.2]The Cambridge Scale is a measure of similarity of lifestyle and therefore gener-alised advantage/disadvantage. The scale is a continuous measure of social and material advantages. Scale scores represent an occupational unit's relative posi-tion within the naposi-tional order of social interacposi-tion and stratificaposi-tion. Separate scales are produced for men and women (Prandy, 1990). It is consistent there-fore that the mean for females is higher than the mean for males in this sample.
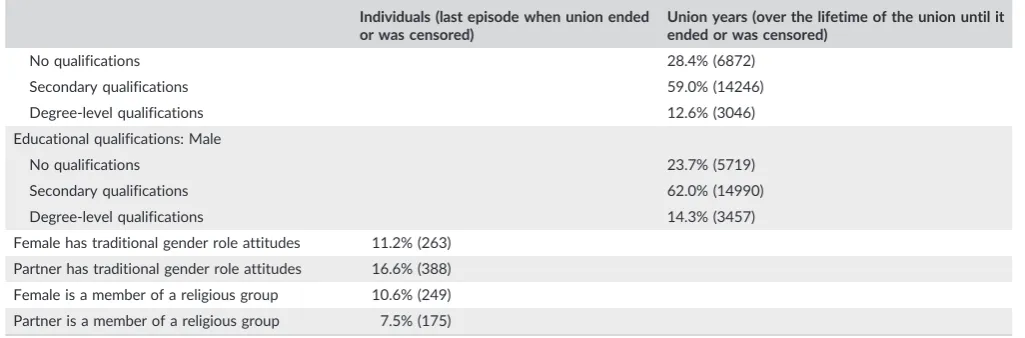
TABLE 1 (Continued)
Individuals (last episode when union ended or was censored)
Union years (over the lifetime of the union until it ended or was censored)
No qualifications 28.4% (6872)
Secondary qualifications 59.0% (14246)
Degree‐level qualifications 12.6% (3046)
Educational qualifications: Male
No qualifications 23.7% (5719)
Secondary qualifications 62.0% (14990)
Degree‐level qualifications 14.3% (3457)
Female has traditional gender role attitudes 11.2% (263)
Partner has traditional gender role attitudes 16.6% (388)
Female is a member of a religious group 10.6% (249)
Partner is a member of a religious group 7.5% (175)
a job‐related reason for migration, they were invited to provide further
details (see Appendix A). From this information, we constructed a new
variable“reasons for moving”by combining responses regarding the
reasons for moving for both the female and her partner. Because the
focus of our study is on family migration that results from job‐related
reasons of one or both or the partners, when more than one reason
for migration was reported, we gave a priority to job‐related reasons
for migration.
Similarly, if the female partner reported a nonjob‐related reason
for moving (e.g., accommodation‐related), but her male partner
reported a job‐related reason (e.g., new job), we classified the couple's
reason for moving as being related to the male partner's job, because
we assumed that the job‐related reason was a paramount reason, and
other reasons (e.g. an accommodation‐related reason such as moving
into a bigger house) was a consequence of the move for the
job‐related reason.
We attempted to identify the initiator of the move and the “trailing”spouse from the reasons for migration. Yet from the data it was not always possible to understand whether the move was
triggered by the male or the female partner's job reasons. Overall, very
similar proportions of male and female partners reported the job‐
related reasons for moving. Overall, job‐related reasons for family
migration were reported by 288 migrant couples (17% of all migrants).
In 240 cases, job‐related reasons were stated by female respondents.
In 247 cases, job‐related reasons for migration were reported by the
male partners. For 199 spatially mobile couples (69% of all spatially
mobile couples), both partners stated common, job‐related, reasons
for migration, and in these cases, it was not possible to identify who
initiated the move, and therefore, to identify who was the“leading”
migrant, and who was the trailing partner. In 41 cases, only the female
partner reported a job‐related reason for the move, and therefore this
migration can be defined as female‐led, whereas in 46 instances, the
migration was male‐led (i.e., only the male partner reported a job‐
related reason for the move). Due to the ambiguity of the data, we
decided not to differentiate between the initiator of migration and
the“trailing”partner and instead to differentiate between two
catego-ries of couples: first, those that moved for job‐related reasons and
where both partners stated job‐related reasons for migration;
second, those where a job‐related reason was reported only by one
partner.
4.5
|Relationship between reasons for migration
and distance of migration
There is a relationship between distance of migration and reasons for
migrating. The majority of those who moved for a reason not related
to a job (from 78% to 89%), moved within less than 30 miles. Half of
the couples who moved for one partner's job also moved a distance
of less than 30 miles. Two thirds of long‐distance moves were job‐
related. For short‐distance moves there was often a discrepancy
between the male and the female partner reasons for the move.
Among the couples who moved long distance, in two third of cases
both partners reported job‐related reasons for the move (see Table 3).
These findings suggest that job‐related moves involving
long‐distance relocation are more often perceived as a joint family
ven-ture, whereas in the case of short‐distance migration each partner tends
to stick to their own reasons and perceived benefits from moving.
4.6
|Dissolution of unions by different
characteristics
To investigate the associations between union dissolution and other
characteristics of the couple, we examined the survival time of unions
[image:9.595.44.289.54.308.2]over the lifetime of the BHPS. TABLE 2 Migration‐related variables
Total number of migration events during the BHPS
lifetime 1878
Reasons for moving for migrantsa:
Accommodation‐related reasons (e.g., purchased new house)
21.3% (400)
Family‐related reasons (being closer to one's family) 13.4% (252)
Environment/Life cycle reasons (e.g., better environment, moving out of parental home, retirement)
15.1% (284)
Female partner only mentioned job‐related reasons 2.2% (41)
Male partner only mentioned job‐related reasons 2.6% (48)
Both partners mentioned job‐related reasons 10.6% (199)
Reasons were not specified 21.3% (400)
Long‐distance migration(≥30 miles)b 22.0% (380)
Total number of migrations
1 62.4% (1172)
2 24.3% (456)
3 8.5% (160)
4 2.9% (54)
5 or more 1.9% (90)
aSee Charts 1 and 2 in Appendix A for detailed reasons for migration. See
Charts 2 and 3 in Appendix A for detailed job‐related reasons for migration.
bThose migrants for whom information about the distance of move was
available.
TABLE 3 Distance of migration by reasons for couple's migration (for those with nonmissing values for distance of migration), row percentages
Distance of migration Reasons for
couple's migration: up to 30 miles 30 miles or more
% % Total
Accommodation‐related 89.3 10.7 654
Family‐related 77.8 22.2 252
Environment/lifestyle/life cycle‐related
84.2 15.8 284
Other/unspecified reasons 85.8 14.2 246
Female partner only stated job‐related reasons
53.7 46.3 41
Male partner only stated job‐related reasons
52.1 47.9 48
Both partners stated job‐related reasons
33.7 66.3 199
Total 78 (1344) 22 (380) 1724
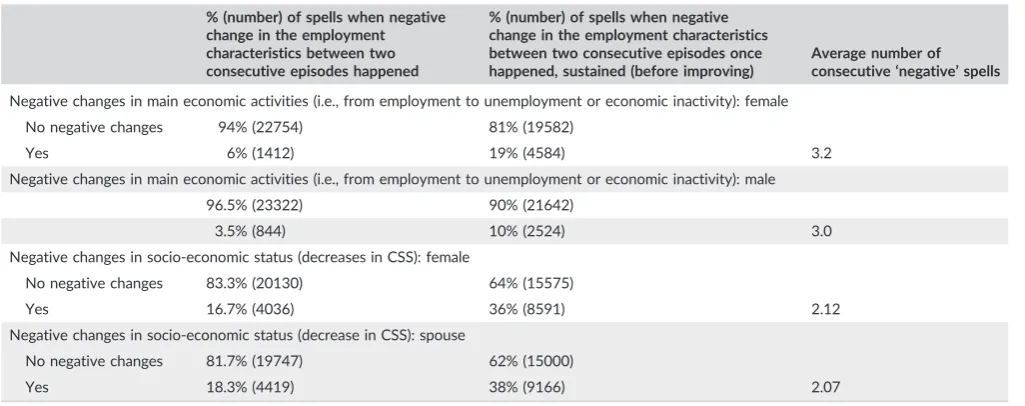
[image:9.595.306.550.545.733.2]Figure 1 presents plots with Kaplan–Meier survival estimates for
unions by type of relationship (rates of union survival are higher for
mar-ried couples); the age of the female partner at the start of the union
(sur-vival rate are better for couples where females were older at the start of
the union); age of the youngest child (survival rates are better for
cou-ples without children under 18); female respondent's membership of a
religious group (couples where the respondent is a member of a
reli-gious group have higher survival rates3); and ethnicity (unions where
the male partner is White British have slightly higher rates of survival).
The highest level of educational qualifications is also related to
union stability, with couples where the female has a degree‐level
qualification showing higher rates of survival. Further, the labour force
characteristics of the partners in the couple are important for union
sta-bility, and there is a noticeable difference between couples where the
male partner is outside the labour force and couples where the male
partner is employed, with the latter couples having higher survival rates.
Figure 2 compares the union survival estimates for migrant and
nonmigrant couples (with the former having worse rates of survival
overall) and presents plots with union survival rates for different
catego-ries of migrants. Over the life of the unions, those who moved for the
reasons of one partner's job have worse survival rates compared with
the rest of the migrant couples; partners who migrated more than once,
and in particular those who moved three or more times, are more likely
to split, separate, or divorce than those who did not move or moved
[image:10.595.57.530.43.546.2]only once. Those who moved within 30 miles have better survival rates FIGURE 1 Kaplan–Meier survival estimated by characteristics of the respondents
3
A very small share of the respondents is non‐White or stated that they are a
soon after the family migration; however, as time passes the survival
rates of both long‐and short‐distance mover couples converge.
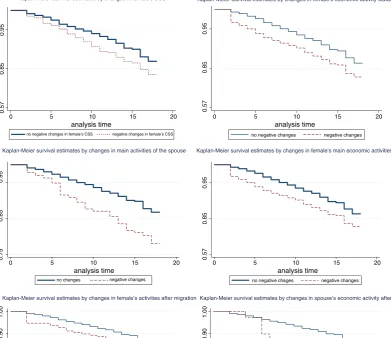
4.7
|Impact of changes in employment status and
characteristics on the stability of unions
During the life of the BHPS, the partners in a couple experienced a
number of changes in their employment characteristics. We define as “negative”an adverse change that took place between any two consec-utive waves of BHPS in either the main type of economic activity (i.e., a
change from employment to either unemployment or economic
inactiv-ity) and/or in socio‐economic status (measured by a decrease in the
Cambridge Scale score). We are interested in the long‐term impact of
these negative changes on union stability rather than simply the impact
of the changes when they occurred. Therefore, we constructed
vari-ables which measure not just a single event of negative change in the
employment characteristics of either partner in the couple between
two consecutive episodes, but instead identified a “negative spell” in
employment characteristics. The negative spell could last throughout a
sequence of BHPS waves until a positive change happens in the
employment characteristics of either partner in the couple (i.e., they
return to employment or their socio‐economic status increases).
The changes in the employment characteristics of respondents
and their partners are summarised in Table 4.
A share of spells when a negative change happens in economic
activ-ity status is 6% and 3.5% for men and their partners, respectively. The
overall share of negative employment spells is 19% and 10% respectively
for women and their partners. The average length of a negative spell in
employment status is approximately 3 years for both men and women.
Negative changes in socio‐economic status are more frequent than
negative changes in economic activity. For women, the share of
epi-sodes during which negative socio‐economic status changes happened
and persisted was 17%, whereas for their partners it was 18%. Overall,
the share of such“negative spells”is 36% both for men and for women
[image:11.595.94.498.40.387.2](with the average length of the negative spell being 2 years).
Table 5 offers some insight into the relationships between gender,
negative changes in the employment status, and occupational
charac-teristics of the partners in a couple and migration events. It shows that
female migrants have a higher share of negative spells in their
eco-nomic activity, that is, female migrants tend to spend longer periods
of time being unemployed or economically inactive than females that
do not move spatially. Both migrant males and migrant females are
more likely to have longer share of negative spells in their
socio‐economic status than nonmigrant males and female. However,
the female migrants are more likely to experience negative changes
in their socio‐economic status than the male migrants. The
relation-ship between migration and negative changes in the employment
characteristics/socio‐economic status of the partners in a couple are
statistically significant both for the female and the male partners.
Figure 3 plots the estimates of union survival between couples
who did and did not experience negative changes in employment
[image:11.595.302.497.46.209.2]those unions where partners were not affected by negative changes in
employment characteristics and (b) negative changes in the
employ-ment characteristics of male partners have a stronger adverse impact
on union survival rates. We also examined the union survival rates
of spatially mobile couples who experienced negative changes in
employment in relation to reasons for migration. We found that
cou-ples who moved for accommodation‐related reasons, and where
females subsequently experienced negative changes in their
employ-ment status, had the lowest survival rates.
4.8
|Modelling the relationship between family
migration and union dissolution
We report the results of four Cox proportional hazard regression
models. For each independent variable odds ratios and robust
standard errors are presented. Model 1 includes only migration‐
related independent variables. As shown in Table 6 (column 1), there
is a lower risk of union dissolution for geographically mobile couples
who moved within 30 miles, and for couples who moved 5 or more
years ago. Those who migrated more than once are at higher risk of
union dissolution, with every subsequent move increasing this risk.
Reasons for migration that are accommodation‐related or job‐related
and stated by both partners are associated with lower risks of union
dissolution, whereas migration for job‐related reasons stated by only
one of the partners is associated with a higher union dissolution rate,
although none of the corresponding odd ratio estimates are
statisti-cally significant. Couples who moved for any reason other than job
or accommodation are at lower risk of union dissolution. Interestingly,
the latter variable also interacts with time (the BHPS waves); that is, it
has a statistically significant coefficient for its time‐varying
compo-nent. The coefficient of the time‐variant component is greater than
one, which means that, although the risk of union dissolution is low
for couples soon after migration for other than job‐or
accommoda-tion‐related reasons, this risk increases, and the survival rates of
unions decline over time.
Descriptive statistics presented in the previous sections
indi-cate that, among those who moved over long distances (more than
30 miles), a job‐related reason for migration is more common than
among those who moved a shorter distance (see Table 3). We
estimated a variant of Model 1 (Table 6 column 1) that included
a set of interactions between reasons for migration and distance
of move. None of these interaction terms was statistically
significant.4
Model 2 (Table 6 column 2) includes both migration variables and
measures of the socio‐demographic characteristics of the female
respon-dents and their partners, as well as the variables describing the union.
4
[image:12.595.45.558.58.261.2]Available from authors on request.
TABLE 4 Changes in couple's employment characteristics during the life course of the union
% (number) of spells when negative change in the employment characteristics between two consecutive episodes happened
% (number) of spells when negative change in the employment characteristics between two consecutive episodes once happened, sustained (before improving)
Average number of consecutive‘negative’spells Negative changes in main economic activities (i.e., from employment to unemployment or economic inactivity): female
No negative changes 94% (22754) 81% (19582)
Yes 6% (1412) 19% (4584) 3.2
Negative changes in main economic activities (i.e., from employment to unemployment or economic inactivity): male
96.5% (23322) 90% (21642)
3.5% (844) 10% (2524) 3.0
Negative changes in socio‐economic status (decreases in CSS): female
No negative changes 83.3% (20130) 64% (15575)
Yes 16.7% (4036) 36% (8591) 2.12
Negative changes in socio‐economic status (decrease in CSS): spouse
No negative changes 81.7% (19747) 62% (15000)
Yes 18.3% (4419) 38% (9166) 2.07
TABLE 5 Changes in employment characteristics/socio‐economic status of couples by migration status
Not migrants (%) Migrants (%) Total Main economic activity
Female No negative change 84 77 19,582 Chi2 = 151p= 0.000
Negative change 16 23 4,584
Spouse No negative change 89 90 21,642 Chi2 = 11p= 0.001
Negative change 11 10 2,524
Cambridge Scale Scores (CSS)
Female No negative change 67 61 15,575 Chi2 = 70p= 0.000
Negative change 33 39 8,591
Spouse No negative change 63 60 15,000 Chi2 = 25p= 0.000
[image:12.595.44.552.296.427.2]This second model is a dramatic improvement on Model 1 (Wald Chi2‐s
are 51.1 and 274.7 for Model 1 and Model 2, respectively). This shows
that characteristics of the male and the female partners and their union
characteristics are far more important for the union stability than the
geographic mobility. Union type, union duration, and age of children
are all significant factors. Married couples have significantly lower rates
of union dissolution than cohabitating couples. The risk of union
dissolution decreases with the length of the union. Those who have
chil-dren are at higher risk of union dissolution, and this risk increases with
the age of the youngest child. If the female partner is more educated, this
reduces the odds of union dissolution and couples where the woman has
a degree‐level qualification show greater union stability.
Whether the female is working or is economically inactive or
[image:13.595.91.483.51.389.2]TABLE 6 Cox proportionate hazard discrete time regression (exponentiated coefficients, robust standard errors [rse] in parentheses)
Odds ratios (rse) Odds ratios (rse) Odds ratios (rse) Odds ratios (rse)
Main Model 1(_t) Model 2 (_t) Model 3 (_t) Model 4 (_t)
Migration variables Model 1 + Socio‐ demographic characteristics
Model 2 + Changes in employment characteristics
Model 2 + Changes in employment characteristics after migrationa
Distance of move
under 30 miles 0.96* (.01) 0.97* (.01) 0.97* (.01) 0.97* (.01)
30 miles of more 1.00 (.00) 1.00* (.00) 1.00* (.00) 1.00 (.00)
Time since the last move
first 12 months 1.00 (.55) 0.91 (.35) 1.06 (.40) 1.05 (.50)
13–60 months 1.00 (.00) 1.01** (.00) 1.01* (.00) 1.01* (.00)
more than 60 months 0.99** (.01) 0.99** (.01) 0.99 (.00) 0.99 (.00)
Reasons for move
Not job/accommodation‐related 0.59 (.27) 0.25** (.12) 0.23** (.11) 0.22** (.11)
Accommodation‐related 1.07 (.46) 0.72 (.30) 0.65 (.26) 0.63 (.26)
One partner stated job‐related 1.80 (1.09) 1.21 (.66) 0.93 (.44) 0.93 (.45)
Both partners stated job‐related 0.88 (.50) 0.82 (.47) 0.67 (.36) 0.68 (.37)
Total number of moves 1.14** (.69) 1.25** (.10) 1.19* (.01) 1.21* (.09)
Type of union: marriage 0.39*** (.06) 0.36*** (.05) 0.36*** (.05)
Female older than male 0.98 (.12) 0.99 (.12) 1.01 (.12)
Female's age at the start of the union 1.01 (.01) 1.00 (.01) 1.00 (.01)
Female White British 1.56 (.52) 1.31 (.42) 1.32 (.43)
Partner White British 0.44 (.19) 0.52 (.18) 0.55 (.24)
Partner has traditional gender attitudes 1.06 (.19) 1.08 (.18) 1.08 (.18)
Female is member of a religious group 0.90 (.22) 0.84 (.21) 0.84 (.21)
Length of the union 0.99*** (.00) 0.99*** (.00) 0.99*** (.00)
Number of children 1.04 (.07) 1.09 (.08) 1.09 (.07)
Age of the youngest child (ref. group: no children under 18)
Child's age under 5 1.62* (.37) 1.29 (.29) 1.27 (.29)
Child's age 5–10 1.91** (.42) 1.68* (.37) 1.65* (.37)
Child's age 10–15 1.83** (.40) 1.69* (.37) 1.66* (.36)
Child's age 15–18 2.22** (.56) 2.07** (.51) 2.00** (.50)
Female has degree‐level qualifications 0.55** (.12) 0.49** (.11) 0.51** (.11)
Main economic activity (ref. group: employed)
Female unemployed 1.15 (.42) 1.12 (.43) 1.13 (.43)
Female inactive 0.98 (.16) 0.84 (.18) 0.84 (.18)
Partner unemployed 1.39 (.37) 0.99 (.32) 0.99 (.32)
Partner inactive 1.71** (.33) 0.89 (.30) 0.89 (.31)
Female's CSS 1.00 (.00) 1.01 (.00) 1.01 (.01)
Partner's CSS 1.01* (.00) 1.01*** (.00) 1.02*** (.00)
Negative changes in CSS and main economic activities
Female's economic status worsens (until improved)
1.46 (.35) 2.02* (.59)
Partner's economic status worsens (until improved)
2.74** (.95) 2.39* (.94)
Female's CSS worsens (until improved) 1.63** (.24) 1.63** (.25)
Partner's CSS worsens (until improved) 5.46*** (1.69) 5.34*** (1.65)
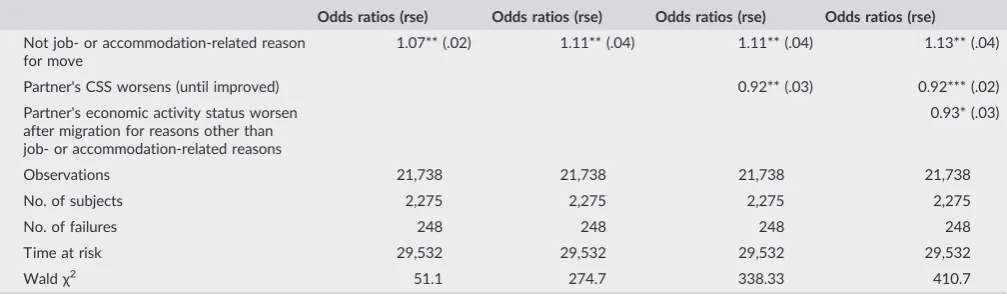
Female's economic activity status worsens after migration (until improved)
0.56+(.16)
Partner's economic activity status worsens after migration (until improved)
2.02+(.75)
Time‐varying components


![TABLE 6Cox proportionate hazard discrete time regression (exponentiated coefficients, robust standard errors [rse] in parentheses)](https://thumb-us.123doks.com/thumbv2/123dok_us/8981569.393229/14.595.48.549.57.727/table-proportionate-discrete-regression-exponentiated-coefficients-standard-parentheses.webp)