arXiv:1711.00178v1 [astro-ph.GA] 1 Nov 2017
SDSS-IV MaNGA: Constraints on the Conditions for Star
Formation in Galaxy Discs
David V. Stark
1†
, Kevin A. Bundy
2
, Matthew E. Orr
3
, Philip F. Hopkins
3
,
Kyle Westfall
2
, Matthew Bershady
4
, Cheng Li
5
,
6
, Dmitry Bizyaev
7
,
8
,
9
,
Karen L. Masters
10
, Anne-Marie Weijmans
11
, Ivan Lacerna
12
,
13
,
14
, Daniel Thomas
10
,
Niv Drory
15
, Renbin Yan
16
, and Kai Zhang
16
1Kavli IPMU (WPI), UTIAS, The University of Tokyo, Kashiwa, Chiba 277-8583, Japan
2UCO/Lick Observatory, University of California, Santa Cruz, 1156 High St. Santa Cruz, CA 95064, USA 3TAPIR, 1200 E. California Blvd., California Institute of Technology, Pasadena, CA 91125, USA
4University of Wisconsin-Madison, Department of Astronomy, 475 N. Charter Street, Madison, WI 53706-1582, USA 5Physics Department and Tsinghua centre for Astrophysics, Tsinghua University, Beijing 100084, China
6Shanghai Astronomical Observatory, Nandan Road 80, Shanghai 200030, China
7Apache Point Observatory and New Mexico State University, PO Box 59, Sunspot, NM 88349-0059, USA 8Sternberg Astronomical Institute, Moscow State University, 119992 Moscow, Russia
9Special Astrophysical Observatory of the Russian AS, 369167, Nizhnij Arkhyz, Russia
10Institute of Cosmology and Gravitation, University of Portsmouth, Dennis Sciama Building, Portsmouth PO1 3FX, UK 11School of Physics and Astronomy, University of St Andrews, North Haugh, St Andrews KY16 9SS, UK
12Instituto Milenio de Astrof´ısica, Av. Vicu˜na Mackenna 4860, Macul, Santiago, Chile 13Instituto de Astrof´ısica, Pontificia Universidad Cat´olica de Chile, Santiago, Chile
14Astrophysical Research Consortium, Physics/Astronomy Building, Rm C319, 3910 15th Avenue NE, Seattle, WA 98195, USA 15McDonald Observatory, The University of Texas at Austin, 2515 Speedway, Stop C1402, Austin, TX 78712, USA
16Department of Physics and Astronomy, University of Kentucky, 505 Rose Street, Lexington, KY 40506-0055, USA
†david.stark@ipmu.jp
Accepted 2017 October 30. Received 2017 October 9; in original form 2017 July 27
ABSTRACT
Regions of disc galaxies with widespread star formation tend to be both gravitation-ally unstable and self-shielded against ionizing radiation, whereas extended outer discs with little or no star formation tend to be stable and unshielded on average. We ex-plore what drives the transition between these two regimes, specifically whether discs first meet the conditions for self-shielding (parameterized by dust optical depth, τ) or gravitational instability (parameterized by a modified version of Toomre’s instabil-ity parameters,Qthermal, which quantifies the stability of a gas disc that is thermally
supported at T =104 K). We first introduce a new metric formed by the product of
these quantities,Qthermalτ, which indicates whether the conditions for disk instability
or self-shielding are easier to meet in a given region of a galaxy, and we discuss how Qthermalτ can be constrained even in the absence of direct gas information. We then
analyse a sample of 13 galaxies with resolved gas measurements and find that on aver-age galaxies will reach the threshold for disk instabilities (Qthermal <1) before reaching
the threshold for self-shielding (τ >1). Using integral field spectroscopic observations of a sample of 236 galaxies from the MaNGA survey, we find that the value ofQthermalτ
in star-forming discs is consistent with similar behavior. These results support a sce-nario where disc fragmentation and collapse occurs before self-shielding, suggesting that gravitational instabilities are the primary condition for widespread star forma-tion in galaxy discs. Our results support similar conclusions based on recent galaxy simulations.
Key words: galaxies: star formation
1 INTRODUCTION
Star formation can only proceed within galaxies when cer-tain conditions are met. For decades, several physical models for star formation have been proposed and debated, typically relating the star formation rate (SFR) to specific proper-ties of the interstellar medium (ISM) such as gas surface density, metallicity, dynamics, or some combination thereof. The most popular star formation relation was introduced by
Schmidt(1959) who argued that the local surface density of star formation,ΣSFR, is related to the local surface density of gas, Σg, by the power law ΣSFR∝ΣgN. Kennicutt(1998)
showed that globally averaged values ofΣg andΣSFRfollow
such a relation over several orders of magnitude. A simi-lar correlation is found on sub-kpc scales (Bigiel et al. 2008) with an additional dependence on the local dust-to-gas ratio (Leroy et al. 2013). At gas densities below Σg ∼10 M⊙pc−2
the power law relation breaks down, but it can be recovered if one isolates only the denser molecular gas in regions which are on-average low density (Schruba et al. 2011), consistent with a picture where ΣSFR is most directly correlated with
the denser molecular gas surface density,ΣH2.
Under the assumption that ΣSFR ∝ ΣH2, several au-thors have formulated star formation laws based around conditions of the ISM that govern its molecular frac-tion. Elmegreen (1989) introduced a relationship between molecular fraction and hydrostatic midplane pressure (see also Elmegreen & Parravano 1994, Wong & Blitz 2002,
Blitz & Rosolowsky 2004,Blitz & Rosolowsky 2006). Alter-native models assume H2formation is regulated by local gas
density and metallicity (or dust-to-gas ratio, assumed to fol-low a 1:1 relation with metallicity), the combination of which determine the ability for gas to shield itself from background ionizing radiation, at which point it can cool, condense, and form stars (Schaye 2004; Krumholz et al. 2009; Krumholz 2012). A common theme of these prescriptions is that star formation is regulated by the local conditions of the ISM, and in principle the relevant physics should not vary from galaxy to galaxy.
However, several studies have suggested that the larger-scale dynamical properties of galaxies play a major role in regulating star formation. In such models, the poten-tial for dense clouds to form is set by the competition between the self-gravity of the disc and some combina-tion of gas dispersion, Coriolis forces, cloud collision rate, and shear (Safronov 1960; Toomre 1964; Jog & Solomon 1984; Romeo 1992; Wang & Silk 1994; Hunter et al. 1998;
Tan 2000; Rafikov 2001; Elmegreen 2011). Prescriptions which relate ΣSFR to dynamical properties (or dynamical
timescales) are able to fit both regular star-forming galaxies and starbursts on a single relation, which has been a struggle for laws which relate star formation and gas density alone (Daddi et al. 2010;Genzel et al. 2010;Utreras et al. 2016). Additional support for the relevance of dynamical prop-erties comes from observations of “star formation thresh-olds,” rapid drops in theΣSFRat the presumed radius where
discs stabilize (Kennicutt 1989; Martin & Kennicutt 2001) according to theQ parameter of Toomre(1964). However, these interpretations have been challenged by commonly ob-served (although typically weak) star formation at radii be-yond these “thresholds”. In particular, studies that trace star formation using UV continuum find much less extreme
ra-dial declines in star formation compared to studies which use Hαemission (Ferguson et al. 1998;Ryan-Weber et al. 2004;
Gil de Paz et al. 2005; Boissier et al. 2007; Thilker et al. 2007;Werk et al. 2010;Christlein et al. 2010;Hunter et al. 2010;Lemonias et al. 2011;Moffett et al. 2012). One physi-cal explanation for the observed difference between Hαand UV profiles is that SFR has dropped low enough in outer discs that there are simply too few massive, short lived O stars to generate Hα emission, whereas the UV emission is more visible because it is sensitive to slightly less mas-sive, longer lived B stars (Boissier et al. 2007). None the less, studies have found that star formation efficiency, or SFE (here defined asSFE=ΣSFR/Σg) is significantly lower (by a factor of∼10) in extended outer discs compared to inner discs (Kennicutt 1989; Zasov & Bizyaev 1994; Bigiel et al. 2010a). It is possible that although star formation can oc-cur at large radii in the presence of localized overdensi-ties – due to e.g., tidal interactions, spiral density waves, and/or cold accretion (Thilker et al. 2007;Bush et al. 2008;
Roˇskar et al. 2010) – outer discs are on-average dynamically stable against fragmentation, explaining their extremely low SFE.
Many of the proposed models for star formation are at least partially valid because they relate the conditions of the ISM to the presence and/or rate of star formation. Never-theless, it is still debated which physical prescription best describes the underlying conditions that eventually lead to widespread star formation in galaxies. As an alternative way of posing this question, let us consider radial annuli within a galaxy. At some large radius the gas in an annulus will be dynamically stable (likely supported by thermal gas pressure
atT &104K) and not self-shielded against the background
UV field. Presumably, this annulus will have no star forma-tion, or at least extremely low efficiency of star formation (as mentioned above, density fluctuations may drive local-ized star formation, but in an annulus-averaged sense, the disc is not conducive to star formation). Conversely, at some smaller radius, the disc will be unable to resist fragmenta-tion, will be shielded against background radiafragmenta-tion, and will be forming stars.What defines this transition?As we move from large to small radius, do annuli first become unsta-ble and fragment, only after which the gas self-shields? Or, does the gas reach its self-shielding threshold first, only after which instabilities and fragmentation can occur?
Multiple studies have attempted to address this ques-tion, with differing results. Work by Schaye (2004) and
Krumholz et al.(2009) suggest that instability occurs only after a cold ISM phase develops which lowers the gas ve-locity dispersion. In these models, star formation is tied to the dust optical depth, τ, which determines the abil-ity of gas to self-shield. In contrast, Orr et al. (2017) ex-amine the FIRE simulations (Hopkins et al. 2014) and find that star formation is prevalent throughout regions which are not self-shielded on average. Instead, the onset of vig-orous star formation (ΣSFR > 10−3M⊙yr−1kpc−2) occurs
very close to where galaxies cross the threshold where discs can no longer support themselves through thermal gas pres-sure (Qthermal .1), which occurs well before they cross the
threshold for self-shielding. In fact, additional tests where
where onlyself-shielded gas can form stars yield almost no star formation beyond∼1/3Re(whereReis the half-light
ra-dius), in significant disagreement with the full physics runs. The discrepancies between different studies highlight the need for observational studies to constrain which of these theoretical pictures is correct.
We use two independent data sets to observationally constrain the link between star formation, disc stability (Qthermal), and dust optical depth (τ). The first data set, drawn from the compilation of Leroy et al.(2008), is com-posed of a small sample of nearby galaxies with high qual-ity measurements of gas content. The second sample is drawn from the significantly larger and more representative MaNGA survey (Bundy et al. 2015), but lacks estimates of gas surface density needed to estimate τ and Qthermal
di-rectly. However, we describe how the product of these two parameters, Qthermalτ, can be used to distinguish whether
the conditions for self-shielding or gravitational instability will be met first, and can be constrained without direct gas measurements. Thus, we address the science questions of this paper from two different angles with data sets that each have their respective strengths and weaknesses.
In Section2we describe the parameters used to quantify the conditions of the ISM and how these parameters are used to test different physical models of the onset of star formation in galaxies. In Section3, we describe the data sets used in this study. Our results are presented in Section4, and in Section5we give a more detailed discussion of important systematic errors and the implications of our findings. Our conclusions are presented in Section6.
2 METHODOLOGY
2.1 τ andQthermal
We consider two key parameters to characterize the average conditions of the ISM. The first parameter isτ, a proxy for dust optical depth:
τ= ΣgZ
′
ΣgZ′ss
(1)
where Σg is the gas surface density, Z′ is the
gas-phase metallicity relative to solar, and ΣgZ′ss represents
the dust surface density above which the ISM is self-shielded and H2 dominated (ΣH2/Σg > 0.5) in the pres-ence of an isotropic background ionizing field. The spe-cific value of ΣgZ′ss depends on metallicity and is
cal-culated using Eq. 45 of Krumholz et al. (2009). For so-lar metallicity gas, ΣgZ′ss=27M⊙pc−2 and varies from
18−36M⊙pc−2 betweenZ′=0.1−3. Previous implementa-tions of theKrumholz et al.(2009) model have employed a clumping factor to account for unresolved individual clouds. However, as we are interested in theaverageability an an-nulus to self-shield, we include no such factor.
The second parameter used to characterize the ISM is a modified version of the Toomre(1964) Q parameter and indicates the ability of the disc to support itself against frag-mentation through Coriolis forces andthermalgas pressure:
Qg,thermal = κcs πGΣg
(2)
whereκis the epicyclic frequency andcsis the characteristic
sound speed of104Kgas (13 km s−1)
Qg,thermal is not the same asQ commonly measured in
cold gas.Qg,thermal quantifies the ability of the disc to sta-bilize itself explicitly viathermalgas pressure assuming all the gas hasT =104K, which characterizes the typical con-ditions in the non-star forming outer gas disc. We expect that regions withQg,thermal<1will fragment and form stars,
which in reality can generate other forms of support (e.g., turbulence) through gravitational instabilities and feedback that drive the observed Q back towards ∼1 even though
Qthermal<1. However, the fact that such regions are
experi-encing non-thermal means of support, which either lead to star formation or result from it, suggests that they have en-tered a “star-forming” regime. Therefore,Qg,thermal is a
con-servative indicator of the ability of a gaseous annulus to resist fragmentation, while also capturing the relevant con-ditions of the outer gas disc.
The presence of a significant stellar component will con-tribute to the overall stability of the disc and must be taken into account. The stellar disc stability is defined as
Q∗= κσ∗
πGΣ∗ (3)
where σ∗ is the radial stellar velocity dispersion and Σ∗ is
the disc stellar surface density. The overall stability of the two-component disc, Qthermal can then be approximated as (Wang & Silk 1994)
Qthermal=
1
Qg,thermal + 1
Q∗
−1
(4)
Although we have chosenQthermalas our indicator of disc
stability, it is not the only proposed means to describe the threshold for gravitational instability.Hunter et al. (1998) proposed a scenario in which the formation of dense clouds is regulated by competition with shear. Their formalism primarily affects inner regions of galaxies with rising ro-tation curves, whereas our study will be focused on larger radii where rotation curves are typically flat, in which case the shear-regulated threshold reduces to approximately the same form asQthermal.
2.2 The Onset of Widespread Star Formation and Qthermalτ
We consider two basic scenarios that describe the transition between non/weakly star-forming outer discs to vigorously star-forming inner regions of galaxies. This simple picture assumes that at some large radius, the gas disc is gravita-tionally stable from thermal pressure (Qthermal>1) and un-shielded (τ <1), while the centre is gravitationally unstable (Qthermal <1) and self-shielded (τ > 1). The two scenarios
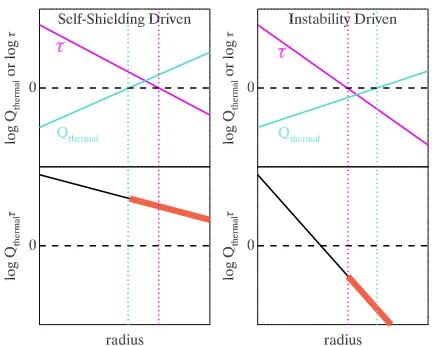
differ in their assumptions about whether self-shielding or disc instabilities determine the onset of widespread star for-mation in galaxy discs as we move from large to small radius, which is essentially a question of which threshold for star for-mation is met first. These two scenarios are illustrated in the top row of Fig.1.
(i) Self shielding-driven: disc instabilities and frag-mentation occur after self-shielding (e.g., Schaye 2004,
Figure 1.Schematic models illustrating the radial behavior of Qthermal andτ (top panels), andQthermalτ (bottom panels) under two different scenarios to describe the onset of widespread star formation in galaxy discs. The horizontal dashed line indicates the threshold for star formation, and the vertical dotted lines indicate where each parameter crosses this threshold. The thick red line in the bottom panels highlight the region in the outer disc whereQthermalτcan be used to discriminate the two scenarios. Even in regions where neither threshold has been crossed (e.g., at very large radius in both models),Qthermalτ still indicates which threshold will be crossed first if the gas density is increased.
the threshold for self-shielding beforeit crosses the thresh-old for disc instabilities. Therefore, as we move from large to small radius, we will encounter annuli that are on-average self-shielded (τ >1) but still gravitationally unstable (Qthermal >1).
(ii) Fragmentation-driven: disc instabilities occur before
self-shielding (e.g., Orr et al. 2017). In this scenario, the threshold for gravitational instability from thermal support is crossed before the threshold for self-shielding. Therefore, as we move from large to small radius, we will encounter annuli with that are on-average gravitationally unstable (Qthermal <1) but not yet self-shielded (τ <1).
Note that under the second scenario whereQthermal<1
andτ <1, we are not implying that anylocalizedstar
form-ing regions are unshielded. Instead, they are almost defi-nitely self-shielded, but since self-shielding occurs after disc fragmentation, the point at which the disc on-average has
τ >1lags behind the point at which the discon-averagehas
Qthermal<1.
Both τ and Qthermal depend onΣg, which is often
un-known. However, we argue that the product,Qthermalτ can
provide useful constraints on whether fragmentation or disc opacity are the underlying driver of widespread star forma-tion in galaxy discs, and this product can be constrained even in the absence of direct gas estimates.
For sufficiently gas-dominated regions of galaxies where Σg ≫ Σ∗, we can approximate Qthermal ∼Qg,thermal. In the
product,Qthermalτ, theΣgterms cancel yielding the following
functional form
Qthermalτ≤ κcsZ
′
πG ΣgZ′ss
(5)
The above formula is written as an upper limit because the inclusion of any stellar component will typically lead to a lower value forQthermalτ.
Although we would ideally compare independent mea-sures ofQthermalandτagainst one another, we can still place
constraints onQthermalτ without such information. To
illus-trate the utility ofQthermalτfurther, we revisit the two basic scenarios shown in Fig.1:
(i) Self shielding-driven:This scenario is characterized by the presence of annuli which are on-average self-shielded (τ >1) but not gravitationally unstable (Qthermal>1). These annuli will haveQthermalτ >1.
(ii) Fragmentation-driven: This scenario is characterized by the presence of annuli which are on-average gravitation-ally unstable (Qthermal > 1) but not self-shielded (τ < 1).
These annuli will haveQthermalτ <1.
The behavior ofQthermalτ is illustrated in the bottom
pan-els of Fig.1. The key difference between these scenarios is whether Qthermalτ is greater than or less than unity in the
outer discs of galaxies. Formally,Qthermalτmeasures whether Qthermalorτis closest to its relevant threshold, but does not imply either threshold is currently met. In the case where neither threshold is satisfied (e.g., at the largest radii in Fig.1),Qthermalτindicates which threshold would be easier
to reach if the gas surface density were larger. In this sense,
Qthermalτ allows us to “roll back the clock” in annuli where
star formation is occurring but neither threshold is currently satisfied; we can infer which threshold is more likely to have been reached first to initiate star formation in the past.
We must be cautious when interpreting Qthermalτ at small radii.Qthermalτ is informative at and beyond the
re-gion where one threshold has been reached, but the other has not. For example, in Fig.1 Qthermalτ > 1for both the
self-shielding and instability-driven models at small radius. For this reason, we will focus our analysis on the value of
Qthermalτ at large radii (typically>1.5Re).
Throughout this work, we define
ΣSFR>10−3M⊙yr−1kpc−2 as the boundary between
regions with widespread star formation and those with weak/no star formation. This specific value has little physical significance. Although it roughly corresponds to the typical value whereΣSFR profiles tend to more rapidly
decline (star formation “thresholds”), such behavior may simply reflect the failure of Hαemission as a star formation tracer at low surface brightness. We largely highlight 10−3M⊙yr−1kpc−2 to facilitate comparison with Orr et al.
(2017), who use the same value to separate star-forming and non-star forming annuli. The key results of this paper are not explicitly tied to this value ofΣSFR.
ChoosingΣSFR=10−3M⊙yr−1kpc−2 as the definition of
“star forming” annuli also essentially guarantees that star formation is present in annuli which are currently not self-shielded on average. Our definition of self-self-shielded corre-sponds to ΣH2/ΣHI ∼ 1, which is expected in gas densi-ties of ∼27M⊙pc−2 (Krumholz et al. 2009), and these gas
densities typically correspond toΣSFR∼10−2M⊙yr−1kpc−2
[image:4.595.50.267.113.286.2]start of star formation rather than at the present, and as dis-cussed above,Qthermalτallows us to consider which threshold would have been easier to reach first.
3 DATA AND DERIVED QUANTITIES
We employ two independent data sets for our analysis. The first, drawn fromLeroy et al.(2008, hereafter L08) contains direct measurements of gas surface density for a small subset of nearby galaxies. The second, drawn from the MaNGA survey, lacks direct estimates of gas surface density but is significantly larger and more representative of the galaxy population. In the following section, we discuss these data sets and derived quantities.
3.1 The Leroy et al.(2008, L08) sample
To compose a sample of galaxies with resolved gas data, we use the compilation from Leroy et al. (2008) who combine data from the SINGS (Kennicutt et al. 2003), THINGS (Walter et al. 2008), HERACLES (Leroy et al. 2009), BIMA SONG (Helfer et al. 2003), and GALEX NGS (Gil de Paz et al. 2007) surveys to create radial surface den-sity profiles ofH i, H2, stellar mass, and SFR with sub-kpc
radial spacing for 23 nearby galaxies. We refer the reader to
Leroy et al.(2008) for more specific details about the calcu-lation of these profiles.
3.1.1 Kinematics
Rotation velocities,vrot, were derived from THINGS velocity
fields. Leroy et al. (2008) provide fits to these data of the form vrot = vflat
h
1−e−r/lflat
i
. We use the analytical fits to estimateκas a function of radius.
Stellar velocity dispersions,σ∗are not readily available
for the L08 sample, so we estimate them indirectly assuming
σ∗=
q
πG Σg+Σ∗z0 (6)
where z0 is the disc vertical scale parameter for a disc whose density decreases with height z above the midplane as sech2(z/z0) (van der Kruit & Searle 1981). We estimate
z0 using the median ratio of disc scale length (h) to scale
height in the SDSSr-band,h/z0=3.4(Bizyaev et al. 2014). The disc scale lengths are taken from the exponential fits to stellar discs given by L08. Note that our estimates ofσ∗may
be poor at small radius where the bulge component becomes important.
3.1.2 Gas Phase Metallicity
Gas-phase metallicities are taken from Moustakas et al.
(2010) who compile metallicities of individual H ii re-gions in galaxies from the SINGS sample. This compila-tion provides two different estimates of metallicity using the calibrations ofKobulnicky & Kewley(2004) (KK04) and
Pilyugin & Thuan(2005) (PT05), both of which employ the
R23 parameter (Pagel et al. 1979). Due to the notoriously large systematic errors between different strong-line calibra-tions, we must be cautious when choosing our metallicity estimate and drawing conclusions from it. We opt to use the
KK04 metallicities because of their relatively good agree-ment with the N2O2 calibration we employ for the MaNGA sample (see Section3.2.2); the two calibrations yield mass-metallicity relationships with similar slopes and systematic offsets no larger than 0.1 dex (Kewley & Ellison 2008). The impact of systematic errors in metallicity estimates is dis-cussed further in Section4.
Since theMoustakas et al.(2010) compilation provides metallicities for individualH ii regions, it does not always evenly sample the metallicity profile at all radii. Therefore, to estimate gas-phase metallicity as a function of radius, we fit linear functions to theH iiregion metallicities (12+ log O/H) as a function of radius for each galaxy. We require at least 5 data points for our linear fits.
3.1.3 Sample Selection
We limit our sample to galaxies with stellar masses above
M∗ = 109M⊙ to match the approximate minimum stellar
mass of MaNGA. After removing any additional galaxies with insufficient metallicity information, we are left with 13 galaxies in our final sample.
3.2 MaNGA Data
Our second data set comes from the SDSS-IV
MaNGA survey (Bundy et al. 2015; Drory et al. 2015;
Law et al. 2015; Yan et al. 2016b,a; Law et al. 2016;
SDSS Collaboration et al. 2016; Blanton et al. 2017), an integral field unit (IFU) survey of 10,000 z∼0galaxies with
M∗ > 109M⊙. This survey uses the SDSS 2.5m telescope
(Gunn et al. 2006) and BOSS spectrographs (Smee et al. 2013), with a wavelength coverage of 3500–10000 ˚A, spectral resolution R ∼ 2000 (instrumental resolution ∼60 km s−1), and an effective spatial resolution of 2.5′′ (FWHM) after
combining dithered observations.
3.2.1 Kinematics
Assuming a parametric form for rotation curves, tilted thin-disc models from Andersen & Bershady (2013), which de-termines the best-fitting kinematic geometry (position angle, PA, and inclination,i), are fit to stellar and ionized gas (Hα) kinematic fields from the MaNGA data analysis pipeline. One dimensional profiles sampled every 2.5′′ are extracted using the data within±30◦of the major axis. These profiles are fit with a model of the form vrot(R) =vflattanh(R/hrot),
wherev
flatand hrotare free parameters, in order to estimate κ. Although this formula is different from that employed by
Leroy et al.(2008), the two have a very similar shape and we do not expect this difference to impact our results.
Our analysis is limited to disc galaxies that are “kine-matically regular,” defined by similar kinematic geome-tries for the stars and gas and disc inclinations consistent with photometric estimates based on the NASA Sloan At-las (NSA)1. The kinematic modeling process is further de-scribed in K. Westfall et al. (in prep).
Although MaNGA technically measures stellar velocity dispersions, the expected values are∼30 km s−1 in the outer
discs of galaxies (e.g. Bottema 1993; Shapiro et al. 2003;
Martinsson et al. 2013), well below the MaNGA’s velocity resolution of∼60 km s−1. Therefore, we again indirectly es-timateσ∗using Eq.6. Disc scale lengths are taken from the
bulge-disc decompositions ofSimard et al.(2011).
3.2.2 Gas-Phase Metallicities
Two different strong-line calibrations are used to esti-mate gas-phase metallicity. The first, N2O2, uses the [N ii]λ6584/[O ii]λ3727 flux ratio and is based on photo-ionization models (Kewley & Dopita 2002). It is relatively insensitive to the ionization parameter and diffuse interstel-lar gas (Zhang et al. 2017). The second method, O3N2, uses the [O iii]λ5007/Hβand [N ii]/Hαflux ratios (Marino et al. 2013), and while more sensitive to ionization and diffuse interstellar gas, it is calibrated directly from observations using electron temperature (i.e., the “direct” method). The N2O2 and O3N2 methods differ on their merits but help-fully bracket the metallicity range of ∼0.4 dex spanned by available calibrations. We assume a solar metallicity of 12+log(O/H)⊙=8.69(Asplund et al. 2009).
All emission line fluxes are corrected for foreground extinction using Schlegel et al. (1998). Internal extinc-tions are estimated from the Balmer decrement assum-ing Hα/Hβ=2.86 (Osterbrock & Ferland 2006). We limit our analysis to regions where the Hα and Hβ flux S/N is larger than 3. All corrections use the extinction curve from
Fitzpatrick(1999) withRV=3.1.
Radial metallicity profiles are extracted for each galaxy using physical radii determined from the kinematic model-ing (see Section3.2.1). Radial bins are spaced by2.5′′along the major axis. The final metallicity in each bin is the me-dian of all spaxels in that bin. We only use spaxels with [O iii]/Hβand [N ii]/Hαin theH iiregion of the Baldwin-Phillips-Terlevich (BPT) diagram (Kewley et al. 2006). We ignore any spaxels flagged as unreliable by the MaNGA data reduction and analysis pipelines (Law et al. 2016, K. West-fall et al. in prep) and only include annuli with at least five usable spaxels.
3.2.3 Stellar Surface Densities
Estimates of Σ∗ come from the Pipe3D analysis pipeline which uses a modified version ofFIT3D, a fitting tool for an-alyzing the properties of stellar populations and ionized gas with moderate resolution optical spectra of galaxies, where linear combinations of SSPs are fit to each spaxel to deter-mine Σ∗. We refer the reader to (S´anchez et al. 2016a) and
(S´anchez et al. 2016b) for further details about the fitting procedure. Radial profiles of Σ∗ are determined using the
average of all spaxels in annuli identical to those used to calculate metallicity profiles.
3.2.4 Sample Selection
Our sample is drawn from data acquired during the first year of normal MaNGA operations (1368 galaxies), roughly equivalent to the SDSS-IV DR132sample. In addition to
[image:6.595.322.534.112.285.2]se-2 http://www.sdss.org/dr13
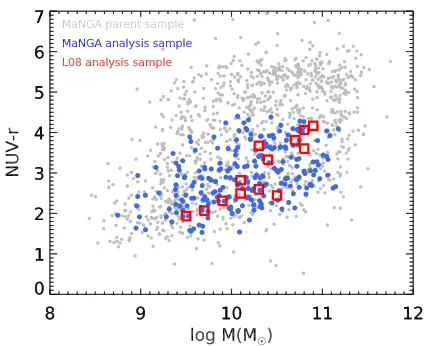
Figure 2.NUV−r vs. M∗ distribution for the parent MaNGA
sample (gray), the subset of 236 MaNGA galaxies incorporated into our analysis (blue), and the 13 galaxies from L08 (red squares).
lecting only “kinematically regular” galaxies (Section3.2.1), we only include galaxies with40◦<i<70◦to further ensure both reliable kinematics and that our analysis focuses on disc material rather than extraplanar gas. We remove any galax-ies where the measured rotation curves have not flattened by the outermost radius so that we can reliably extrapolate to estimatevrot at large radii along minor axes. We reject
galaxies with NUV−r > 4.5 to avoid extremely gas-poor systems (gas-to-stellar mass ratio < 0.05; Catinella et al. 2013), where the NUV and r-band magnitudes are taken from the NSA. Lastly, we remove any galaxies which are ob-vious mergers. Our final sample is composed of 236 galaxies with stellar masses of∼109−11.2M
⊙.
Fig.2shows our final sample in NUV−r vs.M∗ space
in the context of the full MaNGA sample. We also show the position of our sample drawn from Leroy et al. (2008) using photometry taken from Mu˜noz-Mateos et al. (2009) andBrown et al.(2014). In three cases SDSSr-band magni-tudes were not measured directly, in which case we roughly approximated them by interpolating the optical-IR SEDs.
4 RESULTS
With our two independent samples, we investigate the be-havior ofQthermal,τ, andQthermalτin galaxy discs in order to test the self-shielding driven and fragmentation driven star formation scenarios described in Section2.2.
4.1 The L08 Sample
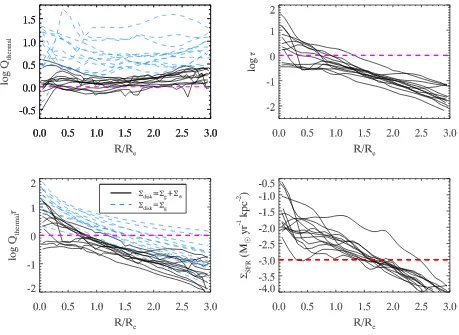
First, we examine the behavior of the L08 sample with direct measurements of gas content. Radial profiles ofQthermal, τ, Qthermalτ, andΣSFRare shown in Fig.3. We also separately
showQthermalandQthermalτfor just the gas components,
Figure 3.Radial profiles ofQthermal,τ,Qthermalτ, andΣSFRfor our sample of 13 galaxies with resolved gas data from L08. Where applicable, the blue dashed lines show the estimates assumingΣ∗is negligible (Eq.5). The radii taken fromLeroy et al.(2008) are normalized by
the optical disc radius,R25. We convert the radii to units ofRefor easier comparison to our MaNGA sample by assumingR25/Re=2.5 (based on radii tabulated inJansen et al. 2000). These data show that discs remain at least borderline unstable while their ability to self-shield drops off much more rapidly. Consistent with the behavior ofτandQthermal,Qthermalτ <1over much of the outer disc.
plottedQthermalτas a function of radius, our primary interest
is the value ofQthermalτin the outer discs of galaxies. While there is a mild trend of decreasingQthermal with
decreasing radius, generally Qthermal ∼1over all radii, sig-naling that the discs are neither drastically stable or unsta-ble. Notably, the gas discs alone would be stable through thermal support alone; it is the addition of the stellar com-ponent that weakens the overall stability of the disc. The ability of the disc to self shield drops off very rapidly with increasing radius, and in some cases never reaches τ > 1. Significant star formation is present in annuli which are not, on average, self-shielded (as previously noted, we still ex-pect any local star forming regions within an annulus to themselves be shielded), but are, on average, borderline un-stable. This behavior is similar to that observed inOrr et al.
(2017), although we find lower values ofQthermalin star form-ing regions. This discrepancy is largely due to our different treatment of the stellar velocity dispersion.Orr et al.(2017) assumeσ∗∼cs, while we estimate values ofσ∗which are 2–3
times larger.
These data can also be used to test the behavior of
Qthermalτ. Qthermalτ drops off rapidly with radius, reaching values<1 by∼Refor all galaxies. These low values support
the “fragmentation-driven” scenario discussed in Section 2. This interpretation is consistent with the behavior ofQthermal
and τ individually; as radius increases, τ continues to de-cline while Qthermal remains ∼ 1, signaling that the outer disc would reach a point of instability well before it reached the threshold for self-shielding.
The τ parameter is not the only means of esti-mating where the disc is H2 dominated. Alternatively, Blitz & Rosolowsky (2006) provide a calibration relating ΣH2/ΣH i to hydrostatic midplane pressure, which is itself a function of gas and stellar surface densities and velocity dis-persions. We explored using this parameter instead ofτ, but find that the threshold whereΣH2/ΣH i=1does not change significantly.
4.2 The MaNGA Sample
Although the L08 sample provides high quality data, it is extremely small and not representative of the full galaxy population. Therefore, we now examine the behavior of the much larger MaNGA sample. We cannot examine Qthermal
andτdirectly with MaNGA, but we can constrainQthermalτ
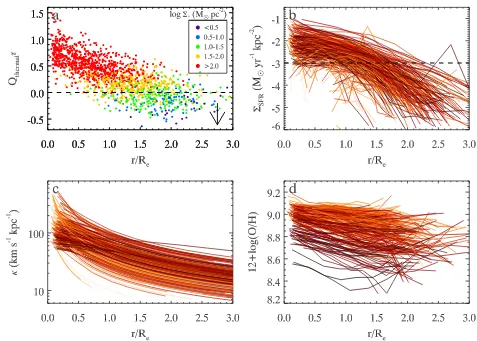
Figure 4.(a)Qthermalτvs. radius normalized byRe, whereQthermalτis approximated with Eq.5. Each point represents one 2.5′′annulus where the N2O2 method is used to estimate Z′. The colours indicate Σ∗ in each annulus. The arrow indicates the average amount
that Qthermalτ would decrease if the O3N2 method was instead used to estimate Z′. (b) Stacked ΣSFRprofiles for our MaNGA sample determined from Hαsurface brightness. (c) Stackedκprofiles for our MaNGA sample determined from ionized gas rotation curves. (d) Stacked12+log O/Hprofiles determined with the N2O2 strong line method. For easier viewing, stacked profiles are colored based on their stellar mass, with lower mass galaxies shown in darker shades.
In Fig.4, we show the radial dependence ofQthermalτ.
Each small point represents one 2.5′′ annulus in a single
galaxy. We also show κ and 12+log O/H, the two
quanti-ties go directly into the calculation of Qthermalτ, as well as ΣSFR, whereΣSFRis estimated from Hαluminosity using the
calibration fromKennicutt & Evans(2012).
Qthermalτapproaches values around∼1 as we move away
from the centres of galaxies, although there is significant scatter. In contrast to the analysis of the L08 sample, a sig-nificant number of galaxies haveQthermalτ >1at large radii. However, recall that unlessΣg≫Σ∗, Eq.5is an upper limit
onQthermalτ. Not accounting for any stellar component can significantly overestimateQthermalτ, as illustrated by the
pro-files with and without the stellar component in Fig. 3. We see evidence for this bias when we examine the behavior of the data in Fig.4as a function ofΣ∗, where at fixed radius,
annuli with lowerΣ∗tend to have lowerQthermalτ. If we limit
our analysis to annuli withΣ∗<101.5M⊙pc−2,Qthermalτ <1
on average. Given that this subset yields more accurate es-timates of Qthermalτ compared to the full sample when
ap-plying Eq.5(assumingΣg makes up a larger fraction of the
disc surface densities in these regions), these data lend
sup-port to the “fragmentation-driven” star formation scenario. In Section 5.1, we revisit the issue of how much Qthermalτ
may be overestimated in the presence of an unaccounted for stellar component.
An additional important systematic error to keep in mind is our choice of strong-line metallicity indicator. The R23and N2O2 methods we use for Fig.3and Fig.4provide
under-estimated,Qthermalτ, which only strengthens our claims that Qthermalτ <1in the outer disks of galaxies.
5 DISCUSSION
Using two independent data sets, we have explored the be-havior of Qthermal, τ, and Qthermalτ within galaxy discs in order to constrain whether they first reach the threshold for self-shielding or gravitational instability in star forming re-gions. In the first data set from L08, we find star formation proceeding in annuli which are borderline unstable but far from self-shielded on average. With our second data set from the MaNGA survey, we find that the mean value on the up-per limitofQthermalτat the edge of discs with widespread star formation is ∼1, but when focusing only on those galaxies with the lowest Σ∗where the upper limits are most robust,
we findQthermalτ <1on average. We begin our discussion of
these results by first exploring the extent to whichQthermalτ
may be overestimated by Eq. 5, and how our results may change when we account for this effect. We finish by dis-cussing the implications our results have for what drives widespread star formation in galaxies.
5.1 Overestimation of Qthermalτ
In Section 4, we discussed howQthermalτ may be overesti-mated in the presence of an ignored stellar component. We now quantify the magnitude of this effect and its impact on our results.
Eq. 5 yields the most accurate estimates of Qthermalτ
when Σg ≫ Σ∗. Within the L08 sample, we find that such
conditions are actually very rare; only a small fraction of galaxies have regions withΣg/Σ∗ >1, and typically only at
r&2 Re. A major caveat is that the L08 sample is not
rep-resentative so we cannot explicitly assume these conclusions hold for all MaNGA galaxies.
However, using all available annuli in the L08 sample, we can get a sense for howΣg/Σ∗varies as a function ofΣ∗.
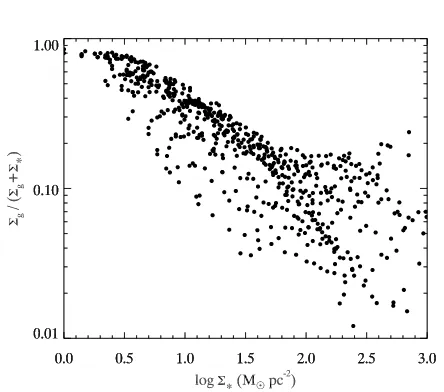
Fig.5plots the distribution of gas fraction fg=Σg/Σg+Σ∗
as a function ofΣ∗from L08 (we use all 23 galaxies from L08
regardless of whether metallicity information is available). There is a wide spread in fg as a function of Σ∗, but there
is a clear upper envelope in the point distribution. Only at very low values of Σ∗ (logΣ∗ . 0.8M⊙pc−2) do gas surface
densities begin to dominate over stellar surface densities. Us-ing of the upper envelope of fg in Fig. 5, we estimate the
maximum possible values of Σg as a function of Σ∗, using
fg values3 of0.8,0.7,0.4,0.2, and 0.2for logΣ∗ regimes of
<0.5, 0.5-1.0, 1.0-1.5, 1.5-2.0, and >2.0M⊙pc−2. These
es-timates are conservative towards instabilities in the sense that the illustrate the minimum relative impact of any stel-lar component on Qthermal while maximizing the potential for self-shielding.
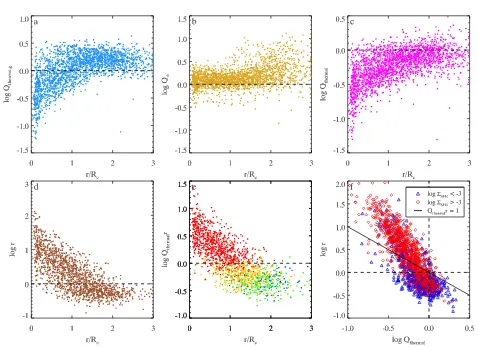
Fig.6shows radial profiles ofQg,thermal,Q∗,Qthermal,τ,
and Qthermalτ using our estimates of Σg. As expected, the
combination of gas and stars has loweredQthermal such that
it largely falls below unity at large radius. Similarly,τ <1at
[image:9.595.315.537.90.286.2]3 These correction factors are judged by eye.
Figure 5.The distribution ofγ=(1+Σ∗/Σ
g)−
1as a function of Σ∗
for all annuli in the sample fromLeroy et al.(2008). This term determines the amount by which Eq.5should be multiplied by in order to obtain the true value ofQthermalτ.
large radius, even though our estimates ofΣgare the
maxi-mum possible values. Additionally,Qthermalτ <1consistently in the outer disc, and the secondary dependence on Σ∗ is
much weaker compared to Fig.4. In summary, this analysis supports the fragmentation-driven scenario by showing that annuli will cross the threshold for gravitational instability before they cross the threshold for self-shielding.
Fig. 6 also shows the distribution of annuli in τ
vs. Qthermal parameter space, which is the observational equivalent to Fig. 8 from Orr et al. (2017) who exam-ine this distribution in the FIRE simulations. Consis-tent with Orr et al. (2017), we find that star forming an-nuli (ΣSFR>10−3M⊙yr−1kpc−2) begin to appear around
Qthermal ∼1and τ <1. Our data do not show the locus on
non-star forming annuli extending into theQthermal>1,τ >1
quadrant shown byOrr et al.(2017), but this is due observa-tional limitations (i.e., we cannot measure rotation velocity or metallicity without the presence of emission lines). Inde-pendent of how we divide star-forming and non-star form-ing annuli, this figure illustrates how the regime withτ >1 andQthermal >1is essentially unpopulated, emphasizing the
point that galaxies appear to first reach gravitational insta-bility and then self-shield, not vice versa.
The above analysis has been done assuming the highest reasonable value of Σg at a given Σ∗. Although this choice
maximizesτ, it biases us towards lowerQthermal. However, Q∗sets an upper limit onQthermal, and we estimateQ∗to be
only slightly above 1. Therefore, any decrease inΣgwill lead
to an increase inQthermal that is much slower than the corre-sponding decrease inτ. Therefore, even with lower estimates forΣg, our discs will still be much closer to the threshold for
gravitational instability than the threshold for self-shielding.
5.2 Implications for Star Formation in Galaxy discs
Through both direct means (via measurements of Qthermal
Figure 6.Properties of our MaNGA sample after approximatingΣgbased on the data in Fig.5and incorporating the stellar component. Panels (a)–(e) show the radial dependence ofQg,thermal,Q∗,Qthermal,τ, andQthermalτ. The color-coding in panel (e) is the same as that of
Fig.4a. Panel (f) shows the distribution of annuli inτ,Qthermalparameter space. This analysis supports our claim that disc will reach the threshold for disc stability before they reach the threshold for self-shielding.
consistent with the existence of widespread star formation in galaxy discs in regions that are on-average not self-shielded, but are unstable (or at least borderline unstable) in the pres-ence of thermal gas support. Regardless of whether or not the discs are formally gravitationally unstable, their distance from the threshold for disc instability is far smaller than their distance from the threshold for self-shielding, indicat-ing that an annulus will first become unstable and fragment before it becomes self-shielded. These data are consistent with a star formation scenario where widespread star for-mation in galaxy discs begins once a disc can no longer thermally support itself, at which point it fragments and triggers the growth of dense clouds which can locally self-shield. Our data are in agreement withOrr et al.(2017) that examines the onset of star formation within the FIRE galaxy simulations.
Our results may appear somewhat at odds with the find-ings ofSchaye(2004) who argue that it is the formation of a molecular phase (even at very low levels) that leads to disc instabilities due to the associated sudden drop in gas temperature. Our findings essentially argue that such a drop in temperature is not a necessary ingredient to obtain disc instabilities; even when the gas is assumed to be104K, the discs are at least borderline unstable. Similar results are seen inOrr et al.(2017) where they find widespread gravitational
collapse and star formation even when gas cooling is turned off. It is important to note thatSchaye(2004) associate this cooling withΣH2/ΣH I ≪ 1and do not argue that the disc is fully self-shielded by when the cooling takes place, and in their models,ΣH2/ΣH I =1occurs at a much smaller radius.
Therefore, our results are not entirely inconsistent with the findings ofSchaye(2004), although we do not require any explicit drop in gas temperature/csto lead to disc
instabil-ities. If such temperature drops do occur, this will lead to lowerQand strengthen our results.
Although this study provides support for gravitational instabilities as the initial trigger that eventually leads to star formation in galaxy discs, we are not making any claims about the local efficiency of star formation once it begins, nor are we dismissing the importance of self-shielding on local scales. We are simply examining the large-scale conditions within galaxies that are conducive to dense cloud formation and widespread star formation. We claim that Qthermal is
the more fundamental condition for star formation on large scales, and this is because the star-forming disc appears to become on-average unstable before it becomes on-average self-shielded. None the less, even in annuli which are on av-erage not self-shielded, self-shielding is undoubtedly instru-mental in local star forming regions.
inef-ficient star formation that occurs in extreme outer discs (Bigiel et al. 2010b). Based on the radial profiles ofQthermal
in Fig.3, we expect the extended regions of galaxies to have
Qthermal >1, consistent with other studies which find outer discs to generally be dynamically stable (Kennicutt 1989;
Martin & Kennicutt 2001). As discussed in Section 1 it is possible for star formation to occur locally in a disc that is on-average stable and unshielded if localized overdensi-ties can be created. Without explicitly arguing what may drive such overdensities, we do note that we measure values of Qthermalτ that continue to decrease below unity at large radius. Even though these discs are neither gravitationally unstable or self-shielded, Qthermalτ < 1 implies that an in-crease in gas density will lead to gravitational instability before self-shielding, so the fragmentation-driven picture of star formation may still apply in the extreme outer disks of galaxies.
6 CONCLUSIONS
We have presented a new analysis on the relative impor-tance of gravitational disc instabilities (parametrized by
Qthermal) and self-shielding (parametrized by τ) to the on-set of star formation in galaxy discs. We consider two basic scenarios for star formation where the primary condition for widespread star formation differs: the “self shielding-driven” model where discs first self-shield themselves against the background UV field and then become unstable and frag-ment, and the “fragmentation-driven” model where discs first become unstable and fragment, only after which they are able to self-shield.
Using a small sample of galaxies with high-quality gas data where we can independently examineQthermalandτ, we
find evidence that galaxies will be able to the threshold for gravitational instability well before they cross the threshold for self-shielding in their outer discs. Using a larger sample from the MaNGA survey lacking direct gas information, we show that the value ofQthermalτ(which can be constrained in
the absence of direct gas measurements) is consistent with galaxies being able to cross the threshold for disc instabilities first. The results from both of these samples lend support to the “fragmentation-driven” scenario for star formation in galaxies.
Future observations that can directly resolve gas dis-tributions in large and diverse samples of galaxies out to large radii will be highly valuable to further test the fragmentation-driven star formation scenario. Wide field in-terferometric surveys like WALLABY and APERTIF which overlap MaNGA and other IFU surveys will be particularly beneficial. Similarly, the upcoming Local Volume Mapper (LVM) will yield high quality optical spectroscopy to com-pliment the growing radio/mm-wave inventory of nearby galaxies. The combination of complete data for large sam-ples will also enable exploration into whether the behavior ofQthermal,τ, andQthermalτ are universal for all galaxies, or
whether they vary with other galaxy properties or their en-vironments, potentially providing additional insight into the physical processes that regulate widespread star formation in galaxy discs.
ACKNOWLEDGEMENTS
We thank our anonymous referee for their constructive feed-back which greatly improved this work. We would also like to thank Christy Tremonti and Eric Emsellem for useful discussions. This work was supported by World Premier International Research centre Initiative (WPI Initiative), MEXT, Japan. MAB acknowledges NSF-AST-1517006. AW acknowledges support of a Leverhulme Trust Early Ca-reer Fellowship. DB acknowledges support from RSF grant RSCF-14-50-00043. MEO was supported by the National Science Foundation Graduate Research Fellowship under Grant No. 1144469. Funding for the Sloan Digital Sky Sur-vey IV has been provided by the Alfred P. Sloan Founda-tion, the U.S. Department of Energy Office of Science, and the Participating Institutions. SDSS-IV acknowledges sup-port and resources from the centre for High-Performance Computing at the University of Utah. The SDSS web site is www.sdss.org.
SDSS-IV is managed by the Astrophysical Research Consortium for the Participating Institutions of the SDSS Collaboration including the Brazilian Participation Group, the Carnegie Institution for Science, Carnegie Mellon Uni-versity, the Chilean Participation Group, the French Par-ticipation Group, Harvard-Smithsonian centre for Astro-physics, Instituto de Astrof´ısica de Canarias, The Johns Hopkins University, Kavli Institute for the Physics and Mathematics of the Universe (IPMU) / University of Tokyo, Lawrence Berkeley National Laboratory, Leibniz Institut f¨ur Astrophysik Potsdam (AIP), Max-Planck-Institut f¨ur As-tronomie (MPIA Heidelberg), Max-Planck-Institut f¨ur As-trophysik (MPA Garching), Max-Planck-Institut f¨ur Ex-traterrestrische Physik (MPE), National Astronomical Ob-servatories of China, New Mexico State University, New York University, University of Notre Dame, Observat´ario Nacional / MCTI, The Ohio State University, Pennsylva-nia State University, Shanghai Astronomical Observatory, United Kingdom Participation Group, Universidad Nacional Aut´onoma de M´exico, University of Arizona, University of Colorado Boulder, University of Oxford, University of Portsmouth, University of Utah, University of Virginia, Uni-versity of Washington, UniUni-versity of Wisconsin, Vanderbilt University, and Yale University.
REFERENCES
Andersen D. R., Bershady M. A., 2013,ApJ,768, 41
Asplund M., Grevesse N., Sauval A. J., Scott P., 2009,ARA&A,
47, 481
Bigiel F., Leroy A., Walter F., Brinks E., de Blok W. J. G., Madore B., Thornley M. D., 2008,AJ,136, 2846
Bigiel F., Leroy A., Walter F., Blitz L., Brinks E., de Blok W. J. G., Madore B., 2010a,AJ,140, 1194
Bigiel F., Leroy A., Seibert M., Walter F., Blitz L., Thilker D., Madore B., 2010b,ApJ,720, L31
Bizyaev D. V., Kautsch S. J., Mosenkov A. V., Reshetnikov V. P., Sotnikova N. Y., Yablokova N. V., Hillyer R. W., 2014,ApJ,
787, 24
Blanton M. R., et al., 2017,AJ,154, 28
Blitz L., Rosolowsky E., 2004,ApJ,612, L29
Blitz L., Rosolowsky E., 2006,ApJ,650, 933
Boissier S., et al., 2007,ApJS,173, 524
Brown M. J. I., et al., 2014,ApJS,212, 18
Bundy K., et al., 2015,ApJ,798, 7
Bush S. J., Cox T. J., Hernquist L., Thilker D., Younger J. D., 2008,ApJ,683, L13
Catinella B., et al., 2013,MNRAS,436, 34
Christlein D., Zaritsky D., Bland-Hawthorn J., 2010, MNRAS,
405, 2549
Daddi E., et al., 2010,ApJ,714, L118
Drory N., et al., 2015,AJ,149, 77
Elmegreen B. G., 1989,ApJ,338, 178
Elmegreen B. G., 2011,ApJ,737, 10
Elmegreen B. G., Parravano A., 1994,ApJ,435, L121
Ferguson A. M. N., Wyse R. F. G., Gallagher J. S., Hunter D. A., 1998,ApJ,506, L19
Fitzpatrick E. L., 1999,PASP,111, 63
Genzel R., et al., 2010,MNRAS,407, 2091
Gil de Paz A., et al., 2005,ApJ,627, L29
Gil de Paz A., et al., 2007,ApJS,173, 185
Gunn J. E., et al., 2006,AJ,131, 2332
Helfer T. T., Thornley M. D., Regan M. W., Wong T., Sheth K., Vogel S. N., Blitz L., Bock D. C.-J., 2003,ApJS,145, 259
Hopkins P. F., Kereˇs D., O˜norbe J., Faucher-Gigu`ere C.-A., Quataert E., Murray N., Bullock J. S., 2014, MNRAS,
445, 581
Hunter D. A., Elmegreen B. G., Baker A. L., 1998,ApJ,493, 595
Hunter D. A., Elmegreen B. G., Ludka B. C., 2010,AJ,139, 447
Jansen R. A., Franx M., Fabricant D., Caldwell N., 2000,ApJS,
126, 271
Jog C. J., Solomon P. M., 1984,ApJ,276, 127
Kennicutt Jr. R. C., 1989,ApJ,344, 685
Kennicutt Jr. R. C., 1998,ApJ,498, 541
Kennicutt R. C., Evans N. J., 2012,ARA&A,50, 531
Kennicutt Jr. R. C., et al., 2003,PASP,115, 928
Kewley L. J., Dopita M. A., 2002,ApJS,142, 35
Kewley L. J., Ellison S. L., 2008,ApJ,681, 1183
Kewley L. J., Groves B., Kauffmann G., Heckman T., 2006,
MNRAS,372, 961
Kobulnicky H. A., Kewley L. J., 2004,ApJ,617, 240
Krumholz M. R., 2012,ApJ,759, 9
Krumholz M. R., McKee C. F., Tumlinson J., 2009,ApJ,693, 216
Law D. R., et al., 2015,AJ,150, 19
Law D. R., et al., 2016,AJ,152, 83
Lemonias J. J., et al., 2011,ApJ,733, 74
Leroy A. K., Walter F., Brinks E., Bigiel F., de Blok W. J. G., Madore B., Thornley M. D., 2008,AJ,136, 2782
Leroy A. K., et al., 2009,AJ,137, 4670
Leroy A. K., et al., 2013,AJ,146, 19
Marino R. A., et al., 2013,A&A,559, A114
Martin C. L., Kennicutt Jr. R. C., 2001,ApJ,555, 301
Martinsson T. P. K., Verheijen M. A. W., Westfall K. B., Ber-shady M. A., Andersen D. R., Swaters R. A., 2013, A&A,
557, A131
Moffett A. J., Kannappan S. J., Baker A. J., Laine S., 2012,ApJ,
745, 34
Moustakas J., Kennicutt Jr. R. C., Tremonti C. A., Dale D. A., Smith J.-D. T., Calzetti D., 2010,ApJS,190, 233
Mu˜noz-Mateos J. C., et al., 2009,ApJ,703, 1569
Orr M., et al., 2017, preprint, (arXiv:1701.01788)
Osterbrock D. E., Ferland G. J., 2006, Astrophysics of gaseous nebulae and active galactic nuclei
Pagel B. E. J., Edmunds M. G., Blackwell D. E., Chun M. S., Smith G., 1979,MNRAS,189, 95
Pilyugin L. S., Thuan T. X., 2005,ApJ,631, 231
Rafikov R. R., 2001,MNRAS,323, 445
Romeo A. B., 1992,MNRAS,256, 307
Roˇskar R., Debattista V. P., Brooks A. M., Quinn T. R., Brook C. B., Governato F., Dalcanton J. J., Wadsley J., 2010,
MNRAS,408, 783
Ryan-Weber E. V., et al., 2004,AJ,127, 1431
SDSS Collaboration et al., 2016, preprint, (arXiv:1608.02013) Safronov V. S., 1960, Annales d’Astrophysique,23, 979
S´anchez S. F., et al., 2016a, Rev. Mex. Astron. Astrofis.,52, 21
S´anchez S. F., et al., 2016b, Rev. Mex. Astron. Astrofis.,52, 171
Schaye J., 2004,ApJ,609, 667
Schlegel D. J., Finkbeiner D. P., Davis M., 1998,ApJ,500, 525
Schmidt M., 1959,ApJ,129, 243
Schruba A., et al., 2011,AJ,142, 37
Shapiro K. L., Gerssen J., van der Marel R. P., 2003, AJ,
126, 2707
Simard L., Mendel J. T., Patton D. R., Ellison S. L., McConnachie A. W., 2011,ApJS,196, 11
Smee S. A., et al., 2013,AJ,146, 32
Tan J. C., 2000,ApJ,536, 173
Thilker D. A., et al., 2007,ApJS,173, 538
Toomre A., 1964,ApJ,139, 1217
Utreras J., Becerra F., Escala A., 2016,ApJ,833, 13
Walter F., Brinks E., de Blok W. J. G., Bigiel F., Kennicutt Jr. R. C., Thornley M. D., Leroy A., 2008,AJ,136, 2563
Wang B., Silk J., 1994,ApJ,427, 759
Werk J. K., et al., 2010,AJ,139, 279
Wong T., Blitz L., 2002,ApJ,569, 157
Yan R., et al., 2016a,AJ,151, 8
Yan R., et al., 2016b,AJ,152, 197
Zasov A. V., Bizyaev D. V., 1994, in King I. R., ed., Astronomical Society of the Pacific Conference Series Vol. 66, Physics of the Gaseous and Stellar Disks of the Galaxy. p. 73
Zhang K., et al., 2017,MNRAS,466, 3217
van der Kruit P. C., Searle L., 1981, A&A,95, 105