COUNCIL
*TOMAS F. 0 COFAIGH, LL.D., President of the Institute.
*EUGENE McCARTHY, M.Sc.(Econ.), D.Econ.Sc., Chairman of the Council. K. BONNER, Secretary, Department of Labour.
V.K. BOROOAH, M.A., Ph.D., Professor, Department of Applied Economics and Human Resource Management, University of Ulster at Jordanstown.
J. CAWLEY, Senior Partner, Cawley Sheerin J1,ynne. ,
L. CONNELLAN, B.E., C.Eng., M.I.E.I., Director General, Confederation of Irish Industry.
*SEAN CROMIEN, B.A., Secretary, Department of Finance.
*MARGARET DOWNES, B.Comm., F.C.A., LL.D., Director, Bank of Ireland. *MAURICE F. DOYLE, B.A., B.L., Governor, Central Bank of Ireland.
DERMOT EGAN, Director, AIB plc. P.W. FLANAGAN, Dublin.
PATRICK A. HALL, B.E., M.S., Dip.Stat., Director of Research, Institute of Public Administmtion.
*KIERAN A. KENNEDY, M.Econ.Sc., D.Phil., Ph.D., Director of the Institute. P. LYNCH, M.A., M.R.I.A., Dublin.
*D.F. McALEESE, B.Comm., M.A., M.Econ.Sc., Ph.D., Whate(y Professor, Department of Economics, Trinity College, Dublin.
McCUMISKEY, E.F., Secretary, Department of Social Welfare.
JOHN J. McKAY, B.Sc., D.P.A., B.Comm., M.Econ.Sc., Chief Executive Officer, Co. Cavan Vocational Education Committee.
*D. NEVIN, Dublin.
JOYCE O'CONNOR, B.Soc.Sc., M.Soc.Sc., Ph.D., Director, The National College of Industrial Relations, Dublin.
MAURICE O'GRADY, M.Sc.(Mgmt), Director General, Irish Management Institute.
W.G.H. QUIGLEY, Chairman, Ulster Bank, Limited.
PIERCE RYAN, B.Agr.Sc., M.Sc., Ph.D., M.R.I.A., Director, Teagasc.
S. SHEEHY, B.Agr.Sc., Ph.D., Professor, Department of Applied Agricultural Economics, University College, Dublin.
M.J. SOMERS, Director, National Debt Management, Department of F£nance, Dublin.
J. SPENCER, B.Sc.(Econ.), Professor, Department of Economics, The Queen's University, Belfast.
*B.M. WALSH, B.A., M.A., Ph.D., Professor, National Economics of Ireland and Applied Economics, University College, Dublin.
REV. C.K. WARD, B.A., S.T.L., Ph.D., Professor, Department of Social Science, University College, Dublin.
*T.K. WHITAKER, M.Sc.(Econ.), D.Econ.Sc., LL.D., Dublin.
THE ECONOMIC AND SOCIAL RESEARCH INSTITUTE
Medium-Term Review:
1991-1996
JOHN BRADLEY JOHN FITZ GERALD DANIEL MC COY
Copies of this paper may be obtained from The Economic and Social Research Institute (Limited Company No. 18269), (Registered Office) 4 Burlington Road, Dublin 4.
Price IR£25.00
John Bradley and John Fitz Gerald are Research Professors and Danny McCoy is a Research Assistant at The Economic and Social Research Institute. The Review has been accepted for publication by the Institute, which is not responsible for either the content or the views expressed therein.
The printing costs of THE MEDIUM-TERM REVIEW: 1991-1996
have been defrayed by a generous contribution
from
GUINNESS IRELAND LIMITED
ACKNOWLEDGEMENT
SUMMARY
CHAPTER 1 INTRODUCTION
Table of Contents
CHAPTER 2 RECESSION AND RECOVERY: IRELAND IN THE 1980s
2.1 INTRODUCTION
2.2 OVERVIEW: 1980-90
2.3 WORLD INFLUENCES DURING THE 1980s
2.4 POLICY AND PERFORMANCE
2.5 IRELAND'S RECOVERY: 1987-1990
2.6 LESSONS FROM THE 1980s
CHAPTER 3 BACKGROUND ASSUMPTIONS
3.1 INTRODUCTION
3.2 WORLD ECONOMIC OUTLOOK
3.3 DOMESTIC ASSUMPTIONS
CHAPTER 4 THE CENTRAL FORECAST
4.1 OVERVIEW
4.2 THE SUPPLY SIDE
4.3 PRICES AND WAGES
4.4 INCOMES
4.5 EXPENDITURE ON GNP
4.6 THE BALANCE OF PAYMENTS
4.7 LABOUR MARKET
4.8 THE PUBLIC FINANCES
4.9 THE MONETARY SECTOR
4.10 UNCERTAINTIES
4.11 CONCLUSIONS
CHAPTER 5 IRELAND IN THE YEAR 2000
iv
V
3
3
411 16 20 23
25
25
25
30
33
33
34 39 42 42 45
46
47
49
51
52
55
5.1 INTRODUCTION
555.2 A SCENARIO FOR 2000
55
5.3 EXPLORING THE SCENARIO
585.4 FRAMEWORK FOR POLICY
62
APPENDIX
67
THE ESRI MEDIUM-TERM ECONOMIC MODEL
by John Bradley and John Fitz Gerald
73
ECONOMIC CONSEQUENCES OF CAP REFORM
by John Fitz Gerald and Deirdre O'Connor
79
MACROECONOMIC IMPACT OF ENVIRONMENT AL POLICY ON ACID RAIN
by Daniel McCoy
91ISSUES IN THE ANALYSIS OF IRISH UNEMPLOYMENT
ACKNOWLEDGEMENTS
The production oftheMedium-TermReview is, in many ways, a collective
effort within the Economic and Social Research Institute. The editors of
the Review have drawn heavily on the wide range of expertise of the
Director of the ESRI and their Institute colleagues, who have assisted
during all stages of preparation and revision.
In particular, we are grateful to Teny Baker, editor of the Institute's
Quarterly Economic Commentary, for assistance with the interface
between the QEC forecasts for
1991 and our own projection of these
short-term forecasts into the medium term. In addition, Teny Baker made
valuable contributions to the discussion of policy in the medium te1m.
David Hurley, of the Department of Finance, has provided constant and
invaluable help over an extended period of years in the preparation of
computer data banks and in the technical development, maintenance and
testing of the economic model. Frank Bany, of University College Dublin,
also provided incisive comments on early drafts of the Review.
The economic model used in preparing this Review was developed in part
with the assistance of research funding from the European Community:
DG XII (Science, Research and Development), as part of the trans-EC
HERMES modelling exercise, and from DG XVI (Regional Fund), as
part of a study of the impact of the CSF on the Irish economy.
Mary McElhone, of the ESRI, assisted in the final production of the
Review, through her efforts to correct our grammar and improve the visual
layout.
SUMMARY
MAIN FEATURES
Our medium-term forecast for the period 1991-96 is for a pattern of resumed, steady growth in GNP, after a temporary slow-down this year. The average rate of growth should be in the region of 3.5% per annum, a slower growth than was anticipated prior to the down-ward revisions of the prospects for the world economy made over the last two years. In particular, the rise in German interest rates, consequent on unification, has reduced the prospective Irish growth rate in the medium-term by 0.5%.
This level of modest, steady growth will sustain a surplus on the balance of payments of about 2 % of GNP, due to the high export orientation of Irish industry and the maintenance of recent gains in cost competitiveness. A high level of profit outflow will also continue, exerting a downward influence on the value of GNP. Payments of interest on the foreign-held component of the national debt will only increase slightly, and will fall as a percentage of GNP. Factor income flows from the build-up of Irish-owned foreign assets will increase, and the net effect of all three factor income components of the balance of payments will not impart a downward bias between GNP and GDP growth, as it did in the 1980s.
When privatisation receipts are taken into account, the exchequer borrowing requirement, at a level of 2% of GNP in 1990, will stay unchanged as a proportion of GNP this year, but will rise to about 3% next year. Thereafter, it will decline slowly, but will still be in deficit to the extent of almost 1.5% of GNP by 1996. A gradual reduction in the debt/GNP ratio is forecast to continue, but it is likely that the stated target of 100% by 1993 will not be reached until one year later, and that the ratio will still be above 90% by 1996.
By any standards, Ireland's record of low wage and price inflation of recent years is impressive. We forecast that price inflation will continue at a low level of under 3% per annum for the next five years, driven by a relatively stable world inflation picture and the likely stability of the Irish pound within the EMS. However, wage inflation is likely to pick up slightly from the very low rates that held over the 1987-90 period of the Programme for National Recovery. Rates for the period 1992-96 are likely to average just over 5% per annum, a value not likely to compromise seriously recent competitiveness gains.
Total employment will grow by about 50,000 jobs over the five-year period, or by Jess than 1 % per annum. The growth in employment might have been closer to 80,000 were it not for the high interest rates consequent on German unification. Against a background of a rapid
natural growth in the labour force, and lower net emigration, due to a depressed UK labour market, this will result in a rise in the unemployment rate from its 1990 level of 14 percent of the labour force to a sustained level of 16%. There is little prospect that it will fall below that level for the next five years.
SECTORAL DETAILS
This is the first issue of the Review that makes use of the greater sectoral detail of the latest version, of the ESRI economic model which permits us to examine the performance of the different sectors in the economy where production activities occur.
Industry was the driving force of the recovery from the recession of the 1980s. Over the period 1987-90, activity in all sub-sectors grew rapidly, driven by a very buoyant world economy (particularly in the UK), and the beneficial effects to confidence of the fiscal adjustments of 1987-89.
The medium-term prospects in the important high-technology sector of manufacturing are for con-tinued growth, but at a lower rate than the exceptionally high levels enjoyed in the last two decades. The traditional sector of manufacturing, after its traumatic performance during the 1980s recession, will continue it's strong recovery, benefiting particularly from Ire-land's more competitive climate. The food processing sector, however, is likely to show a fall in employment with very little change in output, as the reforms of the CAP constrain agricultural production and rationalisa-tion of plants proceeds. In aggregate, employment growth of 20,000 is expected in manufacturing over 1991-96.
Unlike manufacturing, growth in the building and construction sector is determined by domestic demand. The infrastructural programmes being carried out under the Community Support Framework (EC Structural Funds) will also continue to boost construction activity out to 1993 and to sustain it thereafter, on the assumption of a renewed CSF-type programme. However, growth in this sector is likely to display cyclical behaviour, typical of previous recovery periods. Employment is expected to grow by about 11,000 over the period
1991-96.
Developments in the EC Single Market process
(1992) are likely to cause some restructuring within distribution, and to slow growth. While demand for transport and communication services is likely to con-tinue to grow rapidly, employment growth may be more modest clue to the likely restructuring of the postal system. The highest growth will arise in the area of professional, personal and financial services. In aggregate, employment growth of about 30,000 is expected in market services over 1991-96.
The remaining two sectors, agriculture and the public sector, are greatly constrained in their possibi -lities for growth. Agriculture will be subject to major reform of the CAP and this issue is explored fully in a separate article in this Review. Employment is expected to continue to fall, and agriculture is expected to shed almost 25,000 jobs over the period 1991-96. The con-tinuing constraints on the public finances are almost certain to restrict public sector expansionary initiatives . into the medium term, and the likely jobs growth in the public sector (health, education, public administration) is unlikely to exceed about 10,000.
BACKGROUND ASSUMPTIONS
Underlying our central forecast are a set of assumptions concerning key external variables and the stance of domestic policy. In the case of the world economy, we are forced to rely on the work of a number of major international organisations (such as the OECD, EC, IMF) and private international forecasting agencies. The behaviour of the world economy is the single most important influence on the potential for Irish growth. Here, our assumptions were conditioned by two key factors: the slow-down and recession in the US and UK economies, with their knock-on effects on the rest of the world, and the events in Eastern Europe (in particular the unification of Gennany).
The severity of the UK recession, in particular the rise in unemployment, still has serious consequences for Ireland, even though trade diversification and our long-term membership of the EMS have attenuated Irish-UK inter-dependence. In addition, the dominance of US multinational investment in Ireland makes us particularly sensitive to developments in the US econ-omy, over and above the dominance of the US in other world markets. We assume that the UK and the US begin to pull out of recession in 1992, and that annual real growth in OECD industrial output will be just under 2.5% from 1993-96. Inflation in the UK and the US is also likely to moderate towards an annual rate of about 3% in the latter part of our forecast period. Our added assumption that the Irish pound remains essentially linked to movements in the OM will ensure that Ireland too enjoys continued low inflation.
The situation with respect to developments in the re-unified Germany are at once more serious and more clifficultto forecast. The imperative of bringing previous East German regions up to the same level of develop-ment as the Federal Republic will place enom10us political and economic strains on Germany and on the entire European Community. German fiscal policy will need to be expansionary in order to redevelop the Eastern lander, necessitating a massively increased level of public expenditure and some considerable
raising of taxes. This will cause the Germany economy to grow faster than most other OECD economies, bring about large exchequer deficits, and has already caused the Gennany balance of payments to go into deficit.
Consequently, we assume a growth rate of over 4% per annum on average for the period 1991-96, with some slight rise in the rate of German inflation to 4% in 1992, falling back to 3% thereafter. The likely policy of high interest rates pursued by the Bundesbank will keep nominal rates at 8% or above out into the medium term. For domestic policy, we attempt to interpret the official statements and hints about the likely course of public expenditure and taxation planning for the immediate future, and implement a process of "policy indexation" furtherout into the medium term (i.e., where future policy is maintained at fixed real levels).
LONG-TERM PROSPECTS
In our Review we take a somewhat provocative look at a possible long-te1m scenario for the Irish economy out to the year 2000. Given modest steady world growth and a domestic policy of indexation, the scenario points clearly to a serious long-term problem in the Irish labour market.
Ireland inherits a rate of growth at the upper end of that forecast for the OECD area, together with a low and stable rate of price inflation, a maintained modest surplus on the balance of payments, elimination of the EBR and a debt/GNP ratio of about 70 per cent of GNP. Nevertheless, the net annual addition to total employ-ment runs at only 10,000, well below the natural growth in the labour force. This results in resumed emigration (rising from 10,000 in 1992 to just under 40,000 per year by 2000), which serves to lower the rate of unemploy-ment by the year 2000 to the same value it had in 1990, i.e., 14 per cent of the labour force.
In effect, this is the labour market scenario outlined by the National Economic and Social Council in their report A Strategy for the Nineties, and declared to be "entirely unacceptable". Our Review concludes with a critical examination of how policy and behaviour changes are needed in order to prevent this ex ante scenario becoming an ex post reality.
POLICY IMPLICATIONS
Any solution of the ills identified in the scenario to the year 2000 must be addressed under three major headings:
(a) The relationship between employment, unem-ployment, competitiveness and pay;
(b) The nature of the constraint facing public sector initiatives, and how these constraints must be addressed; (c) The scope for long-term development policies to address underlying structural problems
SUMMARY vii TABLE 1. : Central Forecast - Major Aggregates
1988 1989 1990 1991 1992 1993 1994 1995 1996
GNP% Change 1.4 5.0 6.1 2.0 3.7 4.3 3.3 3.6 3.7
Balance of Payments, % of GNP 2.3 1.8 2.9 1.9 2.0 1.8 2.1 1.9 1.9 Exchequer Borrowing Requirement, % of GNP -3.3 -2.3 -2.0 -1.9 -2.9 -2.6 -2.2 -1.9 -1.4 Debt / GNP Ratio 130.4 119.4 111.8 108.4 105.6 101.8 99.5 96.4 92.6 Total Employment (OOO) 1091 1090 1120 1123 1136 1151 1158 1167 1174 Unemployment Rate % 16.7 15.7 14.0 15.8 15.9 15.7 16.0 16.0 16.0
Consumer Prices % 2.5 3.9 2.9 2.7 2.4 2.6 3.0 3.1 3.1
FIGURE 1 FIGURE2
Real GNP Growth Rate Price and Wage Inflation
7
Annual Percentage Change
6
Annual Percentage Change
6 5
5 4
4 3
2 3
2
0
88 89 90 91 92 93 94 95 96
0 -Prices Wages
88 89 90 91 92 93 94 95 96
FIGURE3 FIGURE4
Unemployment Rate Balance of Payments Surplus
Per cent of Labour Force Per Cent of GNP
17 3
2.5 16
15 1.5
14
0.5
13 0
88 89 90 91 92 93 94 95 96 88 89 90 91 92 93 94 95 96
FIGURES FIGURE 6
Exchequer Surplus Debt/GNP Ratio
Per Cent of GNP Per Cent of GNP
0 135
130 -0.5
125 -1
120 -1.5
-2 110
105 -2.5
100 -3
95
-3.5 90
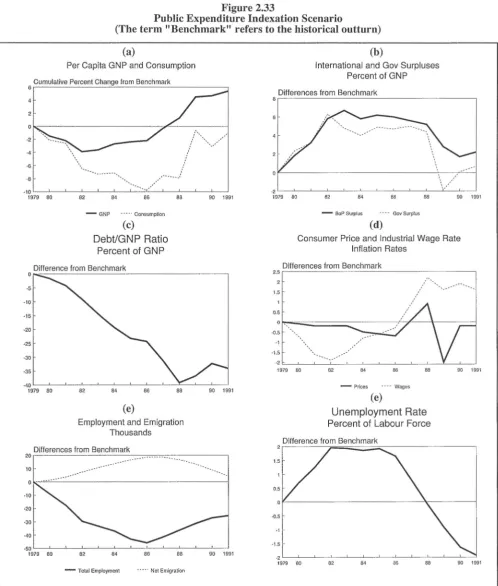
to the likely consequences: low employment, enduring high unemployment and emigration. However, if a virtuous circle of competitiveness, investment, growth and employment can be brought about by more rational and socially desirable evolution of wages and costs, then the prospect opens for a transition towards a high employment, high living standard society.
In this respect, it is disturbing that, at present, rising public expenditure is being used partly to fund higher wage increases in the public sector relative to those in the market sector. This action militates against the stated aspiration of public policy to reduce the rate of unem-ployment in the long run, and will undoubtedly bring pressure to bear on trades unions to seek higher wage increases in the market sector than might otherwise have applied.
The central danger of Ireland's high level of public debt is that movements in world conditions can trigger disruptive corrective measures, as occurred in the early 1980s. The minimum requirements for public policy on indebtedness are a rapid reduction of the debt/GNP ratio to under 100 per cent, mainly on prudential grounds, followed by continuous, if gradual, reduction thereafter towards average EC levels of 50-75 percent.
CHAPTER 1
INTRODUCTION
"no )) ..
rov 'taµtas ZEUS 'EV 'O\uµnro 7t0A./\.(Xo'
'<XEA.7t'C(J)S Kpmvoum 8£0t.K<Xl 'CCX 001CT]8EV'C' o'UK 'E'CEA.ECT8Tl,
'C(J)V
o'
'<XOOlCTj'C(J)V nopov ll'UpE ei::os ."·In classical times in Greece it was traditional to consult the Delphic oracle before commencing any major new undertaking. This consultation was no mere forecasting exercise but took on the nature of a quasi-religious experience. No doubt the oracle learnt a lot of secrets from this process and improved her forecasts as a result! We make no such exalted claims for this Review.
No more than the oracle, what we have tried to do is to learn from past experience and to identify the prob-lems and possibilities for the Irish economy in the 1990s. Chapter 2 of this Review looks at our experience over the last fifteen years. This analysis of past policies and their effectiveness provides the essential basis for any forecast of the next five years.
While the forecasts which we provide are useful to a wide range of organisations and individuals in planning for the future, everyone recognises the uncertainty which must attach to them. However, judgements about the future must be made so, in Chapter 3, we examine developments in the outside world. We consider what the likely environment for the Irish economy will be over the period to 1996 and what are the major factors giving rise to uncertainty about this future.
Having established a view as to the external econ-omic environment Ireland faces, we then use the ESRI Medium-Term Model of the economy to develop a consistent central forecast for the period 1991-96. The first of a series of separate articles in this Review by Bradley and Fitz Gerald gives a non-mathematical description of how the model works. It outlines the key mechanisms in the model and explains the logic behind its specification.
In preparing a forecast, the first task is to decide on a set of assumptions concerning the key variables driving the economy. For example we look at growth in Germany and the UK, German interest rates, UK unemployment, domestic fiscal policy, etc. The model is then applied to these assumptions and a forecast is
* Euripides Medea:
Many are the fates which Zeus in Olympus dispenses; Many matters the gods bring to surprising ends.
The things we thought would happen do not happen; The unexpected god makes possible;
produced. It is at this point that the authors' judgement is applied to the model's results. Extensive adjustments are made to take account of additional information concerning the likely behaviour of the economy and to allow for factors which the model can not take into account.
In this Review the forecast for 1991 is taken directly from the spring issue of the Quarterly Economic Commentary. The central forecast for the next five years is described in Chapter 4. It suggests that the Irish economy can look forward to steady, if unspectacular, growth in GNP over the 1990s. However, the unem-ployment rate will continue rising up to the middle of the decade posing the major problem for economic policy in the medium term. The state of the public finances, which merited less attention in the last Review in 1989, is again a cause for concern in the immediate future. Unless policy is changed the bo1rnwing requirement may actually rise in the next two years.
In Chapter 4 we also use the model to examine how our forecast would be modified by changes in our assumptions about EC interest rates and economic growth in the USA and the UK. The model allows us to explore in a consistent manner the full effects on the economy of such shocks to the external environment.
In many ways more important than our forecasting role is the task of identifying the problems and possible obstacles to development which Ireland may face in the medium to long term. There is a danger that the immediacy of current problems may act as blinkers on our vision of the future. What we wish to do in this Review is to raise our own vision slightly, to see these problems from the perspective of a wider time frame. Chapter 5 considers the problems that will be faced by the Irish economy to the end of the decade and discusses how policy should be modified to deal with them.
Two areas where Ireland faces special problems over the next decade are considered in separate articles. An article, by Fitz Gerald and O'Connor, looks at the likely effects on Ireland of one approach to reforming the Common Agricultural Policy (CAP). This article suggests that the reform package examined could result in a substantial reduction in GNP in the medium term of the order of 1 to 1.5 percentage points. The effects would also be felt beyond the agricultural sector.
An article by McCoy considers Irish policy on acid rain. It examines the likely impact on the economy of different policies to deal with the problem and suggests that the current policy may be seriously flawed. It suggests that a new multilateral approach is called for and it shows that a transfer of funds to Eastern Europe could prove more efficient at meeting what appears to be the government's objective than the policy currently being implemented.
The last article in this Review by Barry provides a review of the literature on the problem of slow employment growth in Ireland. It argues that while conventional demand-side effects of policies have adversely affected employment growth in the past, the supply side of the economy must be seen as the engine of growth. The paper further argues that the impact of structural change on unemployment needs to be researched more fully.
The Record of the
Medium-Term ReviewThis is the fourth Medium-Term Review to be pub-lished since the series began in 1986. While humbling for the authors, it is useful to consider the forecasting record of the Review over the period both to improve the quality of future forecasts and to understand the likely margins for error in the major aggregates. Because the Review provides forecasts five years ahead this is a much more stringent test than that normally applied to short-term forecasts.
Table 1.1 shows the forecast for the average growth in GNP from the last three Reviews. These forecasts are compared to the average growth over the same period using historical figures, where available. For 1991 and later years the latest forecasts from this Review are used and compared to the earlier ones.
While at the time of their publication the first two Medium-Term Reviews were considered to be unduly optimistic, in fact, they underestimated the growth in
the economy by between 0.75% and 1.0% a
TABLE 1.1: Comparison of Forecasts
Average Annual Growth Rate
Forecast Forecast Latest Estimate
Period % %
Reviewl986 1986-91 2.46 3.24
Review 1987 1988-92 2.64 3.69
Review 1989 1989-94 4.88 4.10
year for the forecast period. The 1989 Review erred in the other direction. While it con-ectly forecast the very rapid growth in 1989 and 1990, it failed to predict the 1991 slow-down. In addition, it showed the underlying growth rate in the economy in the 1990s as being around 4% a year, about 0.5 percentage points above the cmTent forecast.
In the case of the slow-down in 1991 the last Review took too optimistic a view concerning the trend of public policy in the USA and the UK. Both these economies failed to deal with the problems apparent in 1989 and recessions ensued. Their depth was magnified by unexpected developments in the Middle East. The forecast large fall in the Irish savings ratio also failed to materialise, partly because interest rates were higher than forecast. The uncertainty concerning movements in the savings ratio continues and this must be a priority for further research.
As explained later, another reason for the reduction in the forecast potential growth in output in the economy lies in the changes in Eastern Europe. The effects of German unification have raised interest rates in the EC. Failure to predict the major upheavals in Eastern Europe was not surprising and was shared with every other forecasting body.
While the margin of error in the forecasts for the average growth in GNP in previous Reviews was between 0.75% and 1.0%, the possibilities of error on a year by year basis are greater. The last Review was fairly succesful in forecasting growth in 1989 and 1990 but it failed to predict the turning point in 1991 when the slow-down occurred (Table 1.2). The first two Reviews were correct in predicting that the Irish economy would show a reasonable recovery from the recession of the 1980s but were not very accurate in forecasting the timing of the recovery. This highlights the fact that while medium-term forecasting is useful in predicting broad trends, it is likely to prove unreliable on the precise timing of developments in the economy. This Review should be read with this caveat in mind.
TABLE 1.2: Comparison of Forecasts for GNP Growth Rate
1986 1987 1988 1989 1990 1991 1992 1993 1994
Review 1986 2.5 3.3 3.5 3.0 3.0 - - -
-Review 1987 - - -0.4 3.0 3.3 3.7 3.6 -
-Review 1989 - - - 4.0 7.1 5.6 4.6 4.8 3.2
Review 1991 - -
-
-
- 2.0 3.8 4.3 3.3-CHAPTER2
RECESSION AND RECOVERY: IRELAND IN THE 1980s
2.1 INTRODUCTION
Since the dust has scarcely settled on the 1980s, it is probably premature to attempt to characterise this recent period in any definitive way. However, history will probably interpret Ireland of the 1980s in terms of two factors:
(a) the very deep world recession associated with the OPEC-II price rises at the beginning of the decade and;
(b) the manner in which domestic policy makers attempted to contain and reverse the public debt consequences of the extravagances of the previous decade against a background of the more buoyant world growth of the late 1980s.
Only now do we have data sufficiently complete (if not yet totally reliable) to give us a picture of how the economy behaved during the 1980s, in particular during the crucial latter years of recovery. Our objective in Section 2.2 is to present an overview of what actually happened and to suggest some possible explanations for the strange roller-coaster behaviour of many measures of Irish economic activity: the violent gyrations of growth in GNP; the rapid decline in inflation; the switch from a chronic balance of payments deficit to a sus-tained, if modest, surplus; the virtual elimination of the exchequer borrowing requirement; and the rapid rise in unemployment to a seemingly ever-enduring high level.
As well as suggesting factors which explain the performance of the economy in a qualitative sense, we also attempt to quantify the role played by these factors in causing recession and recovery during the 1980s. In a very slylised way, three main elements can be identified in such analysis:
(a) the direct and indirect effects of the world economy, over which Irish agents had no effective control;
(b) domestic policy actions, which are determined, at least to some extent, by deliberate and explicit choices of Irish policy makers, and finally;
( c) the manner in which agents in the private sector react to stimuli from world and domestic policy influences.
In Section 2.3 we explore the role of "world" factors in the behaviour of the Irish economy during the 1980s, while in Section 2.4 we examine the role of domestic policy actions. In Section 2.5 we carry out some coun-ter-factual analysis of Ireland's recent period of recovery, focusing specifically on the years 1987-90. These counter-factual experiments attempt to re-play history, but changing certain crucial assumptions, in an
3
effort to understand the driving forces in the economy.
Alternative explanations of this recovery have also been offered and we comment on these, comparing and contrasting them with our own analysis.
Our analysis in these three sections is conditioned by the manner in which we handle the third crucial element above, i.e., the behavioural response of the private sector. Here we are on more controversial ground in that we make use of the framework of analysis contained in the ESRI Medium-Term model of the economy, an introductory description of which is given in a separate article in this Review.
There is no such thing as a perfect and com-prehensive economic model. Nevertheless, the ESRI model is in the public domain, has been extensively used and tested in two previous Reviews and has a structure that is, we believe, intuitively plausible and coherent. Hence, its use in carrying out counter-factual analysis and a decomposition of the major influences operating during the 1980s is of some relevance. It is also important to note that the key focus of the ESRI model is on the production ( or supply) side of the economy, an area that is crucial to understanding Irish economic behaviour in the medium term, but one that is somewhat neglected in quantitative research on Ireland and else-where.
Central to our analysis of the causes of recession and recovery in the Ireland of the 1980s is the assumption that the reactions of the private sector to world and domestic policy stimuli has remained predictable within the framework of analysis used by the ESRI model. In fact we anticipated at least two important changes in behaviour for the late 1980s, these years being outside the range of data used to calibrate the model; the first associated with the determination of wage increases and the second with consumer behaviour.
In the case of wages, it seemed initially likely that the conjunction of adverse labour market conditions and the crisis in the public finances in the mid- l 980s might have led to a significant change in the manner in which trades unions and employers settled on the three-year wage deal negotiated as part of the Programme for National Recovery. In fact, no such break in behaviour was found, and the model continued to explain the main elements of wage bargaining throughout the late 1980s, as we describe below.
which we do not yet fully understand, an ad-hoe adjustment was made to the model to force it to track recent consumption growth.
Our examination of the 1980s, particularly the latter part, is very relevant in evaluating our prospects for the 1990s, the presentation of which later fmms the central element of this Review. In Section 2.6 draw together our main conclusions on the 1980s with a view to setting the scene for the detailed forecasts of the period 1991-1996 (Chapters 3 and 4), and our more speculative exploration of the likely prospects for the latter part of the decade (Chapter 5).
2.2 OVERVIEW: 1980-90
2.2.1 Output and Expenditure
The broadest aggregate measure of production activity in the economy is Gross Domestic Product (GDP), being the summation of output in all the pro-ducing sectors. In Figure 2.1 we show the growth rate of real GDP for the 1980s, using the expenditure-based CSO measure. The dismal and erratic perfonnance of the first half of the decade is only too apparent, as is the robust recovery from 1987 out to 1990.
Figure 2.1 Aggregate Real Growth Gross National & Domestic Product
10 Percentage Change
·2
,'
'
.,·
'.-"/
.4 '--~~~~-'--~~~~~-~~~~--'
1975 76 78 80 82 84 86 88 1990
···· GNP -GDP
However, for Ireland during the 1980s, performance, even judged by this GDP measure, was misleadingly flattering. A sizeable fraction of domestic product was required to fund both interest payments on the foreign component of the national debt and profit repatriations from foreign-owned branches of Irish-based multi-nationals. These two outflows from the economy grew
Figure 2.2 Sectoral Output Growth
(a)
Aggregate Industrial Output
:: [Percentage Change
10
8
·2 ' - - ~ ~ - - ' - ~ ~ ~~ ' - - ~ ~ ~- ~ ~ ~ - - '
76 78 80 82 84 86 87 88 89 1990
(c)
Agricultural Output
Percentage Change
1 5 - - ~ ' - - - ~- -- - - -- - - - -~
10
·5
·10
-15'--~~~-~~~~-~~~~-~~~
76 78 80 82 84 86 87 88 89 1990
(b)
Aggregate Market Services Output
Percentage Change
0~---..-'=---~---- - -- - - ,
·2 ' - - ~ ~- - ' - ~~ ~ -~ ~ ~- - '- ~ ~ ~~
76 78 80 82 84 86 87 88 89 1990
(d)
Public Sector Output
Percentage Change
7 -
--0
·1
·2
·3 .4 .5
RECESSION AND RECOVERY: IRELAND IN THE 1980s rapidly during the 1980s and were much larger than any inflows of income from abroad to Irish residents arising from ownership of foreign assets. Subtracting the real net outflow abroad from GDP, the resulting real Gross National Product (GNP) growth rate is shown as the dotted line in Figure 2.1.
Further understanding of the growth of GDP can be obtained by looking at the sectors of the economy which produce it. In Figure 2.2 (a-d) we show the growth rate of output in four main sectors at factor cost (i.e., excluding taxes and subsidies): industry, market ser-vices, agriculture and non-market services. The two dominant producing sectors are industry ( over 42 per cent share of total GDP by 1990) and market services (35 per cent share), while the share of agriculture declined over the 1980s to about 9 per cent by 1990.
The pattern of industrial growth reflects (indeed, dominates) the aggregate picture: a slow-down during the first half of the decade, followed by a very vigorous recovery over the period 1987-90. A similar pattern is seen in the performance of market services, although the recovery phase is somewhat attenuated.
The erratic behaviour of agriculture (with some remarkably good years - 1982 and 1984 - and some very bad years, often weather related - 1985-86 and 1989) is fairly typical of any primary producing sector. The small share of agriculture in the economy (9 per cent by 1990 compared with 15 per cent in 1960) means that the rest of the economy is somewhat less sensitive to shocks originating in agriculture than was the case, for example, in the 1960s.
Finally, Ireland entered the 1980s with a greatly increased level of public sector output and employment and consequently, of expenditure on public goods and services (also referred to as "non-market" services). Many of the subsequent problems with the public finances can be inferred from the behaviour of public sector output. Even by 1982, when aggregate GNP growth was negative, real public sector activity was still growing by over 3 per cent. Over the period 1983-87, the real level of public services remained relatively static (with a temporary rise in 1986). The cuts in the levels of services (initiated after the 1987 general election) were concentrated in the years 1988-89 (-4.3 and -2.5 per cent respectively), with service levels growing by a modest half per cent in 1990-91.
In summary, any explanation of the low and erratic growth in aggregate GDP over the 1980s should be based on the mechanisms of growth in the producing sectors: low growth in industry for the period 1980-86, followed by a rapid recovery; a similar pattern in marketed services; erratic growth in agriculture, the causes of which have little connection with the non-agricultural economy; and a frozen real level of public sector services to 1987, followed by two years of real cuts. We now examine these mechanisms under two broad headings: the behaviour of the public sector and the behaviour of the private sector.
2.2.2 The Public Sector during the 1980s
The output measure of public sector activity (i.e., services of public administration, health and education) appears on the expenditure side of the national accounts as public consumption. Since funding public
con-5
sumption represents ultimately a burden on the rest of the economy (a burden that can only be delayed and increased by debt rather than tax finandng), we show in Figure 2.3 the share of public consumption in the value of GNP. Starting at 20.5 percent in 1980 (up from 14 per cent in 1970), this ratio stayed high during the first half of the decade, peaked in 1986 at 21 per cent, and declined to just under 18 per cent by 1990 as a result of job shedding in the public sector (Figure 2.4 ).
Figure 2.3
Share of Public Consumption in GNP
Figure 2.4
Public Sector Employment
- Public Admin. · - Health & Educ.
The above ratio is a "narrow" measure of the size of the public sector in the economy. A wider measure consists of total public expenditure, obtained by adding public consumption, subsidies, current and capital transfers (such as debt interest payments, unemploy-ment benefits and IDA grants to industry), and public investment expenditures (such as housing, roads, etc). In Figure 2.5 we show this "broad" expenditure measure as a ratio to GNP. It peaked at just under 56 per cent in 1985, and by 1990 had fallen back to under 46 per cent (it was 39 per cent in 1975).
Figure 2.5
Total Public Sector Expenditure (Consumption, Transfers, Capital)
Percent of GNP
5 6 . -- - - -- - - ~
54
52
50
48
46
44 ·
42 ·
40
30~~~~~-~~~~~~-~~~~~
1975 76 78 80 82 84
Figure 2.6 Exchequer Surplus
86 88
Actual Surplus and "Primary" Surplus
Percent of GNP
1990
8 , - - - - · - - - - -- -- - - ~
4 •
78 80 82 84 86
- Actual Surplus · -- - Primary Surplus
Figure 2.7 Total Tax Revenue
50 Percentage of GNP 48
46
42
40
38
36
34
32
1975 76 78 80 82 84 86
88 1990
88 1990
Financing the burgeoning EBR required the state to borrow both domestically and abroad, and the accu-mulated national debt as a proportion of GNP (the "debt/GNP" ratio) rose from just under 80 per cent of GNP in 1980, to a peak of over 137 per cent in 1987, and had declined to 112 per cent by 1990 (Figure 2.8). The high level of borrowing was further exacerbated by the rise in nominal and "real" interest rates (i.e., the "nominal" or actual rate corrected by subtracting the rate of inflation), movements in which are shown in Figure 2.9. In the previous Figure 2.6 we show the "primary" surplus (i.e., the actual exchequer surplus less interest
payments on the national debt), which became positive in 1987, and is now rnnning at some 7 per cent of GNP, as against a continuing actual deficit.
Figure 2.8
Foreign & Domestic Debt Interest
Percentage of GNP
140 . - -- - - = = - c = - - -- i
120
100
80
60
40
20
-2 -4 ·6
-8
-10
1975 76 78 80 82 84 86
- Foreign [S] Domestic
Figure 2.9
Real Interest Rate on National Debt 5-Year Bond Rate
88 1990
' - -~ ~~ ~ ~' - -~ ~ ~ ~ - - ' - - ' - - . L . _ _ - - - - L - ~ - - '
1975 76 78 80 82 84 86 88 1990
A genuine fear existed during the early 1980s that the debt/GNP ratio might grow out of control, as increased b01Towing was required to fund the growing interest bill, opening the possibility of default, debt rescheduling and externally imposed adjustment pro-grammes. However, just as bad luck (in the form of the OPEC-II recession) exacerbated the debt problem at the encl of the 1970s and into the 1980s, a combination of long-delayed domestic fiscal reform and a buoyant world economy eased the process of adjustment towards the end of the 1980s.
The bulk of the adjustment, in terms of expenditure cuts, took place in the years 1988-89. However, the budget of 1990 relaxed this process of adjustment, kept expenditure roughly constant in real terms, and provided only a modest reduction of the EBR from 2.3 to 2 per cent of GNP.
RECESSION AND RECOVERY: IRELAND IN THE 1980s
inherited greatly expanded state sector in the leaner, more competitive, 1980s made an already difficult situation worse.
2.2.3 The Behaviour of the Private Sector
The analysis of the behaviour of the private sector is very different from that of the public sector discussed above. As shown in the separate article on the ESRI medium-term model later in this Review, we attempt to explain the behaviour of the private sector in terms of the outcome of purposeful directed actions.
So, for example, a private firm is assumed to produce a given output at minimum cost in terms of inputs needed. Hence, anything that reduces the desired pro-duction target (say, a decline in world demand), will cause a fall in the requirement for all inputs. Also, anything that raises the cost of labour (i.e., the wage rate) will force such a finn to use less labour in production. Firms that ignore these signals simply lose profitability and ultimately may go out of business.
A better understanding of the functioning of the private sector requires more detail than the above three-way breakdown into industry, market services and agriculture. Starting with industry, three sub-sectors can be distinguished: manufacturing, building and utilities. Figures 2.10 and 2.11 show employment in manufac-turing and in building over the 1980s (employment in utilities - electricity, gas and water- was relatively constant at 14,000 throughout the decade). The shedding of 33,000 jobs in building and 39,000 in manufacturing over the years 1980 to 1987 are dramatic illustrations of the economic and social consequences of Ireland's recession.
Figure 2.10
Manufacturing Sector Employment
Thousands
260r -- -- - - -- - -- - ~
210L.~~~-~-~~~~-~--~~~~
1975 76 78 80 82 84 86 88 1990
Three further subdivisions of manufacturing are also relevant:
(a) a high technology sector (multinational, capital and
R&D intensive, totally export oriented, repatriates its profits);
(b) afood-processing sector (mostly indigenous, linked to agriculture via its material inputs, moderately export oriented), and;
(c) a traditional sector (drink, textiles, wood, publish-ing, etc), which has a high dependence on the domestic and UK markets.
Figure 2.11
Employment in Building & Construction
Thousands
ms~ -- - - - -- - - -- - - -~
100
95
90
85
80
75
70
65 ' - -~ ~ - - - ' - - ~~ - ' - -- ' - - - ' - - ' ---'-- "--'--'---'---'
1975 76 78 80 82 84 86 88 1990
7
Employment in these subsectors is shown in Figure 2.12, where it is apparent that the bulk of manufacturing job losses occurred in the traditional and food sectors.
Figure 2.12
Sectoral Employment in Manufacturing
Thousands
125 ' ,
-115
105
95
85
75
65
55
45
---
-35 ' - -~ ~ - - - ' - - ~ ~ - ' - -- ' - - - ' - - ' ---'--"'---'-'-'-'-'-'-'==-'-'--'
1975 76 78 80 82 84 86 88 1990
- High-Tech -· -· Food -- Traditional
The manufacturing sector component of industry has now become the key driving force of the Irish economy. It has a massive exposure to world trade: Figure 2.13 shows industrial exports as a proportion of gross national product. Given that exposure, there are two main detenninants of manufacturing activity:
(a) the state of demand in the global economy, and
(b) cost competitiveness relative to trading partners.
Figure 2.13
Industrial Exports as Share of GNP
60 Percentage of GNP
55
50 ·
45
40
35
30 ·
25
20 ~ ~ ' ~ ' ~ L ' ' ' ' ' L ' ' '
-1975 76 78 80 82 84 86 88
Figure 2.14
Irish & OECD Industrial Growth
12 Percentage Change 11
10 • 9
4
3 .
2 .
90 1991
1
0 1 - - - \ + - ~ - ' - - - J
·1
-2
-3 ~ ~~ - - - - ' - - ~ - ' - - ~ - - ' -- - ' - ~ - ' - - - ' -- - ' - - ' - - - ' - ~
1975 76 78 80 82 84 86 88
- Ireland - · · · OECD Average
Figure 2.15
International Wage Comparison
Common Currency
Index Base 1986=1
- Irish/ German ···· Irish/UK
1990
1990
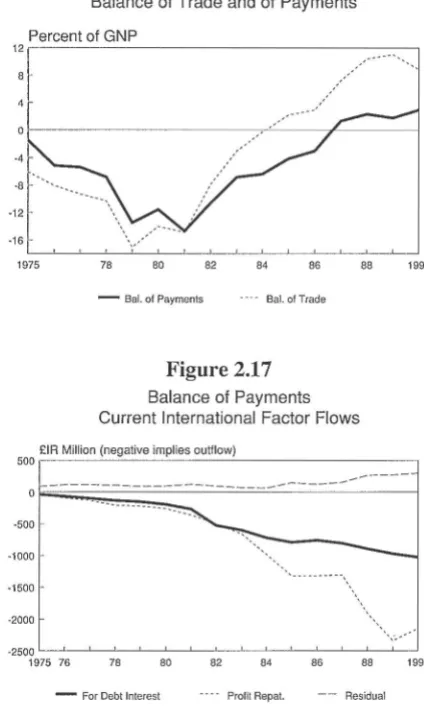
The relatively strong performance of the manufac-turing sector, combined with a weak domestic demand for imports ( due to tight fiscal policy), led to the build-up of a large balance of trade surplus during the 1980s, thus reversing the deficits of the 1970s (Figure 2.16). However, the move to surplus on the balance of inter-national payments took longer, due to the high and rising foreign debt and profit repatriation outflows, as shown in Figure 2.17.
Figure 2.16
Balance of Trade and of Payments
Percent of GNP
1 2 . - - - ~
1975 78 80 82 84 86
[image:18.589.317.529.73.432.2]- Bal. of Payments ··-- Bal.ofTrade
Figure 2.17 Balance of Payments Current International Factor Flows
88 1990
£IA Million (negative implies outflow)
500 . - - - - ' - - " ' - -- ' - - -- - ' - - - -~
---
---
-0
r.;;;;;;;;;;:=:::::::=----'-=:.:__-
- - - 1
-500
·1000
-1500
-2000
·2500 '----'---'---'---'--'----'---'---'----'-~ - - ' - - _ J _ - ' - - - ' - _ _ J
1975 76 78 80 82 84 86 88 1990
- For Debt Interest ···· Prom Repat. - - Residual
Turning to market services, this is now the largest sector of the economy in terms of employment. Unlike manufacturing, with the exception of tourism and some other services it is largely sheltered from direct exposure to world markets. Nevertheless, it thrives when the exposed industrial and agricultural sectors thrive and domestic demand is buoyant. In the short run it is broadly able to pass on higher costs in terms of higher prices.
Two offsetting forces operated on market services during the 1980s:
(a) a negative effect due to recession in the inter-nationally trading sectors, and;
(b) a positive effect due to restructuring in industry, where many activities shifted from industry to ser-vices as, for example, originally in-house activities were replaced by bought-in services.
The resulting employment behaviour in industry and services is shown in Figure 2.18, where the relatively buoyant perfmmance of services contrasts with the dismal performance of industry.
I
I
'
RECESSION AND RECOVERY: IRELAND IN THE 1980s
Figure 2.18 Sectoral Employment Industry and Market Services
Thousands
390
360
330
300
~~~-L-~~~~~-==--~__J
1975 78 80 82 84 86 88 1990
- Industry Market Services
2.2.4 Wages, Prices and Profits
We have seen that Irish industrial output and export prices are largely determined abroad, and firms are unable to pass on higher domestic costs of production unless these cost rises are also being experienced abroad (i.e., as a general world-wide inflation). Hence, a firm's competitiveness will depend on its input costs and the efficiency with which it uses inputs (including non-price elements like design).
A key input cost consists of wages, particularly for "labour intensive" sectors. In Figure 2.19 we show the wage bill as a proportion of output (added-value) for the three-way breakdown of manufacturing. The traditional sub-sector is clearly the most labour intensive, with the high-technology sector being the least. However, given the way in which wage-rounds have been determined (or, at least, influenced) by economy-wide agreements, and the national coverage of trades unions, not sur-prisingly changes in wage rates tend to show a con-siderable similarity between sectors.
80 1
1
Figure 2.19
Wage Bill Share of Added Value Manufacturing Industry
60 ~ - - - / / 50
20 ·--'-- __ .l.._ _ _ . . L - . . . - . . . . _ . ~ ~ ~ ~ - - ~ . l . _ _ _ _ _ _ _ _ . . L _ . _ - - 1 . . . _ . _ J . _ _ _ [ 1975 76 78 80 82 84 86 88
- High-Tech Food -- - Traditional
1990
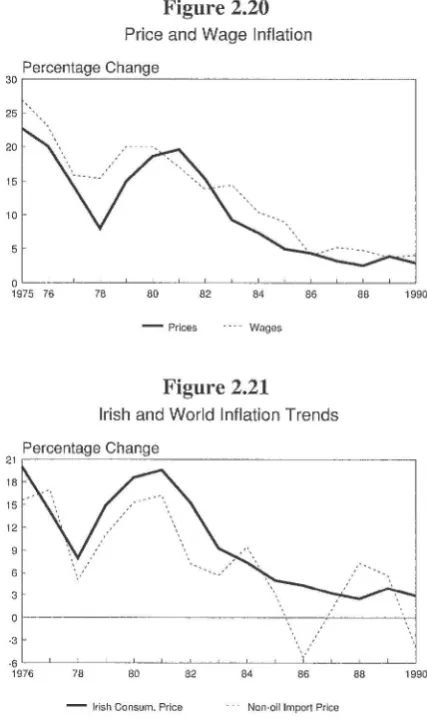
In Figure 2.20 we show the rate of wage inflation in total industry (the leading sector), together with the rate of consumer price inflation. Between 1980 and 1986, the growth rate of average annual earnings in industry fell from 18 per cent (in 1981) to 5 per cent (by 1986), and has remained at or below about 5 per cent per annum since then. To a considerable extent the process of disinflation was driven by world disinflation throughout
9
[image:19.589.312.526.115.478.2]the 1980s (Figure 2.21 ). However, this process was assisted by the other downward pressures on wage demands, which we now examine, using the findings on wage bargaining discussed in the special article on the ESRI model later in this Review.
Figure 2.20
Price and Wage Inflation Percentage Change
30 ~ ~ ~ ~
-25
20
15
10
0 ~-~-~~---~-~~--~-~~~
1975 76 78 80 82 84 86 88 1990
- Prices -Wages
Figure 2.21
Irish and World Inflation Trends Percentage Change
21 ~
-18 15
12
3
o e
--3
-6 ~-~~-~-~--~~~-~
1976 78 80 82 84 86
- Irish Consum. Price Non-oil Import Price
88 1990
In Figure 2.22 (a-d) we show the four elements determining wage inflation in the ESRI model, weighted so as to represent their short-run contribution to wage inflation. The solid line in each graph shows the actual path of wage inflation. The dotted line shows the effect on wage rates of the particular factor under investiga-tion.
(a) The biggest determinant is clearly output price
inflation, which was falling globally as well as in Ireland. In the seven year period between 1980 and 1987, world price deflation appears to have reduced wage inflation from its high 1980 level of about 20 per cent by about 15 percentage points, other things being equal.
(b) The tax wedge tended to add about 3 per cent to wage inflation each year from 1980 to 1988, with little or no net contribution thereafter.
Figure 2.22
Determinants of Wage Inflation During the 1980s (a)
Explanation of Wage Inflation Price Component
21 Percentage Change 18
15 12 ···-.
9 6 3
0 1 - - - ' - - . - - - . . . , . - ' - - - \ - ' < ' - - - " - l
~-~~~ .. ~
-3 ' - - - ' - - - ' - - . . . J ' - - - 1 . . . - . L . . _ - - - 1 . _ = : . . . . _ L . . _ _ _ L _ . _ y ' . _ .. ___,
80
18 15 12
9 6 3 0 •
·-82 84 86 88 90 1991
- Wages - • - • · Prod. Price Effect (c)
Explanation of Wage Inflation Unemployment Component (Phillips Curve)
-3 '---'---~--···"-··=· =··=···=· LC.." - - ' - - - - ' - - - ' - - . . . J ' - - - 1 . . . - . L . . _ _ _ j
80 82 84 86 88 90 1991
- Wages --- Unemployment Effect
(cl) Finally, between 1981 and 1989, labourproductivity growth tended to contribute an average 5 percentage
points per annum to wage inflation. However, the sharp drop in productivity growth in 1990 and 1991 (from a trend growth of 4 per cent per annum to between zero and 2 per cent) served to depress wage inflation at the end of the decade.
In summary, the Irish price disinflation of the 1980s is almost totally explained by global price deflation and the relatively fixed exchange rate of the Irish pound within the EMS. The dominant force for wage disin-flation also came from world price disindisin-flation, par-ticularly when expectations adjusted to the lower and more stable world inflation environment. The inflationary effects of tax increases in the years to 1987 tended to be offset by the deflationary effects of rising unemployment (the so-called "Phillips curve" effect). The fall in productivity growth towards the end of the decade was probably associated with the resumed growth of the more labour-intensive traditional manu-facturing sector, together with an wider maturing of manufacturing after more than a decade of high-technology dominated growth.
The surprising finding is that the mechanism describing wage bargaining over the period of the 1960s and 1970s proved adequate and robust for explaining wage determination during what were widely perceived as innovative "corporatist" wage setting agreements of
(b)
Explanation of Wage Inflation Tax Wedge Component
21
Percentage Change
18
15
12
3
---3 ' - - - ' - - - ' - - - . . . J _ - 1 . . . _ . L . . _ _ _ J _ _ . . . L _ _ L . . _ _ _ L _ _ L _ _
80 82 84 86 88
- Wages · - - - Tax Wedge Effect
(d)
Explanation of Wage Inflation Productivity Component
21
Percentage Change
18
15
12
0 :
90 1991
-3 ' - - - ' - - - ' - - - . . . J _ - 1 . . . _ . L . . _ _ _ J _ _ . . . L _ _ L . . _ _ _ L _ __,____J
80 82 84 86 88 90 1991
- Wages · · - - Productivity Effect
the late 1980s. The stability and predictability of the world inflationary pressures probably assisted in the creation of the type of accurate expectations about the future which are so necessary in formulating and underpinning three-year pay deals. However, the benefits to the nation of the pay deal were probably associated more with industrial peace and stability rather than with strictly lower wage increases.
2.2.5 Employment and Unemployment
The number of people unemployed is the difference between total employment (or the demand for labour) and the total labour force (or the supply of labour). We have seen above that demand for labour fell precipitately during the years 1980-1987, and only picked up mildly by 1991. A net loss of over 33,000 jobs occurred over the period of the 1980s.
[image:20.587.47.546.76.434.2]~
r
I
IRECESSION AND RECOVERY: IRELAND IN THE 1980s (Figure 2.23), a cumulative loss of over 240,000 between 1980-91, about two thirds of whom were assumed to be of working age.
[image:21.589.56.270.97.467.2]Thousands
Figure 2.23 Net Emigration
50 ~ - - - .
40
30 20 10
-10
-20 =--_L___--'---'---'---'---'--'-'---__L_--'---~--'--~-'~ 1975 76
17 16 15 14
13
12 11
10
78 80 82 84 86
Figure 2.24 Unemployment Rate
88 1990
7 L _ _ _ L _ - - ' - - - ~ - " " = - - ' - ' - - - _ _ L _ - - ' - - - ~ - - ' - - ~ - ' - L _ _ J 1975 76 78 80 82 84 86 88 1990
The resulting rate of unemployment (numbers unemployed as a percentage of the labour force) is shown in Figure 2.24, where we use the Labour Force
Survey measure rather than the less accurate Live
Register, or entitlements based, measure. From a value of 7 .3 per cent in 1980 (a value that was even then considered high!), the unemployment rate rose by almost 10.5 points (or 141,000 persons) by 1987, and had only declined to 14 percent by April 1991. It is now, in 1991, beginning to rise again.
Figure 2.25
Irish-British Unemployment Rate Gap Percentage of Labour Force
4
3 f
2 1
1975 76 78 80 82 84 86 88 1990
11 The rise in unemployment was not unique to Ireland: to a greater or lesser extent all other OECD states also experienced some degree of deterioration in their rates of unemployment. Given the traditional links between Ireland and Great Britain, the destination of most Irish emigrants, we show in Figure 2.25 the difference between the Irish and British rates.
After a long period of stability in this differential in the 1960s and early 1970s, the improvement in it between 1977-80 (a period of rapid public and private sector employment growth in Ireland) was followed by a serious deterioration (to the extent of almost 10 points difference) in the period 1982-89. This was one of the main factors serving to attract emigrants from Ireland to the British labour market. For a further treatment of the forces determining Irish unemployment, and an evaluation of explanations offered, see the separate article later in this Review. ·
2.3 WORLD INFLUENCES DURING THE
1980s
Having described the performance of the economy during the 1980s, and suggested qualitative reasons for its behaviour, we now examine in more detail some of the key explanatory factors underlying Ireland's recession and recovery. These factors can be usefully considered under two headings:
(a) the impact of events in the world economy, and; (b) the role played by domestic policy aGtions.
In this section we examine world influences, and take up the policy issues in the next section. In both cases our methodology is as follows:
(i) we first take some aspect of the world or policy environment and propose changes from the his-torical path. For example, we eliminate the OPEC-II recession by constructing a more benign hypothetical growth path for OECD output (an external variable in the ESRI model);
(ii) we then recalculate the behaviour of the Irish economy on the basis of this changed hypothetical assumption;
(iii) this new behaviour is compared with the historical behaviour, and the isolated effect of the changed assumption can be isolated.
Such experiments are usually termed "counter-fac-tual" simulations of the model. However, if Irish poli-cymakers have little or no influence on the world economy, what is the point of carrying out counterfactual analysis where specific aspects of the world economic environment are changed? Two important justifications can be offered:
(a) it is interesting to be able to quantify the role played by world factors in order to study their transmission to Ireland. The counter-factual simulation enables this to be done;
In highly stylised terms, three particular deviations characterised the world economy of the 1980s:
[image:22.587.42.276.69.568.2](a) The low, even negative, growth in the main OECD economies in the early years, followed by a reasonably steady recovery, strong growth in the UK and USA cases (Figure 2.26).
Figure 2.26
World Growth Scenario OECD Industrial Output
8 Percentage Change
·2
.4~~-~~-~~-~~-~-~~~
1979 80 82 84 86 88 1990
- Actual - - - - Hypothetical
(b) The switch from negative real interest rates in the early part of the decade to high positive real rates in the latter part (Figure 2.27)
Percent
10 8
6
4 2 0 ·2 ·4 ·6
1980 82
Figure 2.27 Real Interest Rate Scenario
5-Year Bond Rate
84 86
- Actual ---- Hypothetical
88 1990
(c) The dramatic rise in the UK unemployment rate in the first half of the decade, followed by a steady fall to one of the lowest rates in the OECD by the end of the decade (Figure 2.28)
It is of interest to quantify the extent to which these deviations from trend behaviour influenced the Irish economy, and this is done using the ESRI model. The counterfactual assumptions used are also illustrated in Figures 2.26-2.28, as dotted lines. So, for example, the "alternative" world is characterised by steady positive growth and modest UK unemployment during the first half of the decade and lower real interest rates in the second half.
Figure 2.28
UK Unemployment Rate Scenario Percent of Labour Force
1 2 ~ - - - ~
86 88 90 1991
- Actual - · - - Hypothetical
It should be noted that simulations like these alter-native world scenarios are likely to push the ESRI model towards the limits of its reliability. As noted in the separate article on the model in this Review, making such radical changes to the external world economy would logically require changes in the very underlying structure of the model (the so called "Lucas" critique). In addition, making isolated specific changes to certain variables probably invalidates assumptions about other external variables. This means that our analysis provides a type of "ball-park" estimate of consequences of changes, and must be interpreted with caution. How-ever, no other approach can hope to identify these effects.
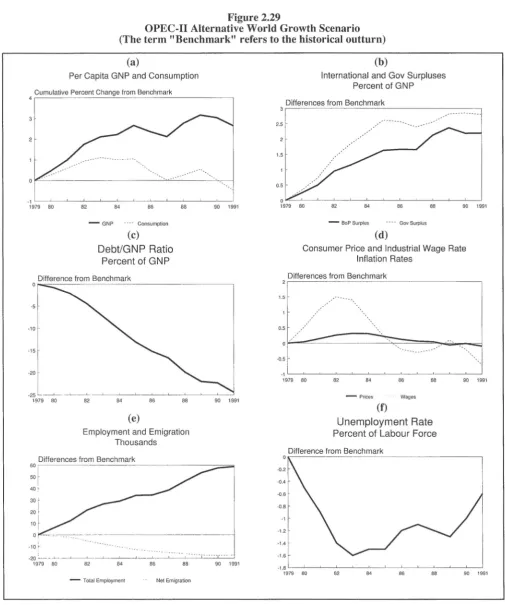
The Effects of Higher World Growth
We present our counter-factual simulation results in Figure 2.29 (a-f), in terms of deviations from the actual (or historical) outturn. We see that the elimination of the OPEC-II clown-turn in world growth (illustrated in Figure 2.26 above) would have been likely to have had a dramatic effect on the Irish economy. Since the population would have changed ( due to migration changes), we show in (a) the likely effects on GNP and consumption on a per capita basis. Both GNP and consumption could have been stimulated, the former by a cumulative 3 per cent by mid-decade.
The probable leakages out of the economy would have served to moderate the boost to personal disposable income, so there would probably have been little or no permanent improvement in per capita consumption. Both the government and international surpluses would have been greatly improved, by about 2.5 per cent of GNP (b ), with the debt/GNP ratio lower by over 20 percentage points of GNP by 1990 ( c).
Wage rates and prices would have been modestly higher in the first half of the decade, due mainly to the tighter labour market (i.e., higher employment, lower migration and lower unemployment), (d), (e) and (f).
I
RECESSION AND RECOVERY: IRELAND IN THE 1980s
Figure 2.29
OPEC-II Alternative World Growth Scenario (The term "Benchmark" refers to the historical outturn)
(a)
Per Capita GNP and Consumption
Cumulative Percent Change from Benchmark
4~- -- ---=---- - - -- - - -- ~
·1 ' - - ~ -- ' -- ~ ~ -~ - . . . L . . - ~- - '- - ' - - . . . L . . -' - - _ J
1979 80 82 84 86
- GNP · · · · Consumption
(c)
Debt/GNP Ratio Percent of GNP
Difference from Benchmark 0
-5
·10
-15
r
-20l
-25 _ __; __ . ...-l..-___________J_ _ __J_·-' '
-1979 BO 82 84 86
(e)
88
88
Employment and Emigration Thousands
Differences from Benchmark
90 1991
90 1991
60 , - --- - · - - - - -- - - - -- - - - = 50
f
I
40 ~
30
20
10
o,
I
·10 ~
·20 :.. ____ .__. ~~ ~ - -...L..- ~ - . 1 . - --~ - . . . L . . -' - -~ - - ' - ~
1979 80 82 84 86 88 90 1991
- Total Employment Net Emigration
(b)
International and Gov Surpluses Percent of GNP
Differences from Benchmark
3~ - -- -- - - -- - - -- - - -- ~
2.5
86 88 90 1991
- BoP Surplus · · · · Gov Surplus
(d)
Consumer Price and Industrial Wage Rate Inflation Rates
Differences from Benchmark
2~- - -- - -- - - -- - - -~
1.5
0.5
.---·0.5
-1 ' - - ~ - . . . L . . - ' - - ~- - ' - - ~- - ' - - ' - -~ ~ - - ' - - - '
1979 80 82 84 86 88
- Prices · · · Wages
(f)
Unemployment Rate Percent of Labour Force
Difference from Benchmark
90 1991
0,- - - - -- -- - - -- - - - ~
-0.6
·0.8
-1
·1.2
-1.4
-1.6
-1.8 ' - - ~- . . . L . . - ' - -~ · - - ' -- ~ - - ' - - ' - -~ ~ - - ' - - - ' 1979 80 82 84 86 88 90 1991
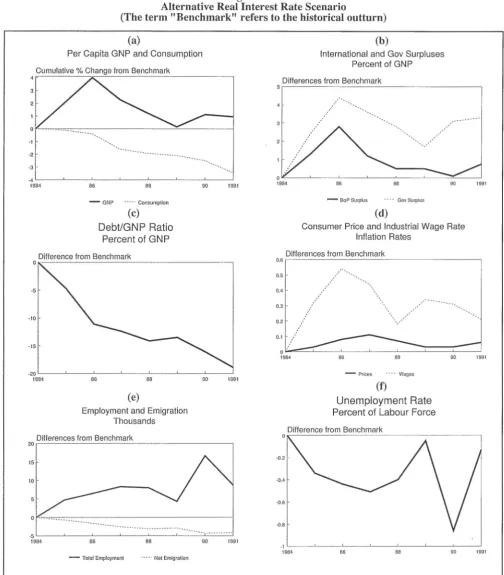
[image:23.591.43.548.116.721.2]The Effects of Lower Real Interest Rates
We saw in Figure 2.27 that real interest rates did not reach high positive values until 1983. In this coun-ter-factual simulation, for the period up to 1984, interest rat~s t~ke tl:eir historical values, and are only kept below their lustoncal values (at 4 per cent in real terms) from 1985 out.
As shown in Figure 2.30 (a-f), the effect on the
eco?<;nny would have been stimulatory, . The likely positive effect on growth, the improvement in the government and international balances and the lower-ing of the debt/GNP ratio are particularly apparent. The negative effect on consumption would have been due largely to the reduction in domestic payments of interest on the national debt which form a sizeable component of personal disposable income.
Figure 2.30
Alternative Real Interest Rate Scenario
(The term "Benchmark" refers to the historical outturn)
(a)
Per Capita GNP and Consumption
Cumulative % Change from Benchmark
4~---->.---"'--_:__:__~~ ~ - - - ~
3
2
0
·1
·2
·3 .
• 4
1984 86 88
- GNP · · · Consumption
(c)
Debt/GNP Ratio Percent of GNP
0
Difference from Benchmark
.5
·10
-15
90 1991
·2r9-84--~--