J. Range Manage.
55:150-163 March 2002
Bud viability in perennial grasses: Water stress and defoliation effects
ANDREA C. FLEMMER, CARLOS A. BUSSO,* AND OSVALDO A. FERNANDEZ
Authors are postdoctoral fellow of the Consejo Nacional de Investigaciones Cientificas y Tecnicas de la Republica Argentina (CONICET), CERZOS, Altos del Palihue, 8000 Bahia Blanca, Argentina; Full Professor, Departamento de Agronomia-CERZOS, Universidad Nacional del Sur (UNSur) and research scien- tist CONICET, Altos del Palihue, Bahia Blanca, and Consulting Professor, Departamento de Agronomia-CERZOS, UNSur and research scientist CONICET, Altos del Palihue, Bahia Blanca. Corresponding author: Departamento de Agronomia UNSur, Altos del Palihue, 8000-Bahia Blanca, Argentina; email=cebus- [email protected];fax 54-291-4595127; Phone 54-0291-4595102.
Abstract
Effects of the timing and frequency of defoliation under differ- ent levels of soil water availability were evaluated on bud meta- bolic activity and subsequent outgrowth in the desirable (i.e., palatable) Stipa clarazii Ball. and S. tenuis Phil. in competition with the undesirable (i.e., unpalatable) S. gynerioides Phil. Field studies on these native, perennial tussock grasses were conducted from 1995 to 1997 in temperate, semiarid Argentina. Our work- ing hypotheses were 1) axillary bud activation and subsequent tillering are lower under water stress than under higher soil moisture conditions in S. clarazii, S. tenuis, and S. gynerioides, 2) when compared to undefoliated controls, activation, and subse- quent outgrowth of axillary buds reach similar or greater values in S. clarazii and S. tenuis after early (vegetative stage of develop- ment), but not late (during internode elongation) defoliations or increased defoliation frequency (vegetative+ during internode elongation) during each growing cycle. Additionally, it was expected that the greatest reduction of axillary bud metabolic activity and outgrowth would ocurr on plants defoliated twice, and 3) axillary bud activation and succeeding tillering are greater in the undefoliated S. gynerioides when the desirable species are defoliated than when they remain undefoliated. With a few exceptions, our results led us to reject all 3 hypotheses.
Responses of axillary buds were in general specific to the species and treatments, to sampling time, and to the cumulative effects of previous treatments. This makes predictions of plant responses of these species under natural field conditions difficult, where they are often defoliated under water stress.
Key Words: Stipa clarazii, Stipa tenuis, Stipa gynerioides, bud metabolic activity, bud outgrowth, water stress, defoliation, perennial grasses, semiarid Argentina
Resumen
Se evaluo el efecto de la epoca y la frecuencia de defoliacion bajo distintos contenidos hidricos del suelo sobre la actividad metabolica de las yemas axilares y rebrote subsiguiente en las especies desables (palatables) S. clarazii Ball. y S. tenuis Phil. en competencia con la especie indeseable (no palatable) S. gyner- ioides Phil. Los estudios se efectuaron en el campo en estas especies de gramineas perennes nativas desde 1995 a 1997 en los pastizales templados, semiaridos de Argentina. Nuestras hipotesis de trabajo fueron 1) la activacion y rebrote subsiguiente de las yemas axilares son menores bajo condiciones de estres hidrico que bajo mayores contenidos hidricos del suelo en S. clarazii, S.
tenuis y S. gynerioides, 2) en comparacion a los controles no defo- liados, la activacion y rebrote subsiguiente de las yemas axilares alcanzan valores similares o mayores en S. clarazii y S. tenuis despues de defoliaciones tempranas (estadio fenologico vegetati- vo) pero no luego de defoliaciones tardias (durante la elongacion de los entrenudos) o ante una mayor frecuencia de defoliacion
(vegetativo+elongacion de entrenudos) en cada ciclo de crecimien- to. Ademas, se espero que la mayor reduccion en la actividad metabolica de las yemas axilares y rebrote subsiguiente se produ- jera en las plantas defoliadas con mayor frecuencia, y 3) la acti- vacion y subsiguiente rebrote de las yemas axilares son mayores en las plantas no defoliadas de S. gynerioides cuando las especies deseables son defoliadas que cuando permanecen sin defoliar.
Con unas pocas excepciones, las 3 hipotesis fueron rechazadas con los resultados obtenidos. Las respuestas de las yemas axilares fueron en general especificas a las especies y tratamientos, a la epoca de muestreo, y a los efectos acumulativos de tratamientos previos. Esto enfatiza la dificultad de predecir la respuesta de estas especies bajo condiciones naturales, en las que normalmente son defoliadas bajo condiciones de estres hidrico.
Succesive tiller production by the development of axillary buds compensates for annual tiller mortality, allowing persistence of perennial grasses (Jewis 1972). Production of new tillers, and of leaf blades, stems, and sheaths from remaining apical and inter- calary meristems after defoliation contributes to reestablishment of removed plant tissues (Briske 1991). However, regrowth will depend upon activation and subsequent outgrowth of axillary buds when most, if not all, apical and intercalary meristems are
Manuscript accepted 9 Jul. 2001.
removed by defoliation (Busso et al. 1989). Any factor, such as water stress, which decreases availability, metabolic activity or capacity to grow out of axillary buds would limit reestablishment of photosynthetic canopy of grazed perennial grasses, compro- mising their persistence in the plant community (Briske and Richards 1995).
Tiller production can be lower on defoliated than on undefoliated plants in perennial grasses exposed to water stress, rainfed or irrigat- ed conditions (Busso et al. 1989, Deregibus and Trlica 1990, Bullock et al. 1994, Hendrickson and Briske 1997). Water stress can also reduce tiller production in defoliated and undefoliated plants; this response has been observed under natural droughts (Bullock et al.
150 JOURNAL OF RANGE MANAGEMENT 55(2) March 2002
1994, Briske and Hendrickson 1998) or con- trolled environmental conditions (Busso et al. 1989). Mueller and Richards (1986) and Busso et al. (1989) suggested that the degree of bud metabolic activity would be compara- tively more important than bud number or viability in explaining reduced tiller produc- tion after defoliation with or without water stress.
Timing of defoliation can also influence tiller production. For example, tiller pro- duction was stimulated by defoliation dur- ing internode elongation, but not during earlier growth stages in Agropyron deser- torum (Fisch, ex Link) Schult. (Olson and Richards 1988). This response is partially due to apical meristem removal which stimulates axillary bud activation after eliminating the inhibition source (Murphy and Briske 1992). However, lack of apical meristem removal has also stimulated tiller production on defoliated plants (Deregibus and Trlica 1990). In addition to direct inhibitory effects of the apical meristem on bud outgrowth, both physiological mecha- nisms and their interaction with environ- mental variables and resource availability should be considered when studying fac- tors involved in regulating tillering in perennial grasses (Murphy and Briske 1992). For example, bud activation and subsequent outgrowth can be stimulated or suppressed by modifying light quality and quantitity at the plant stem bases (Casal et al. 1986, Deregibus and Trlica 1990, Devkota et a!.1997, Gautier et al. 1999).
Knowledge of axillary bud dynamics is essential when considering production and persistence of perennial grasses in the plant community. A few studies have eval- uated the effects of various biotic and abi- otic factors on this important component of plant growth and development. For example, they include evaluation of defo- liation at different phenological stages (Stipa tenuis Phil. and Piptochaetium napostaense (Speg.) Hack: Becker et al.
1997), water stress with or without defoli- ation (Agropyron species: Busso et al.
1989), and fire (S. tenuis: Busso et al.
1993; S. tenuis, S. gynerioides Phil. and P.
napostaense: Pelaez et al. 1997). The objective of this study was to evaluate the effects of defoliation at different pheno- logical stages and under different levels of soil water availability on the degree of bud metabolic activity and bud outgrowth in 3
perennial grasses: Stipa clarazii Ball., S.
tenuis and S. gynerioides. Stipa clarazii and S. tenuis are 2 desirable, palatable species which compete with the undesir- able, unpalatable S. gynerioides in the semiarid, temperate rangelands of Central Argentina. We hypothesized that activa- tion of axillary buds and succeeding tiller-
ing 1) would be lower under water stress than under more favorable soil moisture conditions in S. clarazii, S. tenuis, and S.
gynerioides, 2) when compared with unde- foliated controls, would reach similar or greater values in S. clarazii and S. tenuis after early (vegetative stage of develop- ment), but not late (during internode elonga- tion) defoliations or increased defoliation frequency (vegetative+ during internode elongation ) during each growing cycle.
Additionally, we expected that the greatest reduction of the studied plant variables would ocurr on plants defoliated twice, and 3) would be greater in the undefoliated S.
gynerioides when the desirable species are defoliated than when they are not. However, values for these parameters in S. gyner- ioides will be greater after late or more fre- quent than early defoliations of Stipa clarazii and S. tenuis. Results of this study are important to gain understanding of the
160 h)
120
00
Q
16
S
4
a
Rainfall a'
,Ik
-. .GD
- G)
L!
,., G
wind speed
responses of these species to the most com- mon disturbances at the study region: graz- ing under water stress conditions.
Materials and Methods Study Site
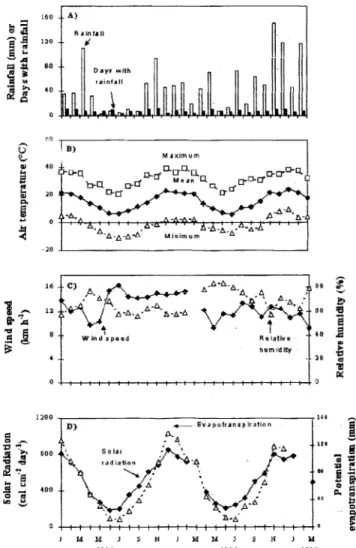
This study was conducted at the research field site of the Agronomy Department-CERZOS in Bahia Blanca (38° 48'S, 62° 13'W) during 1995, 1996, and early 1997. Soil is a typical Haplustol (Luis Sanchez, Dpto. Agronomia UNSur, pers. comm.) with a petrocalcic horizon at 1.8 m depth. A meteorological station at the experimental site measured rainfall, air
temperature, relative humidity, wind speed, solar radiation, and potential evapo- transpiration (Fig. 1).
n
1k
as
4
40
Relative tQ humidify
20
Fig. 1. A) Monthly rainfall (mm) and number of rainy days, B) Absolute minimum and maximum and mean monthly air temperatures (°C) to 0,25 m above the soil surface, C) Mean monthly wind speed (km houf1) to 2 m above the soil surface and mean monthly relative humidity (%), and D) Mean monthly solar radiation (cal cm 2 day'') and potential evapotranspiration (mm, Thornthwaite) during 1995, 1996 and early 1997. Measurements were taken using a meteorolog- ical station located 100 m away from the experimental plots.
JOURNAL OF RANGE MANAGEMENT 55(2) March 151
Plant material
Studies were conducted on Stipa clarazii Ball., S. tenuis Phil, and S. gyner- ioides Phil., all C3 perennial grasses native to the South of the Calden Phytogeo- graphical District, a region of about 4 mil- lion hectares in Central Argentina. The first 2 species have a high forage value whereas the latter is an undesirable, unpre-
ferred tussock grass (Cano 1988).
Tillering starts with fall rains in all 3
species, although it extends into winter, spring, and even summer if rainfalls are abundant (Giorgetti et al. 2000). Recent studies have shown that S. clarazii has a greater competitive ability and tolerance to defoliation than S. tenuis (Saint Pierre et al. 2000a, 2000b) and the undesirable species Stipa trichotoma Nees, S. gyneri- oides, and Stipa ambigua Speg. (Moretto and Distel 1997, Saint Pierre et al. 2000a, 2000b).
Experimental design
During December 1993-April 1994, 28 experimental plots (1.8 x 1.8 m) were established at the field site from trans- plants on unplowed, weeded soil.
Distance among plots was 4 m. Plants were obtained from a 20 year-exclosure to domestic animals located southeast of La Pampa Province (38° 455, 63° 45'W) at the South of the Calden Phytogeographical Region. Plants of the 3 species were placed 30 cm from one another in inter- secting rows forming a matrix where each plant of S. clarazii and S. tenuis was sur- rounded by 4 plants of S. gynerioides.
Desirable species plants were always pre- sent at each plot vertex. This matrix con- tributed to uniform competitive effects among plants. Plant responses within a plant community are better explained by using plants growing with nearby, compet- itive neighbors than by utilizing plants growing in isolation (Mueggler 1972, McNaughton 1992). There were 49 plants on each plot (12 of S. clarazii, 12 of S.
tenuis and 25 of S. gynerioides) making a total of 1372 transplants for the whole study. At the time of transplanting, plant diameters at crown level were 13.47 ± 0.56 cm (X± 1 SE, n = 56) for S. clarazii, 10.02 ± 0.51 cm for S. tenuis, and 12.27 ± 0.61 cm for S. gynerioides. In January
1995, during the plant quiescent period, all tussocks of S. clarazii and S. tenuis were manually clipped leaving 5 cm stubble height. In this manner, only current year growth was included in subsequent har- vests to determine biomass. Two experi- mental plots (replicates) were randomly assigned to each water level x defoliation
Water levels t efoliatian 1995
treatment JFMAMJJASOND
Rainfod (*)
Irrigation (s*
Control V
E VE
Control V
E VE
i
I
1 I
8/5 10/30
I
1 I
Water stress at V (**)
4/12 6110
Control V
Water stress at E Control
E
11995
J F M A M J J A S 0 N B
4/21 10126
f
4121
716
I
8/19 10/26
W ater stress at VE
Control 4}12 10/13
I4/21 10i26
VE
I I(*) Rainfall
J ,(**) Irrigation
,(***) Water stress
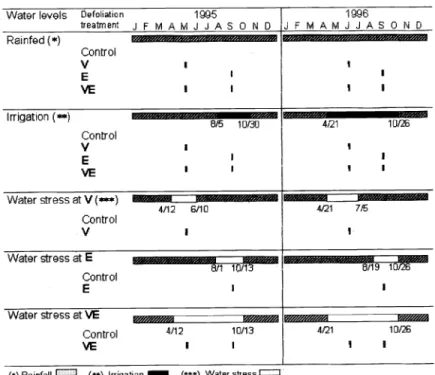
Fig. 2. Periods of imposition of the different water levels and timing of defoliation (indicated as vertical solid bars) at the vegetative (V), internode elongation (E) or both (VE) phenological stages in 1995 and 1996.
treatment combination, giving a total of 14
treatments (see Water levels and Defoliation treatment headings in Fig. 2).
Measurements during the 3 growing seasons were repeated measures on the same groups of plants. Thus, we report on the cumulative effects of several water and defoliation treatments. Since we worked with an enormous unit of work, labor, and budget constraints made replication of our study in space and time impossible.
Despite the fact that we place emphasis on statistical differences, caution is called for extrapolating our results. These should be better viewed under the specific conditions they were obtained. However, our study provided a unique opportunity for a simul- taneous comparison of plant responses to various water levels, and to the timing and frequency of defoliation on species having differences in competitive ability.
Treatments Soil water levels
Timing of application of water level and defoliation treatments during each year is shown in Fig. 2. A set of plots received rainfall all year round (rainfed plots).
Irrigated plots received rainfall plus addi- tional water with a drip irrigation system.
In the irrigated treatment, plots were watered whenever soil moisture content dropped below 60% of field capacity as determined with soil tensiometers. The amount of water added to these plots was
r
calculated using software (Smith 1992, 1993) which accounted for soil and cli- mate characteristics at the study site, and plant characteristics of species similar to those investigated. Water-stressed plots were covered with transparent plastic sheets (0.2 mm thick) whenever rain fell during the vegetative (V) or early intern- ode elongation (E) or VE phenological stage of development (Fig. 2). Plants are often exposed to water stress conditions during any of these periods in their natural environment (Busso 1997, Fernandez and Busso 1999). Plastic sheets were mounted on a specially designed wooden structure that provided an open-sided rain shelter.
Lateral movement of water into the water- stressed plots was prevented by surround- ing these plots with plastic sheets (0.2 mm thick) up to 1.8 m depth. Plants were exposed to water stress before, during and until 3 weeks after application of the defo- liation treatments.
Except for plots exposed to water stress in the VE stage, the amount of water received when the different water levels were imposed (mid-April to mid-October in 1995 and late-April to late-October in 1996) was 373.2 mm in 1995 and 305.4 mm in 1996 in the irrigated plots, 87.2 mm in 1995 and 252.4 mm in 1996 in the rainfed plots, 76.4 mm in 1995 and 172.6 mm in 1996 after alleviation of water stress in the V stage, and 22.0 mm in 1995 and 133.2 mm in 1996 before imposition
152 JOURNAL OF RANGE MANAGEMENT 55(2) March 2002
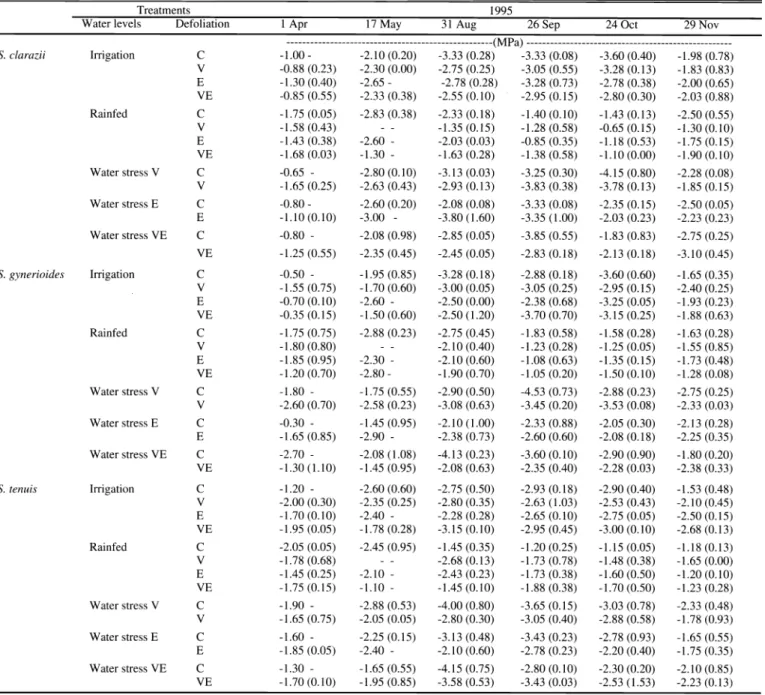
Table 1. Midday leaf water potential (MPa) on plants of S. clarazii, S. gynerioides and S. tenuis during 1995. Stipa clarazii and S. tenuis were either defoliated or remained undefoliated (Controls: C) at the vegetative (V), internode elongation (E) or both phenological stages (VE) under rainfed, irrigated or water stress conditions. Plants of S. gynerioides grew in competition with the other 2 species but remained undefoliated. Each value is the mean (+1-SE) of n=2. Values without SE come from n=1.
Treatments 1995
Water levels Defoliation
1Apr May Aug Sep Oct Nov
---(MPa) ---
S. clarazii Irrigation C (0.20) (0.28)
V -2.30 (0.55)
E (0.28)
VE (0.10) (0.15)
Rainfed C (0.05) (0.38) (0.10)
V (0.15) (0.58)
E -1.43 (0.38) -2.60 - -2.03 (0.03) -0.85 (0.35) -1.18 (0.53) -1.75 (0.15) VE -1.68 (0.03) -1.30 - -1.63 (0.28) -1.38 (0.58) -1.10 (0.00) -1.90 (0.10) Water stress V C -0.65 - -2.80 (0.10) -3.13 (0.03) -3.25 (0.30) -4.15 (0.80) -2.28 (0.08) V -1.65 (0.25) -2.63 (0.43) -2.93 (0.13) -3.83 (0.38) -3.78 (0.13) -1.85 (0.15) Water stress E C -0.80 - -2.60 (0.20) -2.08 (0.08) -3.33 (0.08) -2.35 (0.15) -2.50 (0.05) E -1.10(0.10) -3.00 - -3.80 (1.60) -3.35 (1.00) -2.03 (0.23) -2.23 (0.23) Water stress VE C -0.80 - -2.08 (0.98) -2.85 (0.05) -3.85 (0.55) -1.83 (0.83) -2.75 (0.25) VE -1.25 (0.55) -2.35 (0.45) -2.45 (0.05) -2.83 (0.18) -2.13 (0.18) -3.10 (0.45)
S. gynerioides Irrigation C -0.50 - -1.95 (0.85) -3.28 (0.18) -2.88 (0.18) -3.60 (0.60) -1.65 (0.35) V -1.55 (0.75) -1.70 (0.60) -3.00 (0.05) -3.05 (0.25) -2.95 (0.15) -2.40 (0.25) E -0.70 (0.10) -2.60 - -2.50 (0.00) -2.38 (0.68) -3.25 (0.05) -1.93 (0.23) VE -0.35 (0.15) -1.50 (0.60) -2.50 (1.20) -3.70 (0.70) -3.15 (0.25) -1.88 (0.63) Rainfed C -1.75 (0.75) -2.88 (0.23) -2.75 (0.45) -1.83 (0.58) -1.58 (0.28) -1.63 (0.28) V -1.80 (0.80) - - -2.10 (0.40) -1.23 (0.28) -1.25 (0.05) -1.55 (0.85) E -1.85 (0.95) -2.30 - -2.10 (0.60) -1.08 (0.63) -1.35 (0.15) -1.73 (0.48) VE -1.20 (0.70) -2.80 - -1.90 (0.70) -1.05 (0.20) -1.50 (0.10) -1.28 (0.08) Water stress V C -1.80 - -1.75 (0.55) -2.90 (0.50) -4.53 (0.73) -2.88 (0.23) -2.75 (0.25) V -2.60 (0.70) -2.58 (0.23) -3.08 (0.63) -3.45 (0.20) -3.53 (0.08) -2.33 (0.03) Water stress E C -0.30 - -1.45 (0.95) -2.10 (1.00) -2.33 (0.88) -2.05 (0.30) -2.13 (0.28) E -1.65 (0.85) -2.90 - -2.38 (0.73) -2.60 (0.60) -2.08 (0.18) -2.25 (0.35) Water stress VE C -2.70 - -2.08 (1.08) -4.13 (0.23) -3.60 (0.10) -2.90 (0.90) -1.80 (0.20) VE -1.30 (1.10) -1.45 (0.95) -2.08 (0.63) -2.35 (0.40) -2.28 (0.03) -2.38 (0.33)
S. tenuis Irrigation C -1.20 - -2.60 (0.60) -2.75 (0.50) -2.93 (0.18) -2.90 (0.40) -1.53 (0.48) V -2.00 (0.30) -2.35 (0.25) -2.80 (0.35) -2.63 (1.03) -2.53 (0.43) -2.10 (0.45) E -1.70 (0.10) -2.40 - -2.28 (0.28) -2.65 (0.10) -2.75 (0.05) -2.50 (0.15) VE -1.95 (0.05) -1.78 (0.28) -3.15 (0.10) -2.95 (0.45) -3.00 (0.10) -2.68 (0.13) Rainfed C -2.05 (0.05) -2.45 (0.95) -1.45 (0.35) -1.20 (0.25) -1.15 (0.05) -1.18 (0.13)
V -1.78 (0.68) - - -2.68 (0.13) -1.73 (0.78) -1.48 (0.38) -1.65 (0.00)
E -1.45 (0.25) -2.10 - -2.43 (0.23) -1.73 (0.38) -1.60 (0.50) -1.20 (0.10) VE -1.75 (0.15) -1.10 - -1.45 (0.10) -1.88 (0.38) -1.70 (0.50) -1.23 (0.28) Water stress V C -1.90 - -2.88 (0.53) -4.00 (0.80) -3.65 (0.15) -3.03 (0.78) -2.33 (0.48) V -1.65 (0.75) -2.05 (0.05) -2.80 (0.30) -3.05 (0.40) -2.88 (0.58) -1.78 (0.93) Water stress E C -1.60 - -2.25 (0.15) -3.13 (0.48) -3.43 (0.23) -2.78 (0.93) -1.65 (0.55) E -1.85 (0.05) -2.40 - -2.10 (0.60) -2.78 (0.23) -2.20 (0.40) -1.75 (0.35) Water stress VE C -1.30 - -1.65 (0.55) -4.15 (0.75) -2.80 (0.10) -2.30 (0.20) -2.10 (0.85) VE -1.70 (0.10) -1.95 (0.85) -3.58 (0.53) -3.43 (0.03) -2.53 (1.53) -2.23 (0.13)
of water stress at the E stage. Thereafter, all 28 experimental plots received 313.7 mm from mid-October 1995 to late-April 1996, and 487.8 mm from late-October
1996 to March 1997.
Defoliation treatments
Within each water level, plants of S.
clarazii and S. tenuis remained undefoliat- ed (Controls: C) or were defoliated at either V or E or VE stage of development during 1995 and 1996. Clipping left 5-7
cm stubble height on 23 May (V) or 27 September (E) in 1995, and 12 June (V) or 20 September (E) in 1996 (Fig. 2). Stipa gynerioides was not defoliated in 1995 and 1996 since it is not consumed by cat- tle (Cano 1988, Moretto and Distel 1997).
However, all plants of this species were clipped to 5-7 cm stubble height at the end of the study (12 March 1997) to deter- mine biomass production in the different treatments.
Leaf water potential
Determinations of leaf water potential provided a measure of plant water stress.
Mid-day leaf water potential was periodi- cally measured in all species using a pres- sure chamber during 1995, 1996 and early 1997 (Waring and Cleary 1967).
Youngest, fully expanded leaves were taken for these measurements; one tiller was used per species and replicate on each sampling date. Leaves were kept in a plas- tic bag from excision to end of each deter- mination to reduce water loss (Turner
1987).
JOURNAL OF RANGE MANAGEMENT 55(2) March 153
Table 2. Midday leaf water potential (MPa) on plants of S. clarazii, S. gynerioides and S. tenuis during 1996 and early 1997. Stipa clarazii and S. tenuis were either defoliated or remained undefoliated (Controls: C) at the vegetative (V), internode elongation (E) or both phenological stages (VE) under rainfed, irrigated or water stress conditions during 1996. These plants had been defoliated under these water levels during 1995. Plants of S. gyneri- oides grew in competition with the other 2 species but remained undefoliated. Plants of all 3 species received natural rainfall during early 1997. Each value is the mean (+l-SE) of n=2.
Treatments 1996 1997
Water levels Defoliation 19 Apr Jun Sep Nov Dec Feb
---(MPa) ---
S. clarazii Irrigation C (0.45) (0.45) (0.13) - (0.18) (0.25)
V -1.40 (0.10) (0.13) (0.15) (0.38) - (0.10) (0.30)
E -1.68 (0.08) (0.73) (0.23) (0.35) - (0.38) (0.05)
VE -1.30 (0.20) (0.53) (0.28) (0.55) - (0.70) (0.05)
Rainfed C -1.53 (0.28) (0.65) (0.10) (0.45) (0.45)
V -1.73 (0.28) (0.43) (0.15) (0.00) (0.55) (0.40)
E -2.05 (0.25) (0.45) (0.25) (0.05) (0.55) (0.75)
VE -1.93 (0.23) (0.28) (0.70) (0.10) (0.20) (0.05)
Water stress V C -2.38 (0.35) (0.28) (0.30) - (0.43) (0.25)
V -2.15 (0.35) (0.48) (0.33) (0.20) - (0.20) (0.45)
Water stress E C -2.00 (0.20) (0.10) (0.05) (0.35) (0.30) (0.10)
E -1.85 (0.50) (0.15) (0.18) (1.65) (0.80) (0.35) (0.25)
Water stress VE C -2.48 (0.03) (0.10) (0.05) (0.50) (0.28) (0.15)
VE -1.68 (0.44) (0.38) (0.03) (0.18) (0.23) (0.30) (0.20)
S. gynerioides Irrigation C (1.18) (0.60) (0.03) - (0.15) (0.30)
V -1.70 (0.10) (0.05) (0.85) (0.20) - (0.05) (0.05)
E -1.95 (0.80) (0.55) (0.60) (0.18) - (0.15) (0.45)
VE -1.25 (0.15) (0.65) (0.68) (0.03) - (0.38) (0.40)
Rainfed C -1.48 (0.00) (0.45) (0.30) (0.08) (0.45) (0.30)
V -1.78 (0.38) (0.10) (0.00) (0.20) (0.65) (0.00) (0.30)
E -2.33 (0.13) (0.38) (0.08) (0.15) (0.35) (0.55) (0.80)
VE -1.43 (0.43) (0.38) (0.23) (0.05) (0.45) (0.03) (0.20)
Water stress V C -2.25 (0.75) (0.23) (0.08) - (0.03) (0.65)
V -1.43 (0.18) (0.60) (0.50) (0.03) - (0.20) (0.40)
Water stress E C -1.45 (0.08) (0.30) (0.10) (0.28) (0.13) (0.35)
E -1.85 (0.05) (0.13) (0.50) (2.45) (0.60) (0.43) (0.28)
Water stress VE C -1.80 (0.15) (0.15) (0.75) (1.33) (0.13) (0.30)
VE -2.15 (0.55) (0.85) (0.15) (1.00) (0.35) (0.15) (0.75)
S. tenuis Irrigation C (0.45) (0.03) (0.10) - (0.18) (0.13)
V -2.10 (0.05) (0.70) (0.10) (0.30) - (0.05) (0.70)
E -2.08 (0.18) (0.33) (0.45) (0.05) - (0.13) (0.35)
VE -1.85 (0.45) (0.78) (0.60) (0.00) - (0.30) (0.00)
Rainfed C -2.10 (0.83) (0.35) (0.25) (1.20) (0.25) (0.35)
V -1.63 (0.28) (0.38) (0.00) (0.00) (0.70) (0.28) (0.15)
E -2.00 (0.20) (0.05) (0.45) (0.20) (0.20) (0.13) (0.00)
VE -2.40 (0.50) (0.05) (0.35) (0.20) (0.50) (0.33) (0.28)
Water stress V C -2.13 (0.10) (0.13) (0.10) - (0.30) (0.68)
V -1.60 (0.20) (0.45) (0.28) (0.28) - (0.20) (1.05)
Water stress E C -2.30 (0.03) (0.13) (0.05) (0.65) (0.25) (0.50)
E -2.10 (0.35) (0.03) (0.03) (1.25) (0.73) (0.10) (0.29)
Water stress VE C -1.90 (0.50) (0.35) (0.15) (1.75) (1.15) (0.00)
VE -2.05 (0.55) (0.60) (0.38) (0.63) (0.13) (0.10) (0.30)
Bud metabolic activity and axillary bud outgrowth
These variables were evaluated on par- ent tillers produced during each growing season. At each observation date, 2 to 4
tillers were harvested per plant of S.
clarazii, S. tenuis, or S. gynerioides; one plant was used per replicate in all treat- ments. Crown samples were maintained at 4°C until dissection. Number, metabolic activity, and outgrowth of axillary buds were determined on each tiller under a
binocular microscope. Three bud cate- gories were considered: metabolically active (MAB), dormant or dead (DDB), and buds which grew out originating daughter tillers (DT). Total bud number (TBN) was calculated as MAB+DDB+DT.
The potential maximum number of buds per stem base (total node number = TN) was calculated as MAB+DDB+DT+num- ber of foliar scars. Font Quer (1982) reported that this number is equivalent to the number of produced leaves. Foliar
scars indicate presence of leaves which do not have buds or daughter tillers in their axilla (Hendrickson and Briske 1997).
Metabolic activity of axillary buds was determined using Triphenyl Tetrazolium Chloride (TTC) following Busso et al.
(1989). Each stem base was longitudinally cut leaving entire buds at both sides of the cutting. Both halves were maintained in a solution of 0.6% (weight/volume) TTC- 0.05 M Phosphate buffer (pH = 7.38) dur- ing 15 hours in darkness at 30°C.
154 JOURNAL OF RANGE MANAGEMENT 55(2) March 2002
Metabolically active buds were those whose apex stained pink or red indicating enzymatic reduction of colourless tetra- zolium salt to red, insoluble formazan.
Buds not-stained with TTC were consid- ered dormant or dead.
Statistical analysis
Leaf water potentials were analyzed separately for each date using ANOVA. A split plot design was used with treatments (14 combinations of water x defoliation levels) as main factors and species as sec- ondary factors. One-way ANOVA was used to analyze the bud metabolic activity data; analysis was performed separately for each date and species using a com- pletely randomized design with 14 treat- ments. Whenever F tests were significant at p < 0.05, means were separated using Fisher LSD or Tukey-Kramer test for bal- anced or unbalanced data, respectively.
Values for MAB and DDB were trans- formed to Ix+1 to improve normality assumptions (Steel and Torrie 1985). Non-
transformed values are presented in
Figures.
Results and Discussion Leaf water potentials
During 1995, 1996, and early 1997, leaf water potentials were similar (p > 0.25) among defoliation treatments within each water level in all 3 species (Tables 1 and 2). These results are similar to those of Becker et al. (1997) and Busso and Richards (1993) in these and other peren- nial grasses. Other studies, however, have reported higher leaf water potentials on defoliated than on undefoliated perennial tussock grasses (Briske and Anderson
1990, Brown 1995, Williams et al. 1998).
This positive response to herbivory has been attributed to a reduced transpiratory leaf surface area after defoliation which would conserve soil water (Anderson and Briske 1995, Brown 1995).
At the beginning and end of each grow- ing cycle, leaf water potential was similar (p > 0.25) among water levels in S.
clarazii, S. tennis and S. gynerioides. In August, September, and October 1995, however, these species had lower (p <
0.05) leaf water potentials under water stress than under irrigated conditions.
Similar results were obtained in 1996 dur- ing this period, except on plants of the desirable species by the end of September (p>0.15). Leaf water potentials were more variable on plants of the 3 species in the ranfed plots. Under these conditions, leaf
Table 3. Number of total nodes (TN), buds which originated daughter tillers (DT), and metabolically active (MAB) and dead and dormant (DDB) buds on parent tillers of S. gynerioides at the different treatments in 1995, 1996 and early 1997. C: Undefoliated controls, and defoliation at the vegetative (V), internode elongation (E) or both phenological stages (VE). Each value is the mean (+/-SE) of n=2.
Treatments
Dates Water levels Defoliation TN DT
23/5/95 Irrigation C (0.25)
V 5.75 (0.75) 0.50 (0.00)
VE 8.00 (0.00) 0.00 (0.00)
Rainfed C 7.00 0.00 (0.00)
V 7.75 (1.25) (0.25)
VE 7.25 (1.25) (0.25)
Water stress V C 6.75 0.75 (0.75)
V 7.75 (0.25) 0.25
Water stress VE C 8.25 1.00
VE 6.25 (0.75) (0.00)
7/9/95 Irrigation C (0.13)
V 7.25 (2.00) (0.38)
VE 6.25 (0.50) (0.38)
Rainfed C 7.25 (0.25)
V 5.88 (0.63) (0.00)
VE 7.13 (1.13) (0.04)
Water stress V C 6.50 (0.50)
V 8.08 (0.58) (0.46)
Water stress VE C 6.42 (0.42)
VE 7.75 (0.00) (0.38)
27/9/95 Irrigation C 0.38 (0.13)
E 7.88 (0.13) (0.38)
VE 8.88 (0.13) (0.00)
Rainfed C 8.00 (0.50)
E 9.13 (0.38) (0.13)
VE 8.50 (1.00) (0.25)
Water stress E C 7.75 (0.00)
E 7.88 (0.38) (0.13)
Water stress VE C 7.50 (0.13)
VE 9.63 (0.13) (0.38)
14/12/95 Irrigation C (0.00)
E 7.75 (0.75) (0.00)
VE 7.13 (0.38) (0.00)
Rainfed C 7.63 (0.13)
E 8.63 (1.38) 0.25 (0.25)
Water stress E C 7.88 (0.00)
E 7.88 (0.63) (0.00)
Water stress VE C 8.25 (0.00)
VE 6.88 (0.63) (0.00)
25/4/96 Irrigation C (0.25)
V 7.25 (0.25) (0.25)
E 6.50 (0.00) (0.25)
VE 8.25 (0.25) (0.25)
Rainfed C 6.75 (0.00)
V 7.00 (0.50) (0.00)
E 7.25 (1.25) (0.25)
VE 7.75 (0.25) (0.50)
Water stress V C 6.75 (0.50)
V 7.00 (1.00) 0.50 (0.50)
Water stress VE C 7.00 (0.25)
VE 7.50 (1.00) (0.25)
1216196 Irrigation C (0.13)
V 10.00 (0.25) (0.25)
VE 8.63 (0.13) (0.13)
Rainfed C 7.63 (0.50)
V 8.63 (0.88) (0.63)
VE 8.50 (0.00) (0.63)
Water stress V C 8.25 (0.13)
V 8.50 (1.00) (0.75)
(Continued on page 156)
JOURNAL OF RANGE MANAGEMENT 55(2) March 155
Table 3. Continued.
Treatments
Dates Water levels Defoliation TN DT
Water stress VE C 7.88 (0.13)
VE 9.38 (0.88) (0.00)
3017196 Irrigation C 8.00 (0.00)
V 8.25 (0.00) (0.00)
VE 7.63 (0.38) (0.38)
Rainfed C 8.25 (0.13)
V 8.88 (0.63) (0.25)
VE 8.25 (1.00) (0.50)
Water stress V C 8.00 (0.63)
V 7.63 (0.13) (0.88)
Water stress VE C 9.25 1.00 (0.25)
VE 8.25 (0.50) (0.13)
2119196 Irrigation
,C 8.13 (0.13)
E 8.13 (0.38) (0.13)
VE 8.00 (0.25) (0.25)
Rainfed C 8.75 0.13 (0.13)
E 8.13 (0.13) (0.25)
VE 8.88 (0.13) (0.63)
Water stress E C 9.63 (0.13)
E 8.25 (0.25) (0.63)
Water stress VE C 8.88 (0.63)
VE 7 88 38) 2 0 63)
30/10/96 Irrigation C
.
7.88
.
(0.13)
.
1.38
.
0.00 (0.00)
.
V 8.63 (0.63) (0.13)
E - - - -
VE 7.75 (0.50) (0.00)
Rainfed C 7.88 (0.00)
V 7.50 (0.25) 0.13 (0.13)
E 8.50 (0.75) (0.38)
VE 9.63 (0.38) 0.13 (0.13)
Water stress V C 7.63 (0.00)
V 8.63 (0.13) (0.00)
Water stress VE C 8.25 (0.25)
VE 8.63 (0.38) (0.13)
7/1/97 Irrigation C 6.88 (0.00)
V 6.38 (0.13) (0.00)
E 6.50 (0.50) (0.00)
VE 6.75 (0.25) (0.13)
Rainfed C 6.75 (0.13)
V 7.63 (0.63) (0.00)
E 6.88 (0.88) (0.00)
VE 6.75 (0.75) (0.13)
Water stress V C 6.63 (0.00)
V 6.25 (0.25) (0.25)
Water Stress E C 7.25 (0.00)
E 8.13 (1.38) (0.13)
Water stress VE C 9.46 0.29 (0.04)
VE 9.09 (0.58) (0.00)
12/3/97 Irrigation C 7.13 (0.00)
V 6.75 (0.00) (0.00)
E 6.96 (0.29) (0.25)
VE 6.63 (0.38) (0.13)
Rainfed C 6.13 0.13 (0.13)
V 6.88 (0.63) (0.38)
E 7.00 (0.75) (0.13)
VE 6.25 (0.25) (0.25)
Water stress V C 6.25 0.25 (0.25)
V 7.38 (0.13) (0.00)
Water stress E C 6.63 (0.00)
E 7.50 (0.50) (0.13)
Water stress VE C 7.38 (0.13)
VE 7.50 (0.75) (0.00)
water potentials were lower (p < 0 .05) than those in the irrigated plots in 1995, and higher (p < 0.05) than those in the water-stressed plots in 1996 (Tables 1 and 2). This was very likely due to the lower annual rainfall in 1995 (447.2 mm) than in
1996 (621.3 mm) (Fig. 1).
In 1995, leaf water potential on average for all treatments was similar (p > 0.25) among species, except in April when this
variable was higher (p < 0.05) in S.
clarazii than in S. tennis. Plants of the desirable species had higher (p < 0.05) leaf water potentials than S. gynerioides in mid-August, September, and December in
1996 (Tables 1 and 2).
Bud metabolic activity and axillary bud outgrowth
On average for each date and species, between 62 and 82% of the total number of nodes had daughter tillers, metabolical- ly active buds or dormant or dead buds on parent tillers. This indicates that not all leaves possess axillary buds which is simi- lar to results of Mueller and Richaxds (1986) and Hendrickson and Briske (1997) on other perennial grasses.
Numbers of total nodes, daughter tillers, and metabolically active or dormant or dead buds were similar (p > 0.10) between defoliation treatments and water levels during 1995, 1996, and early 1997 on par- ent tillers of S. gynerioides (Table 3). This implies that neither axillary bud activation nor initial outgrowth would contribute to explain the observed release from compe- tition of S. gynerioides after selective defoliation of S. clarazii (Moretto and Distel 1999) and S. clarazii and S. tenuis (Flemmer 2000). These results also show the lack of sensitivity of axillary buds in S.
gynerioides to water stress, a common abi- otic factor to which plants are exposed in the temperate, central semiarid rangelands of Argentina (Busso 1997, Fernandez and Busso 1999). Axillary buds of this species, however, are suceptible to fire (Distel and
Boo 1996, Pelaez 2000).
Total node number, and numbers of daughter tillers, and metabolically active or dormant or dead buds were also similar (p > 0.25) in all water level and defolia- tion treatments on parent tillers of S.
tenuis during 1995 (Table 4). These results indicate that the degree of metabolic activ- ity and outgrowth capacity of axillary buds are maintained on parent tillers of this species after a one-year-exposure to the combined or separate influence of water stress and defoliation. Similar
results (p > 0.25) were obtained for most sampling dates in 1996 (Table 4).
156 JOURNAL OF RANGE MANAGEMENT 55(2) March 2002
Table 4. Number of total nodes (TN), buds which originated daughter tillers (DT), and metabolical- ly active (MAB) and dead and dormant (DDB) buds on parent tillers of S. tenuis at the different treatments in 1995, 1996 and early 1997. I: Irrigation, R: Rainfed, WS: Water stress, C:
Undefoliated controls, and defoliation at the vegetative (V), internode elongation (E) or both phe- nological stages (VE). Each value is the mean (+/-SE) of n=2. Values without SE come from n=1.
Treatments
Dates Water levels Defoliation TN DT
23/5/95 Irrigation C 7.25 (0.25) (1.25)
V 7.00 (1.00) 3.00 (0.25) 0.50
VE 6.00 (0.00) 2.00 (0.00)
Rainfed C 7.00 (0.00) 0.00 (0.00)
V 7.00 (0.50) 3.00 (0.75)
VE 5.00 (1.00) 2.50 0.50 (0.50) 1.00
Water stress V C 10.00 (1.00) (1.50)
V 5.25 (0.25) 3.25 (0.50) 0.00
Water stress VE C 6.75 (0.25) (0.00)
VE 7.00 (2.00) 1.50 0.50
7/9/95 Irrigation C 9.00 (1.25) (1.00)
V 8.71 (1.04) 3.92 (0.50)
VE 8.00 (1.25) 3.25 (1.50)
Rainfed C 8.00 (2.00) (0.13)
V 7.13 (0.88) (0.75)
VE 7.46 (0.79) 2.50 (0.38)
Water stress V C 9.25 (0.25) (1.25)
V 7.33 (1.00) 3.17 1.17
Water stress VE C 7.21 (0.54) (1.54)
VE 8.04 (1.71) 3.58 (0.92)
27/9/95 Irrigation C 10.13 (0.88) (0.25)
E 9.83 (0.83) 3.79 (1.08)
VE 10.00 (1.00) 3.63 (1.00)
Rainfed C 8.75 (1.25) (0.63)
E 9.75 (1.00) 4.50 (0.38)
VE 8.88 (1.63) 3.25 (1.25)
Water stress E C 9.00 (1.75) (0.63)
E 8.88 (0.63) 3.25 (0.50)
Water stress VE C 8.75 (0.25) (0.00)
VE 9 75 (1 00) 2 75 50) 3 (0 25) 2 (0
14/12/95 Irrigation C
. .
8.75 (0.25)
.
3.63
.
1.00 (0.50)
.