Abstract
We compared the herbage standing crop on 31 farms along a rainfall gradient in Namibia (southwestern Africa) in 1997 with the results attained for the same gradient by Walter (1939). We found that the slope for the regression of herbage yield on mean annual rainfall in 1997 was 5.93, i.e. 5.93 kg herbage was pro- duced per hectare for every 1 mm increase in rainfall along the gradient. This regression slope is considerably lower than that in Walter’s (1939) study (slope = 10.34). Thus, current grassland productivity per unit of rainfall in Namibia is about half that of 50 years ago. There is no evidence of a change in annual rainfall over this period, nor is there any evidence that either short-term (current) or longer-term (11 years) stocking densities affect cur- rent herbage yield. We conclude that, while desertification has taken place, grazing over the last decade has not been the cause of this reduced productivity.
Key Words: Africa, rangelands, historical records, grazing, rainfall
There is widespread concern over desertification (i.e. a long- term decline in productivity) of the semi-arid grasslands of the world (Schlesinger et al. 1990, 1996, Hall and Scurlock 1991, Strohbach 1992, Parton et al. 1995). However, it is often difficult to unequivocally determine whether desertification has occurred, because different types of information (e.g. on soil quality, car- bon isotopes, vegetation quality and quantity) may give conflict- ing results (Hoffman et al. 1995, Parton et al. 1995, Parsons et al.
1997). Also, logistical problems such as variability in annual rainfall cause great natural fluctuations in herbage growth, mak- ing it difficult to differentiate pattern in declining productivity from noise caused by random or event-driven fluctuations (Hoffman and Cowling 1990, Sullivan 1996, Hoffman 1997, Ward et al. 1998, Ward et al. 1999). Long-term cycles in rainfall can further exacerbate this problem. For example, Hoffman and Cowling (1990) and Hoffman (1997) have shown that Acocks’
(1953) claim that desertification was rampant in the semi-arid Karoo region of South Africa was probably caused by the long
dry period in the 1950’s. When one compares photographs of the vegetation taken in 1925 by I.B. Pole Evans with photographs taken at the same sites by Hoffman in 1993, it appears that vege- tation cover has declined. However, if one compares Pole Evans’
photographs to those taken in 1989, one sees that no long-term change has occurred, since the 1920’s and 1980’s were similarly wet periods (Hoffman 1997).
Another major problem in assessing whether desertification has occurred is that few long-term data exist to define the past condi- tion of grasslands. The grasslands of Namibia are notable excep- tions to this. Walter (1939) examined the relationship between herbage production and average annual rainfall in Namibia (southwestern Africa) over a rainfall gradient of 100–500 mm.
These data represent a baseline that can be used to make compar- isons between production 58 years ago with the present day.
Furthermore, because these data represent the relationship of grassland production with rainfall along a rainfall gradient, we can compare past productivity with that of today without having to concern ourselves with possible differences in rainfall between the sampling periods because the effects of variance in rainfall can be controlled by regression analysis. For these reasons, we attempt here to assess whether there have been significant changes in the productivity of Namibia’s grasslands from the time of Walter’s (1939) study and the present day.
J. Range Manage.
53:138-144 March 2000
Are Namibia’s grasslands desertifying?
DAVID WARD AND BEN T. NGAIRORUE
Authors are associate professor, Mitrani Department for Desert Ecology and Director, Ramon Science Center, Jacob Blaustein Institute for Desert Research, Ben Gurion University of the Negev, Sede Boqer 84990, Israel and Research Student, Desert Research Foundation of Namibia, 7 Rossini Street, Windhoek, Namibia.
We thank Japhet Karamata and Immanuel Kapofi for their assistance. We also thank the 31 farmers, the technicians at the Namibian weather bureau for their assistance, and the Namibian department of veterinary services for the provision of long-term stocking data. This study was funded by grant TA-MOU-94-C13-149 from the U.S. Agency for International Development to David Ward, Uriel Safriel and Mary Seely. This is publication number 287 of the Mitrani Department for Desert Ecology and publication number 88 of the Ramon Science Center.
Manuscript accepted 28 Jan 1999
Resumen
Se comparó el cultivo de pastoreo estable en 31 fincas a lo largo de un gradiente de precipitación en Namibia (sudoeste de Africa), en 1997, con los resultados obtenidos para el mismo gradiente por Walter (1939). Encontramos que la pen- diente en la regresión para la producción de pasto en relacion con la precipitación media anual en 1997 fue 5.93, i.e. 5.93 kg de pasto es producido por hectarea en cada incremento de 1 mm en la precipitación a lo largo del gradiente. Esta linea de regresión es considerablemente más baja a la del estudio real- izado por Walter (1939), (pendiente = 10.34). De este modo, la actual productividad por unidad de precipitación en las praderas de Namibia es cercana a la mitad de la productivi- dad hace 50 años. No hay evidencias de un cambio en la pre- cipitación anual en este periodo de tiempo, ni hay alguna evi- dencia de que la densidad de la ganaderia a corto-plazo (actualmente) o a largo-plazo (11 años) afecten la producción de pastos. Concluimos que, mientras la desertificación ha tomado lugar, el pastoreo en la ultima decada no ha sido la causa de esta reducida productividad.
Materials and Methods Study sites
In 1997 we studied herbage yield on 31 commercial farms in 3 clusters of 11, 10, and 10 farms, each within a 100 km radius of Otjiwarongo, Windhoek and Keetmanshoop, respectively (Fig. 1). All the farms were commercial and not com- munal farms, i.e. the possibility that the f a r m s w e r e i n p o o r s t a t e d u e t o t h e
‘tragedy of the commons’ (sensu Hardin 1968) or similar mechanism is unlikely.
These 3 towns were chosen as the centers of our study for 2 important reasons: (1) long-term rainfall data exist, and (2) they are found along the length of a rainfall gradient from the dry southern part of Namibia (Keetmanshoop: mean ± S.E.
annual rainfall = 141.98 ± 9.82 mm), through central Namibia (Windhoek:
mean + S.E. annual rainfall = 361.15 ± 1 3 . 7 1 m m ) t o t h e m o r e m e s i c n o r t h (Otjiwarongo: mean + S.E. annual rainfall
= 449.63 + 18.04 mm) (Fig. 1). The vege- tation in the northern region of this study is thornbush savanna, with varying degrees of dominance of thorn trees (mostly A c a c i a species) and perennial grasses (Van der Merwe 1983). Central Namibia is open dry savanna, also domi- nated by A c a c i a trees with a mixture of
annual and perennial grasses. Southern Namibia is covered by dwarf shrub savan- na and open dry grasslands dominated by annual grasses. The only criterion for choosing farms within each of these regions was that long-term rainfall records were available for each farm from the Namibian national weather service.
Stocking density for each farm was obtained either directly from the farmers (1997 season) or from the Namibian Department of Veterinary Services (long- term data). Long-term data are collected once a year for each by the Namibian Department of Veterinary Services for the purposes of disease control.
Herbage measurements
We used a point-frequency frame to measure herbage height (Mueller- Dombois and Ellenberg 1974) on the 31 farms. Note that we use the term ‘herbage’
here to denote all plant species that are not predominantly woody. In the main, these are grasses, but not entirely so. The study was done from the end of February to the middle of April 1997, the peak of the wet season in Namibia. On each farm, herbage height was measured at 3 points 20 m apart along the length of a gradient at 100, 200, 300, 500, and 1,000 m from stock watering points. This ensured that herbage height was measured from the worst to the
best places on each farm as degradation around water points did not extend as far a s 1 , 0 0 0 m f r o m w a t e r o n a n y f a r m (Ngairorue and Ward, Personal communi- cation). Average herbage height from all these points was used to derive a single herbage height data point for each farm.
Herbage height was converted to herbage mass (kg ha-1) from a regression where we measured herbage height using the point- frequency frame and herbage mass by cut- ting, drying, and weighing herbage from a 1 m2quadrat placed under the point-fre- quency frame. At each farm, sampling sites were chosen at random. The relation- ship between herbage mass and herbage height was defined by the equation:
Herbage Mass (kg ha- 1) = 10 * (4.17 * Herbage Height - 2.02); (r2 = 0.88, P <
0.001).
Soil quality
We measured the following soil vari- ables: organic carbon, total nitrogen, total phosphorus, pH, conductivity, water-hold- ing capacity. Soil was collected at 10–30 cm depth at the same 3 points used for the herbage biomass measurements, i.e. 20 m apart at each of the 5 distances from the waterpoints. These 3 samples were mixed to give a single value for each distance from the waterpoint. Organic carbon was measured as percentage mass loss on igni- tion at 400°C for 16 hours in a muffle fur- nace (Nelson and Sommers 1996). Total nitrogen was measured by conventional Kjeldahl techniques (Bremner 1996), and total phosphorus was measured with the Olsen technique (Olsen and Sommers 1982). Conductivity and pH were measured using pH and conductivity meters. Water- holding capacity was recorded as the per- centage increase in mass of 10 g of dry soil when distilled water was added until the saturation point was reached. We also used radishes (Raphanus sativus Linneaus 1758) cv. Sparkler as a bioassay (total dry weight after 3 weeks) of soil nutrients (Olsvig- Whittaker and Morris 1982).
Statistical analyses
We used conventional least-squares regressions to determine the relationships between herbage mass and rainfall.
Residuals from these regressions were used to assess the effects of stocking den- sity on herbage mass after the effects of rainfall differences among farms were removed. Multiple regressions were used to determine the effects of several inde- pendent variables such as soil nutrient parameters on herbage mass. Analyses of Fig. 1. Study sites on 31 farms in Namibia. Black circles indicate farm positions.
covariance were used to compare inter- cepts of regressions. Paired t-tests were used for paired data.
In addition to using least-squares regres - sions to determine the relationship between herbage mass and rainfall, we also examined the maximal relationship between herbage mass and rainfall. In any relationship between productivity and a controlling environmental variable, one might expect that an ‘envelope effect’
exists ( sensu Goldberg and Scheiner 1993). That is, there is a maximal (theoret- ical) relationship between herbage produc- tion and rainfall but in any single site a plethora of factors (not least of which is grazing) may skew this relationship down - wards. No upwards skew can occur because there is a constraint placed by rainfall on herbage production over which additional herbage cannot be produced.
We therefore expect an ‘envelope’ that describes a triangular cluster of data points below the regression line (Fig. 2).
Such a relationship violates the assump- tion of conventional least-squares regres- sion that there is homogeneity of variance (by definition, an ‘envelope’ results in greater variance at higher values of the independent variable). Thomson et al.
(1996) describe a simple statistical test for an ‘envelope effect’: One first takes the positive residuals from the least-squares regression of the dependent and indepen- dent variables in question. These positive residuals are then regressed against the independent variable. The positive residu- als of this new regression are taken and
regressed against the original independent variable. This process is continued until the regression slope is no longer signifi- cantly different from zero. If there is indeed an ‘envelope effect’, the uppermost regression line (Fig. 2) will describe the upper limit to the ‘envelope’ (Thomson et al. 1996). If there is no envelope, the posi- tive residuals will not be significantly related at any stage to the independent variable.
To test for possible cyclicity in long- term rainfall patterns, we used autocorre- lation analyses. This is a statistical index
that reveals the extent of the correlation between the residuals. The first-order autocorrelation is the conventional Pearson correlation of a series of numbers with the same series shifted by 1 year.
This is then repeated for second-order (series shifted by 2 years), third-order (series shifted by 3 years), and further autocorrelations for as many years as there are in the series. Each correlation is tested for significance at the conventional level of α(0.05).
Results Herbage Yield
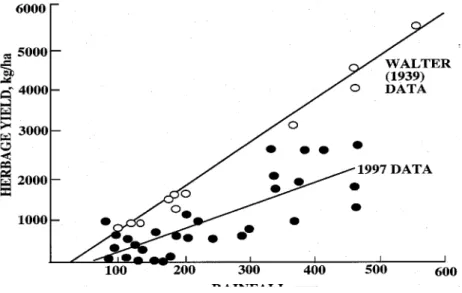
The slope of the regression of current (1997) herbage yield per hectare on long- term average rainfall (herbage yield = 5.93 average annual rainfall - 328.55) is far lower than that reported by Walter (1939) (herbage yield = 10.34 average annual rainfall - 401.3) (following Rutherford 1980) (Fig. 3). More of the variance in average herbage yield is explained by variance in average annual rainfall (r2 = 0.64, F = 52.406, P < 0.0001, error d.f. = 29) than is explained by variance in the current season’s rainfall (r2 = 0.49, F = 27.796, P < 0.0001, error d.f. = 29).
We also regressed maximal herbage yield (i.e. where there was no grazing effect at a distance of 1,000 m from the waterpoint) against average annual rainfall at each site. The slope was steeper (herbage yield = 6.618 average annual rainfall - 504.126, r2= 0.58, F = 40.028, P
< 0.0001, error d.f. = 29) than that for Fig. 2. The ‘envelope’ effect in regression. Dots indicate individual data points, all of which
are below the regression line that constrains the relationship. Note the heterogeneity of variance in the relationship; there is more variability on the right side of the x-axis than on the left.
Fig. 3. Relationship between herbage yield (kg/ha) and mean annual rainfall (mm) on 31 farms in Namibia. Walter’s (1939) regression formula is: herbage yield = 10.34 average annual rainfall - 401.3 (Rutherford 1980). Our regression for 1997 is: herbage yield = 5.93 average annual rainfall - 328.55.
average annual rainfall, although this dif- ference was not significant (ANCOVA: F
= 0.822, P = 0.368, error d.f. = 59).
Indeed, there was no significant difference between herbage yield at 1,000 m from waterpoints and the herbage yield aver- aged over all distances from waterpoints on all the farms (paired t-test: t = 1.671, P
= 0.105, error d.f. = 30).
Studies such as these could be biased by the logistical difficulties involved in sam- pling all sites simultaneously. For exam- ple, if all farms with high herbage yield were sampled at the end of the season after grazing, wind and other effects have reduced herbage yield, a significantly lower slope would be recorded for the herbage yield:rain regression. To test for bias produced by sampling date, we exam- ined the correlation between the residuals of the regression of average herbage yield against average annual rainfall and sam- pling date. Because there was no signifi- cant correlation (r2= 0.01, F = 0.339, P = 0.565, error d.f. = 29), no effect of sam- pling date on the results is presented here.
It is possible that Walter’s regression line represents a maximal relationship between herbage yield and rainfall (Rutherford 1980), and therefore our cur- rent regression line will lie through the average of the points below Walter’s regression. We performed the procedure outlined above for testing for an ‘enve- lope’ effect and found that no such effect exists (r2= 0.034, F = 0.212, P = 0.661, error d.f. = 6).
We also calculated the slope for maxi- mal herbage yield against rainfall by regressing herbage yield for the two farms with the most positive residuals in the original least-squares regression against the independent variable (long-term aver- age rainfall). In doing so, we created the maximal regression for our 1997 data.
This regression (herbage yield = 8.49 average annual rainfall - 110.87) was still 20% lower than that of Walter (1939).
Stocking densities
To test for the effects of grazing pres- sure on herbage yield, we took the residu- als from the regression between herbage height and average annual rainfall (Fig. 3) and regressed them against current stock- ing densities [expressed in Large Stock Units (LSU) per hectare]1. This regression removed the effect of variance in rainfall, and allowed us to directly examine the effects of stocking density on herbage yield. There was no significant relation- ship between these two variables (r2= 0.006, F = 0.181, P = 0.674, error d.f. =
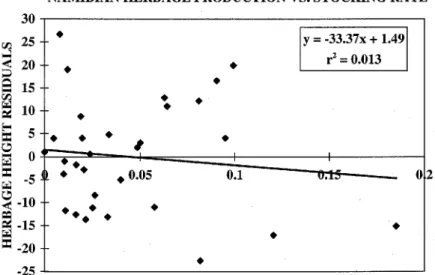
29), nor between the residuals of herbage height and long-term stocking densities (data from 1986–1996) (r2 = 0.013, F = 0.384, P = 0.540, error d.f. = 29—Fig. 4).
Soil variables
We tested for the effects of variance in soil variables on herbage yield after the confounding effect of average annual rain- fall was removed. We used a multiple regression with the residuals of herbage yield as the dependent variable and organ- ic carbon, total nitrogen, total phosphorus, water-holding capacity, pH, conductivity, and total dry mass of radishes from the bioassay as independent variables. There was no significant effect of any of the soil variables on herbage yield (F = 0.856, P = 0.554, error d.f. = 23).
Changes in rainfall over time Our study was conducted in an average rainfall year for the region. Mean ±S.E. % of seasonal (1996/1997) rainfall was 231.8
± 29.61 mm (c.v. = 0.72) while long-term average rainfall for all 31 farms was 240.4 + 21.94 mm (c.v. = 0.52). Thus, 1996/1997 season rainfall was 96.4% of the long-term average. This difference was not signifi- cant (paired t-test, t = 0.524, P = 0.604, error d.f. = 30).
We tested whether long-term rainfall changes might have led to the decline in production that we recorded compared to
Walter (1939). There was no significant change in rainfall at any of the 3 long-term rainfall stations (Otjiwarongo, Windhoek (Fig. 5) and Keetmanshoop). Declines could potentially be recorded because measurements were made at the low point in a rainfall cycle. We tested for the pres- ence of rainfall cycles by autocorrelation analyses. Only at the Windhoek station was there any evidence of a cycle (P <
0.05), and this cycle is just 2-years long.
Hence, the results we have for herbage yield are not a result of being in the low point of a long-term rainfall cycle.
Discussion
There is currently much concern in Namibia about the effects of various agri- cultural practices on productivity of the land (Quan et al. 1994, Seely and Jacobson 1994, Bester 1995, Ward 1996, Aharoni and Ward 1997). Indeed, about 60% of northern Namibia suffers from bush encroachment, while up to 90% of southern Namibia is considered to be overgrazed (Quan et al. 1994). However, statistics such as these do not tell us whether these problems are leading to long-term degradation. Thus, results such as ours form an important baseline to determine whether land degradation, and hence desertification, is occurring.
Our conclusion clearly rests on the validity of Walter’s (1939) data. In mak- ing such a comparison, it is necessary to ensure that all possible confounding vari- ables are controlled, which we have
1A Large Stock Unit is the equivalent of a single mature cow or 6 goats or sheep (Meissner et al.
1983).
Fig. 4. Relationship between residuals of herbage height vs. mean annual rainfall and mean long-term stocking rate (LSU/ha).
attempted to do in our study. Importantly, we have demonstrated that variation due to soil type and grazing regime over the last 11 years was not correlated with herbage height (and by inference with bio- mass) on the 31 farms. Furthermore, we have shown that more of the variance in herbage yield can be explained by long- term average rainfall than by seasonal rainfall. Thus, it is appropriate that we and Walter (1939) used long-term average rainfall as the independent variable in the regression with herbage yield. This con- clusion is inconsistent with Rutherford’s (1980) claim that annual rainfall has a greater effect on grassland productivity than long-term average rainfall.
Rutherford (1980) concluded that only annual grasslands should have been used in Walter’s (1939) study to allow for a direct relationship with annual rainfall.
We consider this point to be unnecessarily restrictive because grasslands tend to change from annual to perennial grasses with increasing rainfall (Shmida 1985), thereby precluding appropriate compari- son along the rainfall gradient in Namibia.
Additionally, annual grasses tend to replace perennial grasses in desertified grasslands, especially those suffering from heavy grazing (Kelly and Walker 1977, Frost et al. 1986, O’Connor 1991, O’Connor and Pickett 1992, Seely and Jacobson 1994, Parton et al. 1995, Parsons et al. 1997).
A possible reason for the reduced pro- ductivity (identified by the lower regres- sion slope of herbage yield:rainfall) in our data compared with that recorded by Walter (1939) is that Walter’s regression
line represents a maximum, rather than an average relationship as suggested by Rutherford (1980). Indeed, Whittaker and Marks (1975) found the low variance in Walter’s relationship “remarkable”. We note the very low variance about the regression line (Fig. 3). We consider it parsimonious to conclude that some degree of data “smoothing” was done by Walter (1939). We tested whether the reduced productivity in 1997 was due to comparison of our average regression rela- tionship with a possible maximal relation- ship described by Walter (1939). We did this by regressing herbage yield for the 2 farms with the most positive residuals (in the herbage yield: average rainfall regres- sion) against rainfall to produce a maxi- mum slope. We still found that our data lay below those of Walter (1939). We believe, therefore, that even ”smoothing”
of the data by Walter cannot account for the lower slope of the regression in the current data. We noted that the maximal slope in our data (8.49) is very similar to Deshmukh’s (1984) regression compiled for data from a wide range of sites in east- ern and southern Africa, viz. herbage yield
= 8.488 * rainfall - 195.768. This similari- ty in slopes suggested to us that Namibian herbage production may once have been similar to that described by Deshmukh (1984), but that it has now declined to an average slope of 5.93 (Fig. 3).
Desert-grassland transition
Rutherford (1980) used Seely’s (1978a, b) data to justify a claim that a slope of about 5 was “normal” for southern African
grasslands [Seely’s regression equation was: Plant Production (kg ha- 1) = 5.48 * Seasonal Rainfall (mm) - 113.0], and also for his claim that it is only appropriate to use this year’s rainfall and annual grasses.
However, Seely’s data are at the low end of the rainfall scale (< 100 mm rain per annum), and annual grasses only occur there. We believe that it is prudent to con- sider there to be a piecewise regression relationship (rather than a linear one) between herbage production and rainfall.
That is, from 20 mm up to about 100 mm of annual rainfall, herbage production (annual grasses only) increases by about 5 kg/ha for every 1 mm increase in annual rainfall (because 5.48 = slope of Seely’s equation). Above 100 mm annual rainfall, the perennial grass component increases as rainfall increases. This increase in the pro- portion of perennial grasses produces an increase in the standing crop of grasses per unit of rainfall because perennial grasses remain in the grassland even in low rain- fall years. Thus, the slope of the herbage yield:rainfall regression should become steeper with annual rainfall exceeding 100 mm. In undegraded situations, we tenta- tively suggest that this slope should be about 8 kg ha-1for every 1 mm increase in average annual rainfall, i.e. the slope (8.488) derived by Deshmukh (1984) for a wide range of undisturbed eastern and southern African sites. From our results, it appears logical to consider long-term aver- age annual rainfall as the major factor affecting herbage production above 100 mm annual rainfall and actual annual rain- fall below this amount. Thus, we consider both Walter (1939) and Seely (1978a, b) to be correct in their choices of the inde- pendent variables, and therefore disagree with the choice advocated by Rutherford (1980).
We therefore return to our original ques- tion: Are Namibia’s grasslands desertify- ing? We conclude in the affirmative. The level of productivity per unit rainfall is considerably lower than that previously measured. Identification of the causes for this decline in productivity is needed so that appropriate management strategies can be developed for the sustainable use of these rangelands, especially because cur- rent stocking densities do not seem to have an effect.
O’Connor (1985) analyzed long-term experiments in southern Africa on the effects of rainfall and grazing on state variables but he found no evidence that changes in rainfall patterns have caused a major change in any system. Cyclic changes in grassland composition have Fig. 5. Long-term rainfall patterns at Windhoek. There has been no significant change in
rainfall over the period of measurement (r = 0.095, F = 0.938, P = 0.335, error d.f. = 103).
Data from the Namibian National Weather Bureau.
followed rainfall cycles, i.e. grassland composition has been nearly constant for any particular rainfall condition and all species eliminations have been of a tem- porary nature only. He concluded that long-term rainfall variability, independent of rainfall regime, has an overriding effect on grassland compositional trends. The cumulative effects of grazing, however, do influence the rate of rainfall-induced com- positional changes (O’Connor 1985). This conclusion is consistent with Bester’s (1995) claim that the major cause of rangeland degradation in Namibia is the overestimation of the annual forage pro- duction, resulting in overutilization of the rangeland.
Our data on short-term (current season) and longer term (11 years) stocking densi- ties are inconsistent with these claims. We found no evidence for changes or long- term cycles in rainfall, and no effects of stocking densities on biomass. This result does not mean that grazing has not affect- ed the botanical composition of the range- lands. Grazing may affect botanical com- position in semi-arid and arid rangelands (Landsberg et al. 1997, 1999). Milchunas and Lauenroth (1993) found that there was a positive correlation between the degree of grazing-induced change in botanical composition and mean annual rainfall, although increasing evolutionary history of grazing produced increasing dissimilar- ity in species composition between grazed and ungrazed sites regardless of the level of precipitation. A grazing-induced change in botanical composition may cause an indirect decline in productivity if the origi- nal species had higher biomasses than the current species. However, if this were the case, it would still be possible to detect a decline in productivity by the regression approach we used. Furthermore, due to the absence of such data in Walter’s (1939) study, no comparison can be made between the botanical composition along this environmental gradient in 1939 and the composition in our study.
We suggest that while stocking densities h a v e b e e n t h e c a u s e o f t h e l o w e r e d herbage production in Namibia, this effect is very gradual and takes more than the 11 years to manifest itself. In another study in the central part of the rainfall gradient in Namibia, Ward et al. (1998) found that 10- fold differences in stocking rates over the short- to medium-term (1–50 years) did not cause detectable differences in herbage yield or soil quality. However, a decline in herbage productivity was discerned when comparing sites known to have had heavy grazing for the last 150 years with similar
sites that have experienced only 5–10 years of heavy grazing. Wiegand and Milton (1996) have shown by spatially- explicit modeling in the arid Karroo of South Africa that simulated overgrazing of a rangeland in good initial condition only became obvious 40 or 50 years after the initiation of heavy grazing, and after 70 years the mean vegetation state eventually reached that of an overgrazed rangeland.
Both Wiegand and Milton’s (1996) and our (Ward and Kapofi 1999, Personal communication) results point to the extremely long-term nature of declining productivity or desertification brought about by heavy grazing in such arid habi- tats. It is clearly necessary that future research programs establish long-term sampling plots along the rainfall gradient in Namibia to determine whether slow long-term degradation is occurring, as appears to be the case from the results pre - sented here.
Literature Cited
Acocks, J.P.R. 1953. Veld types of South Africa. Mem. Bot. Surv. So. Afr. 28:1–192.
Aharoni, B. and D. Ward. 1997. A new pre- dictive tool for identifying areas of desertifi- cation that combines Principal Components Analysis and Geographical Information Systems: a case study from Namibia. Desert.
Control Bull. 31:12–18.
Bester, F. 1995. Drought and rangeland man- agement. p. 91–104. I n : R. Moorsom (ed).
Coping with aridity: drought impacts and preparedness in Namibia. Brandes and Appel/NEPRU: Windhoek, Namibia.
Bremner, J.M. 1996 . Nitrogen - total. p.
1085–1121. In: D.L. Sparks (ed). Methods of soil analysis. Part 3 - Chemical methods. Soil Science Society of America, Madison, Wisc.
Deshmukh, I.K. 1984 . A common relationship between precipitation and grassland peak biomass for East and southern Africa. Afr. J.
Ecol. 22:181–186.
Frost, P.G.H., J.C. Menaut, B.H. Walker, E.
Medina, O.T. Solbrig, and M. Swift. 1986.
Responses of savannas to stress and distur- bance. Biol. Internat. 10:1–82.
Goldberg, D.E. and S.M. Scheiner. 1993.
ANOVA and ANCOVA: Field competition experiments. p. 69–93. In: S.M. Scheiner and J. Gurevitch (eds). Design and analysis of ecological experiments. Chapman and Hall, London.
Hall, D.O. and J.M.O. Scurlock. 1991.
Climate change and productivity of natural grasslands. Annals Bot. 67 (suppl.):49–55.
Hardin, G. 1968. The tragedy of the commons.
Sci. 162:1243–1248.
Hoffman, M.T. 1997. Human impacts on veg- etation. p. 507–534. In: R.M. Cowling, D.M.
Richardson and S.M. Pierce (eds).
Vegetation of southern Africa. Cambridge Univ. Press, Cambridge.
Hoffman, M.T. and R.M. Cowling. 1990.
Vegetation change in the semi-arid eastern Karoo over the last two hundred years: an expanding Karoo - fact or fiction? So. Afr. J.
Sci. 86:286-294.
Hoffman, M.T., W.J. Bond and W.D. Stock.
1 9 9 5 . Desertification of the eastern Karoo, South Africa: conflicting palaeological, his- torical and soil isotopic evidence. J. Environ.
Monit. Assess. 37:159–177.
Kelly, R.D. and B.H. Walker. 1977 . The effects of different forms of land use on the ecology of the semi-arid region in south-east- ern Rhodesia. J. Ecol. 62:553-576.
Landsberg, J., C. James and S. Morton.
1 9 9 7. Assessing the effects of grazing on biodiversity in Australia’s rangelands. Aust.
Biologist 10:153–162.
Landsberg, J., T.G. O’Connor, and D.
Freudenberger. 1999. The impacts of live- stock grazing on biodiversity in natural ecosystems, pp. 752–777. I n : H.J.G. Jung and G.C. Fahey. (eds.). Nutritional ecology of herbivores. Amer. Soc. of Anim. Sci., Savoy, Ill.
Meissner, H.H., H.S. Hofmeyr, W.J.J. Van Rensburg, and J.P. Pienaar. 1983 . Classification of livestock for realistic pre- diction of substitution values in terms of a biologically defined large stock unit. Tech.
Comm. 175. Dept of Agr, Pretoria, So.
Africa.
Milchunas, D.G. and W.K. Lauenroth. 1993.
Quantitative effects of grazing on vegetation and soils over a global range of environ- ments. Ecol. Monogr. 63:327–366.
Mueller-Dombois, D. and H. Ellenberg.
1974. Aims and methods of vegetation ecolo- gy. Wiley, New York.
Nelson, D.W. and L.E. Sommers 1996. Total carbon, organic carbon, and organic matter, pp. 961–1010. In: D.L. Sparks (ed). Methods of soil analysis. Part 3 - Chemical methods.
Soil Sci. Soc. of Amer., Madison, Wisc.
Ngairorue, B.T. and D. Ward. 1999. Grazing, rainfall and soil impacts on farms along a rainfall gradient in arid Namibia. In Prep.
O’Connor, T.G. 1985. A synthesis of field experiments concerning the grass layer in the savanna regions of southern Africa. South African Nat. Sci. Prog. Rep. 114. CSIR, Pretoria, So. Africa.
O’Connor, T.G. 1991. Local extinctions in perennial grasslands: a life-history approach.
Amer. Nat. 137:753–773.
O’Connor, T.G. and G.A. Pickett. 1992. The influence of grazing on seed production and seed banks of some African savanna grass- lands. J. Appl. Ecol. 29:247–260.
Olsen, S.R. and L.E. Sommers. 1982 . Phosphorus. p. 403–430. In: A.L. Page, A.L.
(ed). Methods of soil analysis. Part 2. Soil Sci. Soc. of Amer, Madison, Wisc.
Olsvig-Whittaker, L. and J.W. Morris. 1982.
Comparisons of certain Nylsvley soils using a b i o a s s a y t e c h n i q u e . S o . A f r . J . B o t . 4:91–96.
Parsons, D.A.B., C.M. Shackleton and R.J.
Scholes. 1997 . Changes in herbaceous layer condition under contrasting land use systems in the semi-arid lowveld, South Africa. J.
Arid Environs. 37:319–329.
Parton, W.J., J.M.O. Scurlock, D.S. Ojima, D.S. Schimel, D.O. Hall and SCOPEGRAM members. 1995. Impact of climate change on grassland production and soil carbon world- wide. Global Change Biol. 1:13–22.
Quan, J., J. Barton and C. Conroy. 1994. A preliminary assessment of the economic impact of desertification in Namibia. D.E.A.
Research Discussion Paper 3. Dept.
Environmental Affairs, Windhoek, Namibia.
Rutherford, M. 1980. Annual plant produc- tion-precipitation relations in arid and semi- arid regions. So. Afr. J. Sci. 76:53–56.
Schlesinger, W.H., J.F. Reynolds, G.L.
Cunningham, L.F. Huenneke, W.M.
Jarrell, R.A. Virginia and W.G. Whitford.
1990. Biological feedbacks in global deserti- fication. Sci. 247:1043–1048.
Schlesinger, W.H., J.A. Raikes, A.E. Hartley and A.F. Cross. 1996. On the spatial pattern of soil nutrients in desert ecosystems. Ecol.
77:364–374.
Seely, M.K. 1978a. Grassland productivity: the desert end of the curve. So. Afr. J. Sci.
74:295–297.
Seely, M.K. 1978b. Standing crop as an index of precipitation in the central Namib grass- land. Madoqua 11:61–68.
Seely, M.K. and K. Jacobson. 1994 . Desertification and Namibia: a perspective.
Afr. J. Zool. 108:21–36.
Shmida, A. 1985. Biogeography of the desert flora. p. 23–77. In: M. Evenari, I. Noy-Meir, and D.W. Goodall (eds). Ecosystems of the world. vol. 12A Elsevier, Amsterdam.
Strohbach, B.J. 1992. Loss of genetic diversi- ty due to veld degradation–a case study in the northern Kalahari, Grootfontein district.
Dinteria 23:102–115.
Sullivan, S. 1996. Towards a non-equilibrium ecology: perspectives from an arid land. J.
Biogeog. 23:1-5.
Thomson, J.D., G. Weiblem, B.A. Thomson, S. Alfaro and P. Legendre. 1996 . Untangling multiple factors in spatial distrib- utions: lilies, gophers, and rocks. Ecol.
77:1698–1715.
Van der Merwe, J.H. 1983. National atlas of South West Africa (Namibia). National Book Printers, Cape Town, So. Africa.
Walter, H. 1939 . Grassland, Savanne und Busch der ariden Teile Afrikas in ihrer ökol- ogischen Bedingtheit. Jaarb. wissensch. Bot.
87:750-860.
Ward, D. 1996. Game and stock farming in arid Namibia. Namib Bull. 13:8-9.
Ward, D., D. Saltz and L. Olsvig-Whittaker.
1999. Distinguishing signal from noise: long- term studies of vegetation in Makhtesh Ramon erosion cirque, Negev desert, Israel.
Plant Ecol. In Press.
Ward, D., B.T. Ngairorue, J. Kathena, R.
Samuels, and Y. Ofran. 1998. Land degra- dation is not a necessary outcome of commu- nal pastoralism in arid Namibia. J. Arid Environs. 40:357–371.
Ward, D. and I. Kapofi. 1999. Long-term declines in grassland productivity in arid Otjimbingwe, Namibia. In prep.
Wiegand, T. and S.J. Milton. 1996 . Vegetation change in semiarid communities:
Simulating probabilities and time scales.
Vegetatio 125:169–183.
Whittaker, R.H. and P.L. Marks. 1975 . Methods of assessing terrestrial productivity.
p. 55–118. I n : H. Lieth and R.H. Whittaker (eds). Primary productivity of the biosphere.
Springer Verlag, New York.