• No results found

Runoff from simulated rainfall in 2 montane riparian com- munities

N/A
N/A
Protected

Academic year: 2020

Share "Runoff from simulated rainfall in 2 montane riparian com- munities"

Copied!
8
0
0

Loading.... (view fulltext now)

Full text

(1)

J. Range Manage.

51:315-322 May 1998

Runoff from simulated rainfall in 2 montane riparian com- munities

GARY W. FRASIER, M.J. TRLICA, W.C. LEININGER, R.A. PEARCE AND A. FERNALD

Authors are research hydraulic e@teer, USDA-ARS, Rangeland Resource Research unit, 1701 Center Ave., Fort Collins, Co[o. 80526; pn$t?ssors, Dept. of

Rangeland Ecosystem Science, Colorado State Univ., Fort Coilitts, Cola. 80523; EnviroCounsel Consulting, Big Pine, Calif: 93513; and graduate reseprch assistant, Department of Earth Resources, Colorado State University, Fort Cofiins, Cola. 80523.

Abstract

Riparian ecosystems are the final terrestrial zone before runoff water enters a stream. They provide the last opportunity to decrease non-point source pollution delivery to streams by removing sediments from overland water flow from uplands and roads. To quantify processes of sediment transport, filtration and deposition, it is necessary to determine runoff characteristics for the area. A rotating boom rainfall simulator was used to evaluate the effects of 3 vegetation height treatments (control, lo-cm stuh- ble height, and clipped to the soil surface) in 2 montane riparian plant communities (grass and sedge) on runoff characteristics.

Each rainfall simulation event consisted of 2 phases, a dry run of about 60 min followed by a wet run approximately 30 min later.

There were no differences in time to runoff initiation for either dry or wet runs that could be attributed to vegetation height treatments for either plant community. It usually required more time for runoff to be initiated in the sedge community compared to the grass community. Generally, there were lower equilibrium runoff percentages from dry runs in the sedge community com- pared with the grass community. These differences were less dur- ing wet runs. Several runoff parameters had characteristics of runoff from water repellent soils. The organic layer on the soil surface exhibited signs of water repellency that reduced the water infiltration rate during the initial stages of a rainfall simu- lation. These results indicate that runoff and infiltration process- es in the surface organic horizon of riparian zones may not respond in the classical manner. This characteristic has impor- tant implications if criteria developed in areas with less organic matter on the soil surface are used to manage overland flow in the zone. Additional studies are needed to fully describe infiltra- tion and runoff processes in riparian plant communities.

Key Words: infiltration, overland flow, stubble height, hydro- graph, riparian hydrology, water quality

Mountainous riparian zones are the focus of multiple use con- flicts in many areas of the Western United States (Hansen 1988).

These areas are the last terrestrial zone that runoff or overland flow water crosses before it reaches a stream. Healthy riparian ecosystems can be effective in removing sediments from uplands and decreasing non-point source pollution to streams (Heede

This research was partially supported by the USDA-ARS, a USDA-NRI Competitive grant, and the Colorado Agricultural Experiment Station.

Manuscript accepted 21 Jun. 97.

JOURNAL OF RANGE MANAGEMENT 51(3),May 1998

Resumen

El ecosistema riparian es la ultima zona terestrial de curso del agua de desagiie ante de la entrada de1 arroyo. Ofrecen la ultima oportunidad disminuir la entrega de la contaminacio de fuente dispersivo (non-point source) al arroyo. Lo hacen por el sacamiento de sedimento, que viene de campos y caminos, en el agua de desagiie. Para cuantiiicar procesos de transporte sedi- mento, fdtracion, y deposicibn, hay que determinar las caracteris- ticas del agua de desagiie por el area. Una simuladora de lhtvia con botalones rotatorios fue usado para evaluar 10s effectos de tres tratamientos con alturas vegetales differentes (el control, el rostrojo con altura de lOcm, y la vegetaci6n trijerada hasta el suelo) sobre las caracteristicas de1 agua de desagiie. Los effectos de 10s tratamientos fueron analizados sobre dos communidades vegetales mountaiiosas riparianes: la hierba y la juncia. Cada simulacidn de lluvia constaba de dos fases: primer0 una simu- lacion de lhtvia sobre suelo seco (60 minutos) y una simulation sobre el suelo mojado despues de 30 minutos sin guvia. Habii no ditferencias entre 10s dos simulaciones en el tiempo de agua de desagiie initial que fuera podido atribuir a 10s tres tratamientos de alturas vegetales differentes, para ni el hierba ni la juncia. La communidad de hierba necesit6 msis tiempo para dar el agua de desagiie initial que la communidad de juncia. Generalmente, babia percentajes menores de agua de desagiie al equilibro para la communidad de juncia que para la de hierba durante la simu- laci6n de lluvia sobre suelo seco. Estas differencias fueron menores para las simulacibnes sobre el suelo majado. Varios parametros de agua desagiie tenian caracteristicas paracido al agua de desagiie desde suelo repulsive a agua. EI estrato orgkico sobre el suelo superficial demostro algun rachazamiente a agua que disminuyo la velocidad de intiltracidn (de agua en suelo) durante el empiezo de una simulacidn de Iluvia. Estos resultos htdican que 10s procesos de agua de desagiie y infdtracion en el estrato orgrinico superficial de zonas riparianes tal vez no funcio nan por el modo clasico. Esta caracteristica tiene implicaciones importantes si se usan criterios desarrollado de areas con menos materiales organicos sobre el suelo superficial para manejar el agua de desagiie en la zona. Se necesitan mL investigaci6nes para describir completemente 10s procesos de agua de desagiie y infil- tracion en communidades vegetales riparianes.

1990). To maintain or improve the effectiveness of riparian areas to enhance water quality, the USDA -Forest Service developed

315

(2)

stubble height standards that are intended to assure that sediment will be filtered from runoff water before it enters a stream (Clary and Webster 1989, Hall and Bryant 1995).

The objective of this study was to determine runoff and infiltra- tion characteristics of a montane riparian zone so that processes of sediment transport and filtration could be determined.

Although research has been conducted on water infiltration and runoff of upland range sites, little attention has been focused on hydrologic and hydraulic properties of surface runoff in riparian areas (Skovlin 1984, Bohn and Buckhouse 1985). We hypothe- sized that in the 2 montane riparian plant communities, surface water runoff rate would be greatest in the clipped to the soil sur- face treatment and least in the control.

Methods and Materials Study Site

The study area was in the riparian zone of Sheep Creek in the Roosevelt National Forest about 80 km northwest of Fort Collins, Colo. at an elevation of 2,500 m. Sheep Creek is classified as a C-3 stream (Rosgen 1994), typical of many small (4-S m width) headwater perennial streams in the western U.S.

Vegetation

Vegetation along Sheep Creek consists of willows (Salti spp.), shrubby cinquefoil (Potentilla fruticosa L.), sedges (Carex spp.), rushes (Juncus spp.), Kentucky bluegrass (Poa pratensis L.), fowl bluegrass (P. palustris L.) and tufted hairgrass (Deschanpsia caespitosa (L.) Beauv.) (Schulz and Leininger 1990, Popolizio et al. 1994). Two plant communities within the riparian area were selected as study sites. One site with a northern aspect was domi- nated by beaked sedge (Carex rostrata Stokes) and water sedge (Carex aquatalis Wahl.) (sedge site), while the other site with a southern exposure was dominated by Kentucky bluegrass and tufted hairgrass (grass site).

soils

Soils along Sheep Creek are deep, well drained of the Naz 70 series formed from granitic parent material. The general cIassifi- cation is a coarse loamy Pachic Cryoborol. The A horizon is dark to gray-brown color, 20 to 80 cm thick. Organic matter content of the upper horizon is often quite high (>7%) (Noor 1990, USDA 1980). Soil texture of the surface 7 cm at the study sites was 36%

sand, 36% silt, 28% clay (clay loam texture). Soils are often wet to saturated during the spring and some mottling is evident. A highly organic horizon up to 20 cm thick covered the study sites.

Slope of the study area was 3 to 5%.

in both plant communities were re-evaluated in July 1995. While not part of the original study design, these data provided an addi- tional year effect for a portion of the study. The complete set of clipping treatments was applied in both 1993 and 1994, while the heavily clipped treatment plots were clipped but not vacuumed in

1995.

Each vegetation height treatment within each plant community was randomly assigned to 2 pairs of rainfah simulation plots. The 3 clipping treatments were not intended to duplicate effects of large animal grazing. Livestock, even under the most severe conditions, would not likely remove as much biomass and surface cover as occurred with the heavy clipping treatment. The moderate clipping treatment removed vegetation at a uniform height across the plots, which again would not be very representative of livestock grazing.

Plot Installation

Twelve, 3- X 10-m rainfall simulation plots were randomly located by pairs in each plant community (same vegetation height treatment for both plots) with 3 m between plot pairs. Steel sheet metal (2.5~mm thick by 15-cm high) was driven into a 6-cm deep slot cut around the 2 sides and upper perimeter of each plot. A 0.5-m wide sheet metal tray was attached to the lip of the upper edge of the plot. A 5 nozzle spray bar above the tray provided additional water to the plot to represent upslope overland water flowing onto the riparian area. Troughs at the lower edge of each plot collected and directed the runoff water through a small criti- cal depth flume. Depth of water flowing through the flume was measured with a bubble flow meter and recorded at 1 min inter- vals. Each flow depth measurement was converted to an equiva- lent runoff rate.

Plot Characterization

After treated plots were clipped, but prior to the simulation runs, surface and vegetative characteristics were measured in both 1993 and 1994. Vegetation basal cover, species composition and soil surface cover were determined by point frame methodol- ogy with 100 points per plot (Platts et al. 1987, Bonham 1989).

Vegetation density was determined by counting the number of stems in three 0.125 m* circular frames randomly located in each simulation plot. Soil surface roughness was measured with a 0.6- X 2.0-m elevation table (Linse 1992). The table was placed lengthwise in the center of the upper l/3 portion of each plot and the relative elevation of 100 points on a lo-cm grid was mea- sured. The standard deviation of the points about a flat plane was calculated as a measure of random roughness for each plot.

Aboveground biomass that remained on the plots following the rainfall simulation runs was measured. Vegetation was clipped to ground level in three 0.125 mz circular frames randomly located in each plot, bagged and dried in a forced air oven at 50” C.

Treatments

Three vegetation stubble height treatments were evaluated Rainfall Simulation

within each plant community; (1) heavy clipping-vegetation Soil samples from the surface 6 cm were collected from each clipped to the soil surface (O-cm stubble height) and vacuum plot for soil moisture determination prior to running the simula- removal of all clipped and loose litter material, (2) moderate clip- tor. A “Swanson type” rotating boom rainfall simulator (Swanson ping-vegetation clipped to a lo-cm stubble height with the 1965) was used to apply water to 2 plots simultaneously. Each clipped vegetation raked and removed, and (3) control simulator run consisted of 2 phases. Water was applied at approx- (unclipped-undisturbed natural height vegetation (grass: 20 to imately 60 mm hr.’ for the dry run until runoff approached a rela- 25 cm high; sedge: 30 to 40 cm high). tively constant value as measured in the critical depth flumes The study was conducted during the summers (June-July) of (equilibrium runoff) and then continued for an additional 20 min.

1993 and 1994. As part of another study, the heavily clipped plots Most dry runs lasted 45 to 60 min. The dry run was followed by a

316 JOURNAL OF RANGE MANAGEMENT 51(3),May 1996

(3)

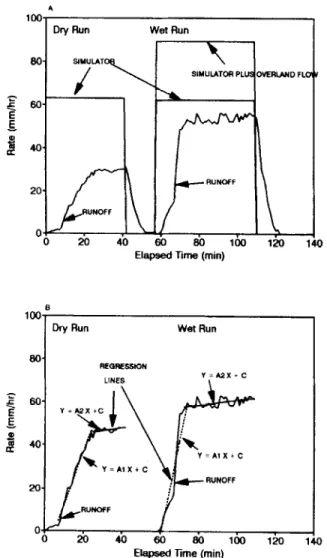
30 min shut-down period with no water application. This shut- down period allowed a partial soil-water redistribution in the upper portion of the soil profile. Water continued to run off some plots for a major portion of the shut-down interval. It was assumed that soil moisture was at or near saturation in the surface layers at the start of the second simulator run (wet run). For the wet run, rainfall simulation was 60 mm hr’, with additional overland flow water added at the top of the plot at an equivalent rate of 25 mm hi’. This wet run simulation event continued for approximately 20 min after runoff had reached equilibrium (Fig. 1A).

Rainfall simulator intensities were to be the same for each plot and rainfall simulation period. Water supply fluctuations and wind sometimes caused slightly different amounts to be applied (Gamougoun et al. 1984, Simanton et al. 1991). The actual water application rate of the simulator was measured and recorded at l- min intervals with a 20-cm diam. rain gauge equipped with a bubble flow meter placed between the paired plots. The distribu- tion and variation in total water applied by the simulator for each run was measured with 6 small non-recording plastic rain gauges located within each plot boundary. The mean of the 6 rain gauges on each plot was used to adjust the amount of water applied as measured by the recording rain gauge. Water application rate

A 100

Dry Run Wet Run

r

0 20 40

SIMULATOR PL OVERUND FL

Elapsed lime (min)

Dry Run Wet Run

I I

Elapsed lime (min)

Fig. 1. Typical runoff hydrograph from a rainfall simulator plot ihstratiag actual runoff and water application rates (A), and best fit regression lines of runoff percentage (B).

through the overland flow spray bar was determined by volumet- ric sampling of the discharge of each nozzle during each simula- tor run.
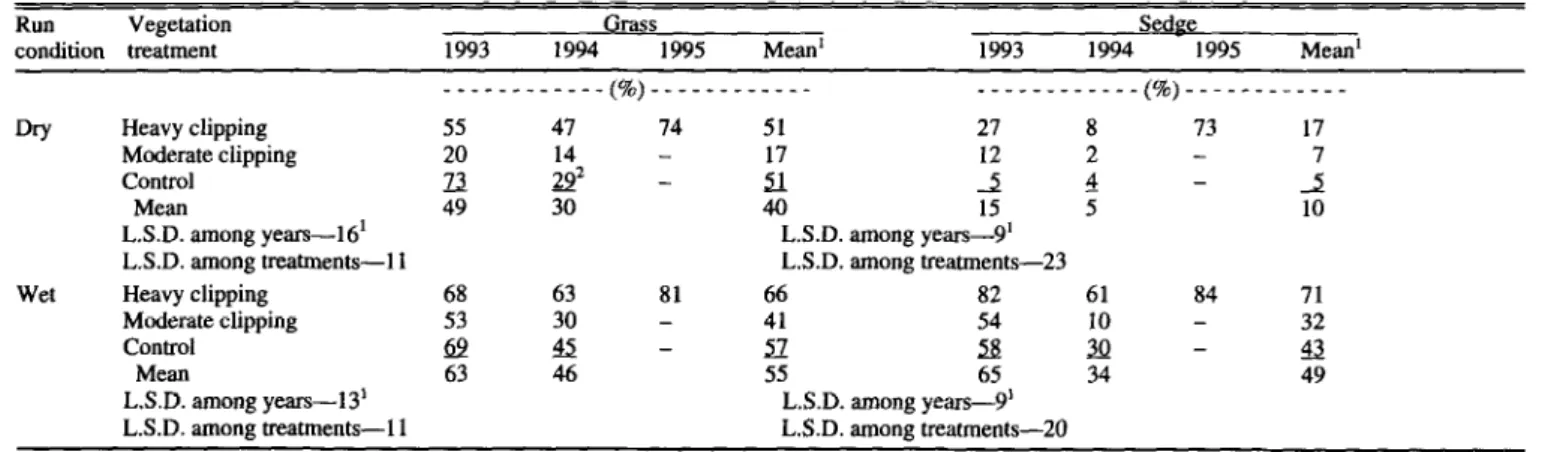
Runoff Analyses

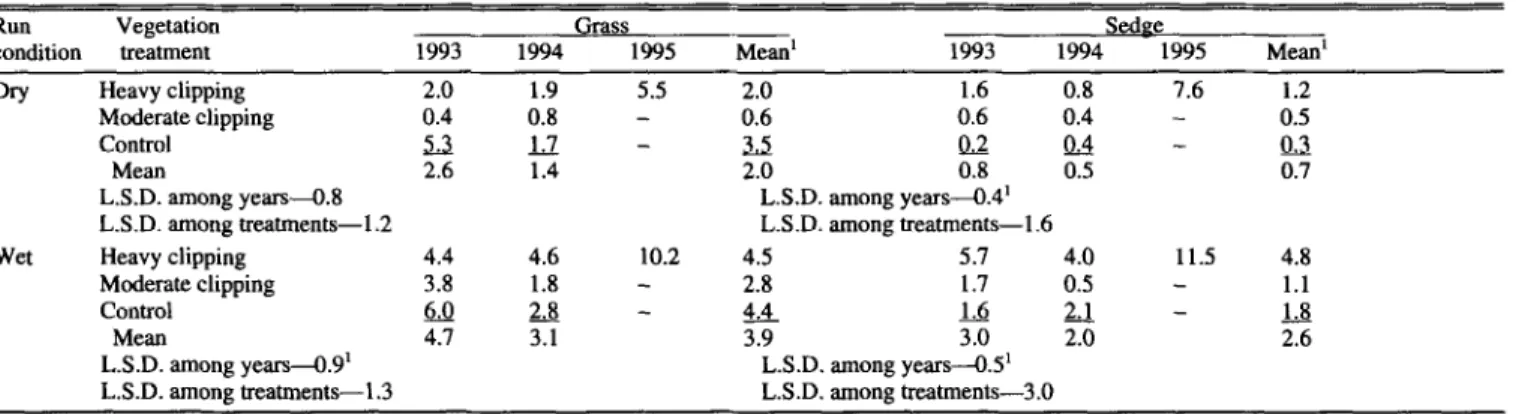
Runoff percentages [(runoff-rate/rainfall-rate) X 1001 at equi- librium are standard measures frequently used for comparing treatment effects (Simanton et al. 1991). Equilibrium runoff is generally a uniform and reproducible condition that is achieved when soil surface layers are saturated and is normally considered to be representative of long duration precipitation events that exceed the infiltration rate. These runoff values do not provide information on effects of treatments, soils, and vegetation during the initial stages of runoff. In some instances, initial runoff may be more important under natural rainfall events where storm durations may be too short for equilibrium runoff to occur. Under these conditions, conclusions based on equilibrium runoff condi- tions may not be applicable. Therefore, we separated the runoff hydrograph into segments that corresponded to different stages of the runoff event that allowed for interpretation of treatment effects that should represent more natural runoff events.

Runoff percentages were computed at 1 -min intervals and tabu- lated into a runoff percentage hydrograph for each water applica- tion phase (dry and wet runs) for each plot. Runoff percentage hydrographs were then subdivided into components representing;

(1) time to runoff initiation, (2) rate of change in runoff percent- age after runoff initiation, and (3) equilibrium runoff rate. The end points of each runoff hydrograph segment were determined using the data breakpoint approach developed for analyzing pre- cipitation data (Brakensiek et al. 1979). Least squares regression analysis was used to fit a straight line to each runoff segment (ris- ing limb and equilibrium stage of a hydrograph). The coefficients of the 2 regression lines for each dry and wet run were used in the analyses to evaluate treatment effects on runoff characteristics (Al and A2 in Fig. IB).

Data Analyses

The experimental design was a 2 X 3 factorial experiment with 2 years (1993 and 1994) and 3 vegetation height treatments. A repeated measures split plot analysis of variance was conducted on the various runoff parameters. Individual rainfall simulator plots are referred to as subplots. The pair of simulator plots run at the same time are replications. Data for each plant community were analyzed separately, with vegetation height and year as the main effects. Also, because of differences in soil moisture between the dry and the wet runs, plus the additional runon water applied during the wet run, the 2 runs were analyzed separately.

When “F” values were significant (P I 0.10 unless noted other- wise), a Fisher Protected L.S.D. test was used to determine differ- ences among means for vegetation height treatments and years.

Results and Discussion

Precipitation at the Sheep Creek study area was much lower in the late-winter, spring and early-summer of 1994 than in 1993.

The upper soil profile (0 to 6 cm depth) was wetter at the start of

the simulator runs (dry run) in 1993 (62% average soil water con-

tent by weight) than in 1994 (43% average soil water content)

and it was even drier in 1995 (15% average soil moisture).

(4)

Table 1. Average aboveground biomass (*SE) for 3 clipping treat- ments on,rainfall simulation plots in 2 montane riparian plant communities

Vegetation Grass Sedee

treatment 1993 1994 1993 1994

Heavy clipping

---b-- _______ (gm-*) _____-___--__

0 0

Moderate clipping 135t28 156*56 83~10 12w

Control 263~i5 214+75 3OOzt27 339i57

Vegetation and Site Characteristics

Mean vegetation density averaged across clipping treatment and years was 2,025 stems me2 and 643 stems rn-* in the grass and sedge plots, respectively. Stem density was more variable among treatments for the grass plots than for the sedge plots (Fig. 2), indicating some spatial variability among plots even though both sites were considered homogeneous. Aboveground biomass at the end of the rainfall simulations were not different among years and plant communities, ranging from 0 for the heavy clipping treatment, 83 to 156 g rn-* for the moderate clipping treatment and 214 to 339 g m+* for the unclipped control (Table 1). Plant com- position was similar among treatments for the sedge community, but the grass component was less and forb component greater for moderate clipping treatment plots in the grass community (Table 2). The litter component represented both loose litter on the soil surface and material of the surface organic layer. During random- ization of the treatments, the 4 moderately clipped grass plots were located in a drier portion of the grass study area farthest from the stream. This may have biased some of the runoff results.

Plot slopes ranged from 2.9 to 4.4% at the sedge site and 3.0 to 4.6% at the grass site. Visually, the plots’ surfaces were very rough; a result of vegetation tussocks. The mean standard devia- tion for surface roughness, as measured with the elevation table, indicated high surface roughness, but there were no differences among stubble height treatments or between plant communities.

Surface roughness is very difficult to characterize. Previous attempts to relate random roughness to surface roughness have not been very successful (Simanton et al. 1991). It may not be the random roughness that affects runoff; instead small drainage

01

HEAW MOD CONT HEAVY MOD CONT

GRASS SEDGE

Fig. 2. Mean stem density (+ SE) on rainfall simulation plots in 1993 and 1994 for 3 clipping treatments in 2 montane riparian plant communities.

channels around vegetation and microtopographic features may determine runoff characteristics. Runoff water initially ponds in small depressions (depression storage) that eventually are over- topped allowing water flow progressively downslope through a series of micro-channels. The degree of connectivity, size, rough- ness, and slope of these channels influences the rate of water movement. Random surface roughness measurements will not indicate the number and size of interconnected micro-channels.

We did not measure the micro-channel features in this study.

Therefore, we assumed that within a plant community the surface roughness and micro-channel networks were similar among plots

within a community and stubble height treatment. Also, the micro-channel network of the plots should not have changed among years

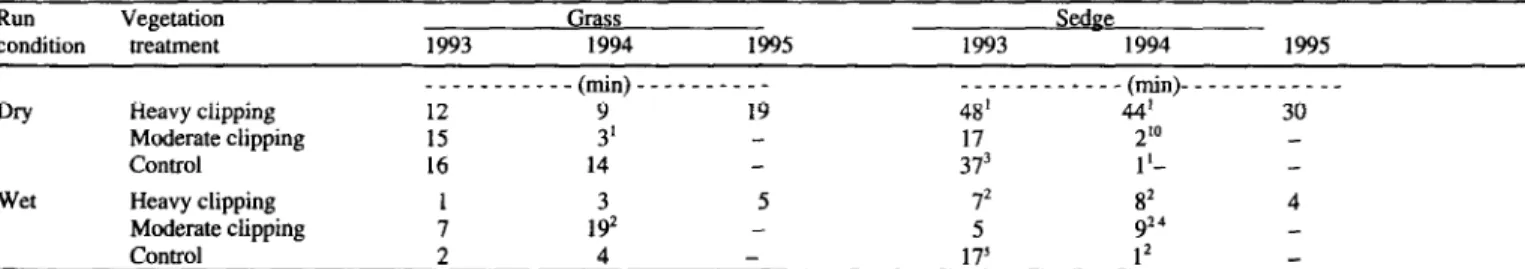
Time to Runoff Initiation

In several instances, no runoff occurred during the dry run (60 min). In 1994 there was 1 plot in the sedge community that did not have runoff even during the wet run. Runoff initiation in the dry run generally occurred within 20 min in the grass community,

Table 2. Average vegetation composition for 3 clipping treatments on rainfall simulation plots in 2 montane riparian plant communities Composition

Plant Year Treatment

community Sedges

ChSSeS

Rushes Forbs Litter’

---(%)---

GEiSS

1993 Heavy clipping 17 21 5 25 32

Moderate clipping 16 8 2 36 37

Control 45 25 9 15 5

1994 Heavy clipping 16 17 3 35 20

Moderate clipping 6 7 4 55 27

Control 23 12 1 2 42

LAD. among years 4.3 2.2 2.9 3.1

L.S.D. among treatments 6.4 3.8 8.1 5.7

Sedge 1993 Heavy clipping 82 1 0 1 15

Moderate clipping 85 1 0 2 14

Contra 81 2 0 1 17

1994 Heavy clipping 71 1 0 I 26

Moderate clipping 75 3 0 2 20

Control 75 3 0 0 22

L.S.D. among years 6.3 1.4 0.7 4.4

LAD. among treatments 6.2 3.9 1.2 5.0

‘Represents both loose litter and the organic horizon on the soil surface.

318 JOURNAL OF RANGE MANAGEMENT 51(3),May 1998

(5)

Table 3. Mean time to runoff initiation for 3 clipping treatments in dry and wet runs for rainfall simulations in 2 montane riparian plant communities.

Run Vegetation Grass Scdne

condition treatment 1993 1994 1995 1993 1994 1995

---(min)--- - _ - - - - - - (fin)- _ - - _ - - _ - - _ -

DrY Heavy clipping 12 9 19 48’ 44’ 30

Moderate clipping 15 3’ 17 2’O

Control 16 14 373 l’-

Wet Heavy clipping 1 3 5 72 8’ 4

Moderate clipping 7 192 - 5 924

Control 2 4 - 17’ l2

‘Two plots did not have runoff in the 60 min simulation run.

ZInclades 2 plots with no runoff in the dry run.

b plots did not have runoff in 60 min.

%cludes 1 plot with no runoff in the dry run.

%ncludes 3 plots with no runoff in the dry run.

but frequently required longer than 20 min in the sedge commu- nity (Table 3). There were no significant differences in time to runoff initiation that could be attributed to differences in vegeta- tion height treatment in either plant community. There was a trend for the time to runoff initiation to be greater in 1993 than in 1994 in both plant communities. Observations during the simula- tor runs indicated only a partial wetting of the sedge plots surface soil that had a well developed organic layer, especially for the dry runs. This indicates a water repellent surface. One possible rea- son is that the drier conditions in the spring of 1994 made the sur- face of the organic layer water repellent for a short time during the initial simulation runs (dry runs). This condition has been reported for Mollisols in the Pacific slope forest areas where soils have low bulk densities covered by an organic horizon (Holzhey 1969). During dry runs in 1995 on heavily clipped treatment plots, we observed an initial surface ponding of water until just before runoff began. Then water would suddenly start to infiltrate into the organic horizon. Runoff would occur only after the sur- face organic layer had become thoroughly wetted. This initial non-wetting is characteristic of a partial water repellent soil layer (Myers and Frasier 1969).

Time to Peak Runoff

The time from runoff initiation to peak runoff was similar for both the dry and wet runs in 1993 and 1994 on the grass plots, but decreased in 1994 in the sedge plots as compared with the grass plots (Table 4). Contrary to normal situations where time to peak runoff decreases as soil moisture increases, the time to peak runoff in wet runs was longer than the time to peak runoff in dry

runs. While this characteristic did not occur on every plot, the mere fact that it occurred is a further indication of a partial water repellent effect that decreased with time. This phenomenon has been observed at sites where soil is coated with an organic mater- ial that creates a hydrophobic condition (DeBano 1969).

Rising Limb Runoff

A smaller regression coefficient (slope of the rising limb, Al) (Fig.l), (slower rate of runoff) was obtained in dry runs for the moderate stubble height treatment than either the heavy or unclipped treatment on the grass plots in 1993 and 1994 (Table 5).

Although not always significant, this slower rate of rising limb runoff from the grass plots was consistent across both years and wet vs dry runs. This indicated that the moderate stubble height treatment reacted differently in the initial runoff flow process than did other treatments, or that plot location affected runoff results.

This difference was not found consistently for sedge plots. There was a tendency for the dry run regression coefficients to be small- er for sedge plots than for grass plots. This was not as pronounced in wet runs on the heavy clipping treatment plots, but was seen on the moderately clipped and control plots.

There was a major increase in the rising limb runoff regression coefficient, Al, for the heavy clipped treatment plots in 1995 compared with the previous 2 years for both vegetation commu- nities and simulation runs (Table 5). In 1995, once runoff began, the rise to peak runoff was very rapid. Since there was little or no change in the micro-topography of the plots or vegetation, this change in runoff characteristic is attributed to the drying of the organic layer that created a partial water repellency. The plots

Table 4. Mean time from runoff initiation to peak runoff in 3 clipping treatments for dry and wet runs of rainfall simulations in 2 montane ripariau plant communities.

Run Vegetation GraSS Sedp

condition treatment 1993 l(Tn) 1993 1994e 1995

__________

;2 20

_______

17

--_--_---_-_ (ti) -___________

W Heavy clipping 11 15’ 4’ 12

Moderate clipping 26 16’ 17 18’

Control 11 2 213 6’ -

Wet Heavy clipping 16 12 8 192 92 4

Moderate clipping 12 221 28 gz4

Control 14 12 315 92

‘Two plots did not have runoff in the 60 min simulation run.

ZIncludes 2 plots with no runoff in the dry run.

3Thnx. plots did not have runoff in 60 min.

kcludes 1 plot with no runoff in the dry NIL

‘Includes 3 plots with no runoff in the dry run.

JOURNAL OF RANGE MANAGEMENT Sl(B),May 1998

(6)

Table 5. Regression coeffh-nts (Al) for rising limbs of runoff bydrographs for wet and dry simulator runs in 2 montane riparian plant communities as affected by 3 clipping treatments.

Run Vegetation Grass Sedee

condition treatment 1993 1994 1995 Mean’ 1993 1994 1995 Mean’

DV Heavy clipping 2.0 1.9 5.5 2.0 1.6 0.8 7.6 1.2

Moderate clipping 0.4 0.8 - 0.6 0.4 - 0.5

Control L3 1.7 -

ii

Q2 QA - a3

Mean 2.6 1.4 2.0 0.8 0.5 0.7

L.S.D. among years-O.8 LAD. among years-O.4’

L.S.D. among treatments-l.2 L.S.D. among treatments-l .6

Wet Heavy clipping 4.4 4.6 10.2 4.5 5.7 4.0 11.5 4.8

Moderate clipping 3.8 1.8 - 2.8 1.7 0.5 - 1.1

Control 6.0 a - 4.4 1.6 2.1 - u

Mean 4.7 3.1 3.9 3.0 2.0 2.6

L.S.D. among years-O.9’ L.S.D. among years--OS1

L.S.D. among treatments-l.3 L.S.D. among treatments-3.0

‘Data for 1993 and 1994 only

were not vacuumed after clipping in 1995 which resulted in less disturbance of the soil surface, but added to surface litter. If the lit- ter and organic layer are water repellent and restrict water infiltra- tion, then vacuuming the litter in 1993 and 1994 would have reduced runoff rates in those years. With no vacuuming in 1995, the initial runoff rate should have been greater.

Equilibrium Stage Runoff

A true equilibrium runoff rate was not achieved in many instances during the time of a rainfall simulation run. The infiltra- tion rate will decrease, but at a slower rate of change with time as the soil becomes saturated at increasingly deeper depths. The equilibrium runoff regression coefficient, (Fig. 1) is an indicator of the rate of change in infiltration. A positive coefficient (A2) indicates equilibrium runoff has not been reached. The closer the coefficient is to zero, the closer the site is to achieving runoff equilibrium. A coefficient (A2) of zero indicates a true equilibri- um. A negative coefficient is a decrease in runoff with time (increasing infiltration). This latter condition is frequently encoun- tered on crusted or water repellent soils (DeBano 1975)

Mean equilibrium stage regression coefficients (A2) for rainfall simulation at Sheep Creek varied from -0.45 to 0.93 (Table 6).

From a total of 96 rainfall simulations, 16 had negative runoff regression coefficients (A2) (data not shown). This pattern was not related to year or treatment. This is further evidence of some water repellency of the soil surface.

Mean Equilibrium Runoff

Equilibrium or final runoff rates are usually the parameter used as an indicator of treatment differences (Simanton et al. 1991).

There was a decrease in the mean equilibrium runoff percentages

Table 6. Regression coefficients (A2) for the equilibrium stage of runoff bydrograpbs for wet and dry rainfall simulation runs in 2 montane riparian plant communities as affected by 3 clipping treatments.

Rml Vegetation Grass Scdve

condition treatment 1993 1994 1993 1994

Dry Heavy clipping .93 .27 24 .06

Moderate clipping .20 .i3 -.45 .04

Control .29 A4 - .oo

Wet Heavy clipping .09 .26 .07 .02

Moderate clipping .22 .03 .29 .04

Control .26 .17 .hS .25

320

across most vegetation height treatments in 1994 compared with 1993 for both wet and dry runs in both plant communities (Table 7). This is attributed to drier soil profiles in 1994 than in 1993.

Equilibrium runoff percentages (runoff/rainfall rate) on the moderate stubble height grass plots were lower than the heavily clipped or control plots for both dry and wet runs (Table 7). The location of the moderate height plots may have affected the mean runoff results for this treatment. These differences were not found for the sedge plots. Runoff during the dry run in 1993 for the sedge community was lower than for the grass community. These differences were not evident during the wet runs.

Analysis of variance of equilibrium runoff percentages showed a year*treatment interaction at the grass site for the dry runs. This interaction resulted from a low mean equilibrium runoff percent- age for the control treatment in 1994 (Table 7).

Equilibrium runoff percentages for the dry runs in the sedge community were lower than from the grass community for 1993 and 1994 (Table 7). These differences were not as evident in the wet runs. In some instances, it required almost 60 min of simulat- ed rainfall to generate runoff at the sedge site during dry runs.

Visual inspection of the plots during the simulator runs indicated an initial ponding of water on the soil surface. After a few min- utes, this water infiltrated into the soil. Once the upper soil profile became wetted, NnOff began. This effect has been observed with water repellent soils (Letey et al. 1962, Hillel 1967, Meeuwig 1971 as reported in DeBano 1975). One possible explanation for this is that dry organic matter on the soil surface was slightly hydrophobic (Savage 1975). This water repellency effect gradual- ly dissipated with time.

Runoff percentages for the 2 plant communities were similar for the wet runs after the soil was thoroughly wet. Equilibrium runoff percentages in both the dry and wet runs from the moder- ately clipped grass plots were significantly lower than from the heavily clipped or control treatments which, may have been affected by plot locations. While not statistically significant, there was slightly higher equilibrium runoff in the dry runs from the heavily clipped plots in the sedge community compared with the moderately clipped and control areas.

Equilibrium runoff for the heavily clipped treatment plots was higher in 1995 than for the previous 2 years in both vegetative communities and both simulation runs. This occurred even with less antecedent soil moisture at the start of the dry run in 1995, compared with the previous years. Again, the increased runoff rate in 1995 might be explained by sealing or water repellency of the soil surface.

JOURNAL OF RANGE MANAGEMENT 51(3),May 1998

(7)

Table 7. Mean equilibrium runoff percentages for rainfall simulation plots in 2 montane riparian plant communities as affected by 3 clipping treat- ments.

Run Vegetation G&3.% Sedge

condition treatment 1993 1994 1995 Mean’ 1993 1994 1995 Mean’

---(%)--- ---(%)---

Dry Heavy clipping 55 47 74 51 27 8 73 17

Moderate clipping 2 -

Control $ $ z :: 5 4 :

Mean 49 30 40 15 5 10

L.S.D. among year-16l L.S.D. among years-9’

L.S.D. among treatments-l I L.S.D. among treatments-23

Wet Heavy clipping 68 63 81 66 82 61 84 71

Moderate clipping

Control 2 ; I g $ g I 2

Mean 63 46 55 65 34 49

L.S.D. among years-13’ L.S.D. among years-9’

L.S.D. among treatments-l 1 L.S.D. among treatments-20

‘Data for 1993 and 1994 only.

$niticant interaction (P 5 0.10) of treatment and year for the grass site Summary and Conclusions

A rotating boom rainfall simulator was used to evaluate the effects of vegetation height treatment on surface runoff character- istics in 2 montane riparian plant communities. Three vegetation height treatments were evaluated; (1) heavily clipped-vegeta- tion clipped to the soil surface and vacuum removal of ah clipped material, (2) moderately clipped-vegetation clipped to a lo-cm stubble height and all clipped material removed, and (3) control (unclipped)--undisturbed natural height. Each rainfall simulation consisted of 2 phases, a dry run (60 mm hour-‘) for about 60 mm followed by a wet run (60 mm hour-‘) 30 mm later. Runoff hydro- graphs (runoff rate/water application rate) were subdivided into 3 components representing: (1) time to runoff initiation; (2) rate of change in runoff rates in the rising limb; and (3) equilibrium runoff rate.

There were no differences in time to runoff initiation for either dry or wet rainfall simulation runs that could be attributed to dif- ferences in vegetation height treatments in either riparian plant community. It usually required longer for runoff to be initiated in the sedge community compared to the grass community.

Regression coefficients of the hydrographs’ rising limbs for dry runs indicated that moderately clipped vegetation restricted water flow rate in the initial runoff process. There were differences in equilibrium runoff percentages among vegetation height treat- ments in the grass community, but these differences may have been affected by plot location. Generally, there were lower equi- librium runoff percentages from dry runs in the sedge community compared with the grass community. These differences were smaller in wet runs. These results indicated that vegetation height was not a controlling feature in the runoff process from the 2 riparian plant communities studies. However, stubble height cri- teria may be important to maintain plant vigor and streambank stability.

Several runoff parameters had characteristics of runoff from water repellent soils. The organic layer on the soil surface exhib- ited signs of water repellency which reduced water infiltration rate during the initial stages of the rainfall simulation events.

These results indicate that runoff and infiltration processes in the surface organic horizon of riparian zones may not respond in the classical manner. This characteristic has important implications if

JOURNAL OF RANGE MANAGEMENT 51 (S),May 1998

criteria developed in areas with less organic matter on the soil surface are used to manage overland flow water in the riparian zone. Additional studies are needed to fully describe the water infiltration processes in riparian plant communities.

Literature Cited

Bohn, C.C. and J.C. Buckhouse. 1985. Some responses of riparian soils to grazing management in northeastern Oregon. I. Range Manage.

38:378-381.

Bonham, C.D. 1989. Measurements for Terrestrial Vegetation. John Wiley and Sons, New York, N.Y. 338 p.

Brakensiek, D.L., H.B. Osborn, and W.J. Rawls. 1979. Field manual for research in agricultural hydrology. USDA-SEA Agr. Handb. No.

224. Washington D.C., 548 p.

Clary, W.P. and B.F. Webster. 1989. Managing grazing of riparian areas in the intermountain region. USDA For. Ser. Gen. Tech. Rep.

JNT-263. 12 p.

DeBano, L.F. 1969. Water movement in water-repellent soils. pp. 61- 89. Leonard F. DeBano and John Letey (Eds.) Water Repellent Soils, Proc. Symp. on Water Repellent Soils., 6-10 May 1968. Riverside, Cahf. Univ. of Calif., Riverside, Calif.

DeBano, L.F. 1975. Infiltration, evaporation and water movement as related to water repellency. pp, 155-164. In: B.A. Stewart (Ed.). Soil Conditioners. No. 7 SSSA Spec. Pub]. Series. Soil Sci Sot. of Amer., Madison, Wise.

Gamougoun, N. D., R.P. Smith, M. K. Wood, and R. D. Pieper. 1984.

Soil, vegetation, and hydrologic responses to grazing management at Fort Stanton, New Mexico. J. Range Manage. 37(6):538-541.

Hall, F. C. and L. Bryant. 1995. Herbaceous stubble height as a watn- ing of impending cattle grazing damage to tiparian areas. USDA For.

Serv. Gen. Tech., Rept. PNW -GRT -362. Portland, Ore. 9 p.

Hansen, P.L. 1988. Conflict in the riparian zone: the effects and chal- lengesof agricultural use. West. Wild. 14:12-16.

Heede, B.H. 1990. Vegetative strips control erosion from watersheds.

USDA For. Serv. Res. Note l&I -499. 5 p.

Hillel, D. 1967. Runoff inducement in arid~lands-final report submitted to USDA-Pro&t No. AlO-SWC-36. Volcani Inst. Am. Res. and Hebrew Univ. of Jerusalem Fat. of Agr., Rehovot, Israel. 122 p.

Holzhey, C.S. 1969. Soil morphological relationships and water repel- lence. pp. 291-287. In: Leonard F. DeBano and John Letey (Eds) Water Repellent Soils, Proc. Sym. on Water Repellent Soils. 6-10 May 1968. Riverside, Calif. Univ. of Calif., Riverside, Calif.

Letey, J., J. Osbom, and R.E. Pelishek. 1962. The influence of the water solid contact angle on water movement in soil. Bull. Int. Assoc.

Sci. Hydrol. 3:75 -81.

321

(8)

Lll, S.J. 1992. The influence of ground cover on upland erosion. MS.

Thesis. Univ. of Wyoming, Laramie, Wyo. 98 p,

Meeuwig, R.O. 1971. Infiltration and water repellency in granitic soils.

USDA-For. Serv. Res. Paper INT-111.20 p.

Myers, L.E. and G.W. Frasier. 1969. Creating hydrophobic soil for water harvesting. J. hr. and Drain. ASCE IR-1 95:43-54.

Noor, M. 1998. Evaluation of ANSWERS model for prediction of sedi- ment yield from a riparian zone. Ph.D. Diss. Colorado State Univ., Ft Collins, Colo. 105 p.

Pearce, R.A. 1995. Sediment movement and filtration within laboratory an riparian vegetation buffer strips. Ph.D. Diss. Colorado State Univ., Ft Collins, Colo. 190 p.

Platts, W.S., C. Armour, G.D. Booth, M. Bryant, J.L. Bufford, P.

Cuplin, S.H. Jensen, G.W. Minshall, S.B. Monsen, R.L. Nelson, J.R. Sedell, and J.S. Tuhy. 1987. Methods for evaluating riparian habitats with applications for management. USDA For. Serv. Gen.

Tech. Rept. No. RM-120. 177 p.

Popolizio, CA., H. Goetz, and P.L. Chapman. 1994. Short-term response of riparian vegetation to 4 grazing treatments. J. Range Manage. 47:48-53.

Rosgen D.L. 1994. A classification of natural rivers. Catena 28: 167-199.

Savage, S.M. 1975. Occurrence and phenomenon of natural and fire - induced soil water repellency. pp 165-175. In: B.A. Stewart (Ed.) Soil Conditioners. No. 7 SSSA Spec. Publ. Series. Soil Sci. Sot. of Amer., Madison, Wise.

Schulz, T.T. and W.C. Leiniiger. 1998. Differences in riparian vegeta- tion structure between grazed and exclosure. J. Range Manage.

43:295-299.

Siianton, J.R., M.A. Web, and H.D. Larsen. 1991. Rangeland exper- iments to parameterize the water erosion prediction project model:

vegetation canopy cover effects. J. Range Manage. 44:276-282.

Skovlin, J.M. 1984. Impacts of grazing on wetlands and riparian habitat:

a review of our knowledge. pp. 1001-l 102. In: Developing Strategies for Range Management. Westview Press, Boulder, Colo.

Swanson, N.P. 1965. Rotating-boom rainfall simulator. Trans. Amer.

Sot. Agr. Engr. 8:71-72.

USDA Soil Conservation Service and Forest Service. 1988. Soil sur- vey report. Larimer County area, Colorado. Naz 70 soil series. U.S.

Gov. Printing Of&e: 239-812/48. Washington, D.C.

322 JOURNAL OF RANGE MANAGEMENT 51(3),May 1998

Figure

Fig.  1.  Typical  runoff  hydrograph  from  a  rainfall  simulator  plot  ihstratiag  actual  runoff  and  water  application  rates  (A),  and  best  fit  regression  lines  of  runoff  percentage  (B)
Table  2.  Average  vegetation  composition  for  3 clipping  treatments  on  rainfall  simulation  plots  in  2 montane  riparian  plant  communities  Composition
Table  3.  Mean  time  to  runoff  initiation  for  3  clipping  treatments  in  dry  and  wet  runs  for  rainfall  simulations  in  2  montane  riparian  plant  communities
Table  5.  Regression  coeffh-nts  (Al)  for  rising  limbs  of  runoff  bydrographs  for  wet  and  dry  simulator  runs  in  2  montane  riparian  plant  communities  as  affected  by  3  clipping  treatments
+2

References

Related documents

However, relevant courses, reading literature or colleagues’ support and advice can also help to “gain, maintain and use educational knowledge appropriately” (Knight &

Objectives: 1) To measure and compare the time required to perform (pTUG) and the time required to imagine (iTUG) the Timed Up & Go (TUG), and the time difference between these

In an environ- ment that remains highly competitive, organiza- tions invest in talent activities not only to meet their immediate needs with regards to human resources and the

should be initialed and rubber-stamped (or seal) by the same person, who signs the tender document. Failing so, the tender may be rejected. 8) All the rates and

Other reports of MDR-TB in children include a previous study from Cape Town of 39 children with culture- confirmed disease; similar to the present study, treatment delay was common

The paper is divided into four sections: section 2 describes the smart and resilient city approaches that can help urban planners and policy makers deal with energy and climate