Munich Personal RePEc Archive
A developmental model on quantifying
urban policy effectiveness in port city
relations
Feng, Lin and Yuan, Liwei
Transportation Management College, Dalian Maritime University,
Transportation Management College, Dalian Maritime University
30 August 2017
Online at
https://mpra.ub.uni-muenchen.de/81147/
A developmental model on quantifying urban policy effectiveness in
port city relations
Lin Feng1, Transportation Management College, Dalian Maritime University, Dalian, China, P.O.
Box Linghai Road 1, City, ST 116023; PH (411)8472-6939; E-Mail: [email protected]
Liwei Yuan2, Transportation Management College, Dalian Maritime University, Dalian, China, P.O.
Box Linghai Road 1, City, ST 116023; PH (411) 8472-6939; E-Mail:[email protected]
Abstract:
This paper is to find the role of urban policy in dealing with port city relations and corresponding methodology in quantifying policy effectiveness. In decomposing policy, we identify the key elements in the policy and further to measure its effectiveness. Firstly, we quantify non-linear relation in port city and explain why tradition quantitative methods fail to describe non-linear port city relationship. Secondly, we use improved logistic function derived from product life cycle theory (defined as a developmental model) to identify the evolving pattern in port city and depict the development phase and key elements. Thirdly, cases of Antwerp and Hamburg are used in analyzing how urban policy is effective in enhancing port city relations. It is difficult to quantify policy effectiveness thus we focus on how key elements in these policies are enhanced in promoting port city development even though port city are at different developmental phases and these policies can solve conflict between private port governance and public urban nature.
Port city relation is conceptualized from three perspectives. Firstly, “Port cities are thus typical illustrations of local–globalinteractions taking place between territories, production networks,and commodity chains through physical transfers and sector-specific services”(Wang and Ducruet, 2012)1.This concept was confirmed by both
academic and empirical analysis by Hesse (2010)2 and Jacobs et al., (20103, 20114).In
this view, port city-region relationship is defined as local-global physical commodity and service exchange. Local-global linkage is interpreted with several dimensions: local port authority, city policy makers and global terminal operator, shipping agents, carriers and investors in urban economy. In public port sector, this is more challenging that local public port management and urban planners confront with private initiated activities, e.g. operation efficiency, capital profitability driven by private owners while public policy, e.g. public interests and sustainable development, in some cases, is conflicting with above private interests. This is particularly the case in public-to-private ports (Iannone, 2012)5.
market and global terminal owners and network actors are widely discussed (Fremont and Ducruet, 20057; Fujita, 20078).
Secondly, port city relation is conceptualized as public-to-private interaction (in some cases, public-to-private partnership, PPP) with initiation of formal and informal institutional arrangements. Port governance is conceptualized on institutional governance on ports and port authorities (Verhoeven and Vanoutrive, 2012)9. In this
aspect, port city relation becomes complication and conflicts of stakeholders (Debrie and Raimbault, 2016)10 in order to identify their impact on urban form (Graham &
Marvin, 200111; McKenzie, 200612). This interpretation of port city relation is
associated with port governance evolution in global major gateway port cities. In this process, decentralization and corporatization of port governance in most countries with private and foreign capital introduction, in some cases, i.e. China, cause interest conflict between public and private stakeholders (Cullinane and Wang, 2007)13.
Further, port city-region relation is in association with metropolitan process (Wilmsmeier and Monios, 2016)14 and may cause spatial tension in terms of land use,
waterfront area development when both port and city expand geographically. Meanwhile, it is evidenced that coastal port cities possess dominant resources, like accessibility to international trade, preferential policy support in some case countries, especially emerging economies and early port phase in developed economies (Wang, Ng and Olivier, 2004)15.By the year of 2000, approximately 80% of the global 25
largestcities were ports, compared to 60% in 1925 and 50% back in 1900 (Verhetsel and Sel, 2009)16. As a result, inequity exists widely in counties with easier access to
seaborne shipping and those without (Laxe, Seoane and Montes, 201217; Xu et.al.
201518), and within the same country between coastal cities and inland areas (Wang
and Ducruet, 2014)19.
affiliated system, e.g. logistics chains, inland transport, has been widely discussed (Cullianane et.al, 201220; Gripaios et.al. 199521). Ports, in a result, have become more
spatially dispersed and imposing new geographical economic impact on relevant stakeholders and spatial regions. In this context, the role of port with logistics delicateness and geographical reach in global trade routes and supply chain systems has “made the joint, harmonious development of ports and cities” (Haezendonck, et.al, 2014)22. Functional extensions of port also contribute to the new description of
hinterland, i.e. extended, disconnected, fragmented hinterland has been proposed (Notteboom, 2008)23. Impacts of ports on far-reaching hinterland by analyzing
freight distribution along major shipping routes have been researched well in above research papers. In this context, there is an increasing tendency that ports depend less on their city in terms of direct physical commodity transport, but port related tertiary sectors in port city, like logistics and warehousing, finance, packaging, etc. becomes demanding.
Above discussions on port city concepts address multi-dimensions and imply that nature and structure of port city relation have been gradually taken for granted by considerable geographers (Ducruet and Ng. 2014)24. Recent researches on port city
relations are associated with market structure, international trade pattern, port development and urban metropolitan process and trade-off in relevant stakeholders.
1. Literature review
Institutional setting is indispensable in discoursing port city interactions from a developmental perspective. First, privatization of port governance has been popular in global ports even though fully privatized ports have not performed to expectations (Baird, 1995)25. According to the government’s participation, such as concession and
and regarded it as a tool in monetary expansion serving national economy in a wide range rather than only an individual port. The level of local government participation and the mediation into port related industry determines the benefits similarity and constraint for both parties(Pemberton, 2000)27. The role of port in global supply
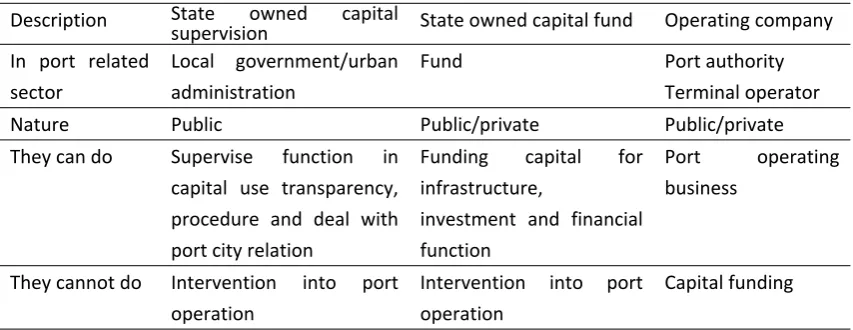
[image:6.595.85.512.289.454.2]chains is subject to capital dimension and value creation dimension. For the port with participation of public private partnership (PPP), a three-hierarchical management structure may be established and isolate any intervention from government to ensure port efficiency (Table 1).
Table 1Three-hierarchical institutional structure in public to private ports
Description State owned capital
supervision State owned capital fund Operating company In port related
sector
Local government/urban administration
Fund Port authority
Terminal operator
Nature Public Public/private Public/private
They can do Supervise function in capital use transparency, procedure and deal with port city relation
Funding capital for infrastructure,
investment and financial function
Port operating business
They cannot do Intervention into port operation
Intervention into port operation
Capital funding
Second, Notteboom, De Langen and Jacobs (2013)28argued that the evolution of port
growth shows great contingency and path dependence, that port authorities are often constrained by their governance structure or institutional setting when they attempt to follow new routines to cope with external environments by applying the ports of Rotterdam and Antwerp. Port development is path dependent and determined by both private investment and public planning which seems to contradict in some circumstances; this was also seen by Monios and Lambert (2012)29
However, evaluating or quantifying the effectiveness of these attempts has become a difficulty for scholars. Pallis (2007)30 evaluated the endorsed port policy reforms
supporting an improvement to key financial indicators by analyzing the financial performance of Greek ports. Gonalez and Trujillo(2008)31 used the DEA(Data
Development Analysis)method to assess multi-port reform in Spanish container ports. A review of policies by Wang, Yu Ng and Olivier (2004)32 also evaluated the
port governance in China and their performance. Most of these papers aren’t concerned with quantifying urban policies. The main reason why it’s difficult to quantify these policies is that the evolution of urban port linkage has been changing, fundamentally accompanied by the deregulation of in-port governance by urban government. In other words, the effect of urban policy on ports is not that clear. Conflicts confronted by the port authority and urban government are land utilization, incompatibility of city and port development, and environment decay. “The port is geographically moving away from the city to at the same time the geographical overlap between the ports” (Wiegmans and Louwa, 2011)33 and the city in terms of
land use diminish. Van Hooydonk (2007)34 has argued that the more value
internationally that the maritime and port industry contributes to, the more energy will have to be put in embedding the port in the local community (Aarts, Daamen,Huijs and de Vries)35. In other words, the economy beyond the city
contributes more to the ports, while the city grows as an economic unitindependent of the port. The institutional factor becomes a research interest to scholars as a useful dimension to explain port city-region dynamics (Liao andHong, 2013)36.
Port city relation is not always positive. With spatial expansion of port, land use and limited space become geographical constrains for both city and port. Land is scarce and expensive in traditional port cities that have evolved from core inner city areas. The mere expansion of the port is often extremely difficult or politically contested (Flämig and Hesse, 2011)37. This congestion includes land use and traffic volume, e.g.,
the port-related industry and urban population, land cargo logistics and urban transportation, etc. In some cases, environmental issues related to the port also draw the attention of literature. Although ports produce comparatively less direct air pollution, relocation and concentration of production factors exert negative pressure on local environment with intention to decrease transport cost and get easier access to the port. This is worse in waterway pollution and river ports with less purifying access compared to seaports. Developing economies are even worse with recent demanding needs for port growth, developed regions, “the port–city interface. European port authorities, who often act as a ‘landlord’ for these locations and companies, logically have a very protective attitude towards these areas, particularly when it comes to the ‘environmental space’ that allows companies to freely run and expand their business” (Daamen and Vries, 2013)38.Additionally, pollution from the
port also intensifies the relationship between the urban residents and the port authority.
Urban ports still possess advantages over other non-urbanized locations when it comes to attract and redirect cargo flows even when these cargo flows are destined for extended hinterlands. A new and dynamic relationship conceptualizes the role of human agency and institutional structures (Hall and Jacobs, 2012)39. Port authorities
generally focus on the development of the local port area and play a minor role in the development of port hinterlands, whereas other players, e.g. shippers, forwarders, and barge and rail operators, have always been involved in the port-hinterland connection and have contributed to the port network (Den Berg and De Langen, 2011).40
2 Traditional model on port city relations
role of the ports in local economy also transforms. The growth of the port and localeconomy doesn’t necessarily synchronize. Ports firstly are to satisfy the trade needs of a city. Traditional economics assumes that local economy (Y) (refers to a city in this part) is composed of two units:
Domestic economy (𝑌𝑑): all products are produced and exchanged within
the city, in other words, the production factors are within the city.
Trade economy (𝑌𝑡): some products will be traded from (and to) the area
beyond the city and can’t be produced within the city. The need for trade promotes ports: Then we’ll have
( ) Eq. 1 Y =𝑌𝑑+𝑌𝑡 𝑌𝑑,𝑌𝑡,𝑌 ≥0
If we suppose that all the cities are isolated and the production factors can satisfy all
needs of the city, then Y=𝑌𝑑, which means there is no trade (refers to international
trade in this part that all products for trading will be through port) for a city. Domestic economy is determined by the total economy, and then we’ll have
Eq. 2
𝑌𝑑=𝑎+𝑏𝑌
(a: constant, when b=0, then Y𝑑=a, a represents the volume of domestic economy in
total city economy when Y=0; b: trade coefficient,a,b≥0)
Eq. 3
𝑌𝑑=𝑎+𝑏(𝑌𝑑+𝑌𝑡)
Eq. 4
1 1‒ 𝑏=
𝑌𝑑
𝑎+𝑏𝑌𝑑
If we combine Eq.18 and Eq.19, we’ll get
Eq. 5
If we suppose there is a needfor a city to trade, then the first derivative of (Eq. 7)
Eq. 6 dy =𝑑(1 ‒ 𝑏)𝑑𝑌𝑡
: the growth of local economy (Y); : the growth of domestic local economy ( )
𝑌' 𝑌'
𝑑 𝑌𝑑
If we combine Eq. 22 and Eq. 24, we’ll get
Eq. 7
𝑌'=𝑌
𝑡' 𝑌𝑑
𝑎+𝑏𝑌𝑡
From (Eq. 8), we come into some basic conclusions:
(1) There is a positive relationship between and 𝑌' 𝑌𝑡' which means growth of
total economy is synchronized with growth of the trade of a city. The increasing trade growth rate will bring fast growth of urban economy.
(2) There is a positive relationship between and𝑌' 𝑌𝑑, the volume of domestic
economy of a city (rather than the growth rate) will accelerate the growth of a local economy.
(3) There is a negative relationship between a and which means the bigger 𝑌' percentage of the domestic production in a total economy, the slower of local economy growth.
(4) There is a negative relationship between b and which means the more 𝑌' dependence on trade will decelerate the growth of a local economy.
(5) There is a negative relationship between 𝑌' and 𝑌𝑡 which means the
absolute volume of trade will undermine the growth of local economy.
Because 𝑌𝑑, a and b will interplay in our function, we’ll get 𝑌'≈ 𝑌𝑡'.𝑓 , (𝑓 ≥0))which
complex and profound influence on both sides they connect through transshipmentof goods, services, labor flow and capital, etc.(Tan, 2007)41
As for the imitation of above traditional methods in analyzing port city relationship, firstly, relationship is not necessarily a linear correlation. Multi factors contribute to port city growth and their development path shows a variety. Secondly, traditional methods don’t illustrate an evolutionary and dynamic pattern of port city. Therefore, we introduce a developmental model in next section to illustrate the developmental phase of port city relationship and research and analyze the role of urban policy in building a more dynamic port city linkage.
3 Logistic function
The Logistic Function by Pierre Francois first depicts population growth. A generalized logistic curve can model the "S-shaped" behavior (abbreviated S-curve) of growth of some populations and a simple logistic function was defined by the formula (Dong, 2007)42.
Eq. 8
𝑃𝑡= 1
1 +𝑒‒ 𝑡
Eq. 9
Y = 𝑐
1 +𝑒𝑏 ‒ 𝑘(𝑡 ‒1995)
Where Y is function; C represents the container throughput; b represents the
maximized predicted container throughput; k is parameter; t is time (year).
Container throughput data for the ports of Antwerp and Hamburg are collected from 1985 to 2011, maximized iteration times of30, and parameter and SSCON reaches of 1.00E-008 are designed. By using SPSS software, non-linear regression analysis of the data are calculated.
3.1 Primary results
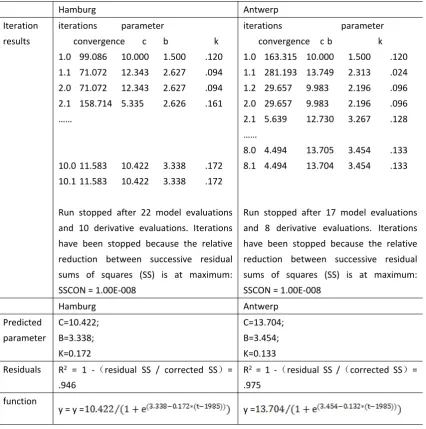
Table 2Logistic function calculation process and results by using SPSS software
Hamburg Antwerp
Iteration results
iterations parameter
convergence c b k 1.0 99.086 10.000 1.500 .120 1.1 71.072 12.343 2.627 .094 2.0 71.072 12.343 2.627 .094 2.1 158.714 5.335 2.626 .161 ……
10.0 11.583 10.422 3.338 .172 10.1 11.583 10.422 3.338 .172 Run stopped after 22 model evaluations and 10 derivative evaluations. Iterations have been stopped because the relative reduction between successive residual sums of squares (SS) is at maximum: SSCON = 1.00E-008
iterations parameter convergence c b k 1.0 163.315 10.000 1.500 .120 1.1 281.193 13.749 2.313 .024 1.2 29.657 9.983 2.196 .096 2.0 29.657 9.983 2.196 .096 2.1 5.639 12.730 3.267 .128 ……
8.0 4.494 13.705 3.454 .133 8.1 4.494 13.704 3.454 .133
Run stopped after 17 model evaluations and 8 derivative evaluations. Iterations have been stopped because the relative reduction between successive residual sums of squares (SS) is at maximum: SSCON = 1.00E-008
Hamburg Antwerp
Predicted parameter C=10.422; B=3.338; K=0.172 C=13.704; B=3.454; K=0.133 Residuals R2 = 1 -(residual SS / corrected SS)=
.946
R2 = 1 -(residual SS /(corrected SS)=
.975 function
y = y = y =
Note: all throughputs in the procession are in thousand million tons. Source: throughputs data were from http://www.oecd.org.
Figure1 Estimated and real throughput for the ports of Antwerp and Hamburg
4A developmental model on ports
The results show the estimated growth pattern for the two ports but if we want to identify their developing stages, we need to further process these results. Therefore, we introduce the FMSR model for the ports growth to illustrate port growth in a Fast,
Moderate, Slow growth and Recovery order.
: Growth rate of port (if >0, it means the port has a fast growth rate)
∆𝑌
𝑡 ∆𝑌 𝑡
: The first derivative of t with respect to Y (if >0, it means the port has
∆(∆𝑌 𝑡) ∆(∆𝑌 𝑡
accelerating growth; if ∆(∆𝑌 𝑡)<0, it means the port has decelerating growth)
: The second derivative of t with respect to Y (if >0, it means a
∆
[
∆(∆𝑌 𝑡)]
∆[
∆(∆𝑌 𝑡)]
rate of accelerating growth; if∆
[
∆(∆𝑌 𝑡)]
<0, it means a rate of decelerating growth)Table 3FMSR model results for the port(s) of Antwerp and Hamburg
Period Hamburg Antwerp
Year △Y/t △ (△Y/t)
△[△
(△Y/t)]
Year △Y/t △ (△Y/t)
△[△
(△Y/t)] Period F 1985–1991 >0 >0 >0 1985–1994 >0 >0 >0 Period M 1991–2000 >0 >0 <0 1994–2007 >0 >0 <0 Period S 2000–2010 >0 <0 <0 2007–2019 >0 <0 <0 PeriodR 2010–2015 >0 <0 >0
Note: period F: fast growth; period M: moderate growth; period S: slow growth; period R: recovery.
Figure 2FMSR model for the port(s) of Antwerp and Hamburg
5A developmental model on cities
The measurement of a city employs multi indicators, Northmam (1979)43proposed
that initial, acceleration and terminal phases for a city development based on demographical principle by using Logistic function. A similar methodology by Chen and Zhou (2005)44was proposedin analyzing coastal urbanization development. In
decompose urban policy by proposing the case of Antwerp to find out what factors embedded in the policy will impact the interface between the port and city (Figure 3).
Table 4FMSR model for the cities of Antwerp and Hamburg
Hamburg Antwerp
Year △Y/t △ (△Y/t)
△[△
(△Y/t)]
Year △Y/t △ (△Y/t)
△[△
(△Y/t)] Period M 1985-1988 >0 >0 <0 1985–1995 >0 >0 <0 Period S 1988-1997 >0 <0 <0 1995–2010 >0 <0 <0 Period R 1997-2020 >0 <0 >0 2010–2019 >0 <0 >0 Note: GDP data of the two cities are from http://www.oecd.org
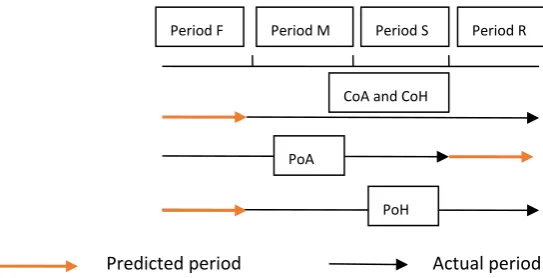
Period F Period M Period S Period R
PoA
PoH CoA and CoH
Predicted period Actual period
CoA: city of Antwerp; CoH: city of Hamburg; PoA: port of Antwerp; PoH: port of Hamburg
Figure 3FMSR model of Antwerp and Hamburg
6A case on developmental model in port city relations
As the second largest city in Belgium and the largest city in the Flanders region, economic structure and employment of Antwerp fit to its port function, but the port governance structure does not fit the economic reality, as there is no metropolitan governance in Belgian cities (De Decker 199945; Loopmans 200746). Van Hamme and
Strale (2012)47 analyzed Antwerp and its three-level governance structure: region,
[image:17.595.122.394.362.501.2]autonomy and sets its own urban and economic policy while receiving European, federal and regional funds in various domains, the provincial level has almost no competence in economic matters; it is limited to economic promotion.” The Antwerp Port Authority, an autonomous municipal structure, administers dock construction and other major infrastructure. To adjust to the challenge brought by globalization, Antwerp shifts towards entrepreneurial policies (Van Hamme and Strale, 2012)48,
which means that the municipality undertakes more work in opening markets, attracts FDI and enhances the role of the city in the European and global city network. It’s difficult to quantify which policy reinforces port development. Therefore, we have undertaken a decomposition of urban government policy to see what factors will enhance port growth when the municipality tries to promote local economic development.
The following table (Table 5) timelines the FMSR model in more details. The comparatively long period was divided into two short phases so that the port and city are in the same time span.
Table 1Urban policy in port city dynamics
Port\city Period M 1985– 1995
Period S 1995– 2007
Period S 2007– 2010
Period R 2010–2019 Period F (1985–
1994)
P(land, governance) Period M
(1994–2007)
P(labor and FDI) Period S
(2007–2010)
P(city brand)
Period S
(2010–2019)
P(knowledge industry)
found in the Antwerpen policy in that period: land use and governance. The port of Antwerp is a landlord port, “which implies the port authority leases the land to private port operators on the basis of long-term concession agreements. Before 1997 the port authority was a city department. The port authority was corporatized in January 1997; the former municipal port authority was transformed to an autonomous municipal port authority with only one shareholder, i.e. the municipality. The competencies were transferred from the city to the port and the new port authority gained financial independence”. The governance reform liberalized the port of Antwerp to actlike a private company and gained a first-mover effect in market competition. Totaling 66.5 million m2 of the whole city, the port of
Antwerp accounts for 72% of the total surface area, leaving 18.9 million m2 for other
business activities. The sufficient land resource provides a support for spatial expansion of the port. These two factors sustained nearly 10 years’ fast growth for the port, however, although port growth would contribute to the local economy, it didn’t drive the city of Antwerp enough, as we can see that port land use and port governance liberalization didn’t induce an economy boom, and instead, the city stepped into a long slow growth phase.
attraction and FDI as two factors that can boom local economy. In2006, 50 international projects were constructed in Antwerp, accounting for 27% of the total national projects, compared with 33 projects in Brussels regions. According to the Financial Times’ report, Flanders was the most attractive European region for foreign investment in 2007, next to London. The increasing jobattraction and FDI also boost port development. After the fast growth period of the port, the land and port governance was no longer the priority for the port, while the labor shortage and lack of relative expertise and possible international cooperation, e.g. shipping lines becomes imperative. The municipal policy was initiated firstly to promote local economy but also local port also benefited from its positive impacts. The direct local policy shifted towards a softer approach that sustained port development, e.g.labor introduction and FDI growth. These factors prompted the city to recover from the slow development and contributed to the increasing automation of the port operation management and decreasing dependence on labor-intense business.
From 2007 to 2010, both the city and the port were in a volatile situation. The city was facing a slow growth in terms of GDP generation, while after 22 years of a fast and moderate growth, the port was facing a fluctuating growth problem. The increasing rate of the port was as slow as that in the period S despite of expanding throughput capacity. In this period, port city developments share similar pattern. But we don’t find more policies directly targeted at the port despite of the high similarity in their growth. From the perspective of the municipality, it seeks more economic engines by building a “city brand”. More concrete methods are adopted in building an attractive economic climate for Antwerp. The construction of a more attractive and fashionable image is a secondary objective (Van Hamme, Strale, 2012)50.The city
improved image of the city becomes more attractive for the relative factors that can indirectly contribute to for the port development rather than the direct policy stimulation. The reason behind this is that at this phase, relationship between the port and the city has seen a separating tendency spatially, economically and institutionally. Although the city still plays an important role in terms of immediate hinterland for the port, distance hinterland becomes a more critical role in the port growth.
From 2010 to 2019, the city is predicted to recover from a slow growth, while the port will suffer from a slow growth due to the volatile world economy. The port deals with the cargo from all over the world. The recovery of the port depends more on the world economy recovery than the urban economy. Therefore, we see a more rapid recovery process of the city. In this period, the city focuses more on its knowledge industry cluster. In 2010, the University of Antwerp enrolled more than 8500 students and four knowledge centers were established, and most students choose management and maritime as their majors. Centers are an incubation center for small firms and a scientific center. The maritime course teaching is widely taughtin the most high education institutions, e.g. the Antwerp Maritime Academy, Institute of Transport and Maritime Management Antwerp and Antwerp/Flanders Port Training Centre. These maritime-related training programs sustain the port development. The developmental phase for the port and the city is the recovery phase in 2019.
7 Conclusion
Port city-region dynamics follows a “self-reinforcing pattern” and is autocatalytic and self-evident (Cahoon, et al, 2013)51. As researched by Fujita (1996)52,
self-organizing manner. A developmental model on evolving port city relations is helpful in identifying key phases and factors contributing to the pattern. As development is associated with specific geographical territory, it is necessary to address methodology in quantifying developments cross cases.
Our research follows the concept of life cycle by using FMSR phases to depict and compare port and city developments in cases. Relationship in ports city illustrated by Logistic function in these examples reveals that city growth is generally ahead of the port in development. However, this conclusion may be only partially effective due to the following reasons: (a) that the cases of Antwerp and Hamburg are spatially and functionally similar. Both ports focus on importing containers, while the cargoes exported from the two areas are relatively overlooked. If we integrated more types of ports, such as the ports in Asia depending more on exports, the relationship found between port-cities could change. (b) This section applied container throughput and urban GDP as output to describing growth. If we changed this indicator, for example, by using the profit of the port and urban taxation, we may see a closer relationship in the port-city. This relationship depends on the correlation and interplay between the indicators. (c) If we extend our data to a longer period.It would show a more complete life cycle for the port-city and the conclusions will be more convincing.
and city doesn’t overlap and the duration in the individual phase varies. The effectiveness of a continual policy will vary as well. Policy decomposition is to look at what factors in the urban policy will benefit the port growth rather than the overall policy. Therefore, the factors embedded in the policy can be identified, while the continual impact of the policy is yet to be quantified by other modeling methods.
Acknowledgement
We are grateful for support from Collaborative Innovation Center for Transport
Studies of Dalian Maritime University (20110116304); Dalian Social Science
Program (84150103); DMU online course research (0039101507) and Fundamental
Research Funds for the Central Universities (2016).
References
[1] Wang C.J., and Ducruet C., 2012. New port development and global city making: emergence of theShanghai–Yangshan multilayered gateway hub. Journal of Transport Geography, 25, 58-69. [2] Hesse, Markus, 2010. Cities, material flows and the geography of spatial interaction:urban places in the system of chains. Global Networks. 10 (1), 75–91.
[3] Jacobs, Wouter, Ducruet, César, De Langen, Peter Wubbe, 2010. Integrating worldcities into production networks: the case of port cities. Global Networks 10 (1),92–113.
[4] Jacobs, Wouter, Koster, Hans R.A., Hall, Peter V., 2011. The location and globalnetwork structure of maritime advanced producer services. Urban Studies. 48(13), 2749–2769. [5] Iannone F., 2012. The private and social cost efficiency of port hinterland
containerdistribution through a regional logistics system. Transportation Research Part A.46. 1424-1448.
[6] Ducruet C., and Notteboom T.2012.The worldwide maritime network of containershipping: spatial structure and regional dynamics. Global Networks 12(3), 395–423.
[7] Fremont,A., and Ducruet, C., 2005. The emergence of a mega-port-from the global to the local, the case of Busan. Tijdschrift voor Economische en Sociale Geografie. 96 (4), 421-432 [8] Fujita, M., 2007. The development of regional integration in East Asia: from the viewpoint of spatial economics. 19 (1), 2-20
[9] Verhoeven, Pa., and Vanoutrive, T., 2012. A quantitative analysis of European port governance. Maritime Economics & Logistics. 14 (2), 178-203
[10] Debrie J., and Raimbault N., 2016.The port –city relationships in two European inland ports: A geographical perspective on urban governance. Cities .50, 180-187.
[11] Graham. S., & Marvin. S. 2001. Splintering urbanism: networked infrastructures, technological mobilities and the urban condition. Oxford: Blackwell.
[13] Cullinane, K., and Wang, T.-F., 2007. Port governance in China (chapter 15). Devolution, Port Governance and Port Performance, Research in Transportation Economics. 17, 331-356.
[14] Wilmsmeier G., and Monios J., 2016. Institutional structure and agency in the governance of spatialdiversification of port system evolution in Latin America. Journal of Transport Geography. 51,294-307
[15] Wang J.J., Ng A. K.-Y., and Olivier D., 2004.Port governance in China: a review of policies in an era of internationalizing port management practices. Transport Policy. 1, 237-250.
[16] Verhetsel A., and Sel. S. 2009. World maritime cities: From which cities do container shipping companiesmake decisions? Transport Policy, 16, 240-250.
[17] Laxe. F.G., Seoane. F.G.F., and Montes. C.P., 2012. Maritime degree, centrality and vulnerability: port hierarchies and emergingareas in containerized transport (2008–2010). Journal of Transport Geography. 24, 33-44.
[18] Xu.M.Q., Li Z.F., Shi Y.L., Zhang X.L., and Jiang S.F., 2015. Evolution of regional inequality in the global shipping network. Journal of Transport Geography. 44, 1-12.
[19] Wang C.J., and Ducruet. C., 2014. Transport corridors and regional balance in China: the case of coal trade and logistics. Journal of Transport Geography. 40, 3-16.
[20] Cullinane, K., Bergqvist, R. and Wilmsmeier, G. 2012. The dry port concept- theory and practice. Maritime Economics & Logistics, 14 (1), 1-13.
[21] Gripaios, P. and Gripaios, R. 1995. The impact of a port on its local economy: the case of Plymouth. Maritime Policy & Management 39 (2). 189-206
[22] Haezendonck E., Dooms M., and Verbeke A., 2014. Anew governance perspective on port-hinterland relationships: the port port-hinterland impact (PHI) matrix. Maritime Economics & Logistics.16 (3), 229-249.
[23] Notteboom, T., 2008. The relationship between seaports and the inter-modal hinterland in light of global supply chains. Discussion paper in OECD/IFT (International Transport Forum). [24] Ng A. K.Y., Ducruet C., Jacobs W., Monios J., Notteboom T., Rodrigue J.-P., Slack B., Tam K.-C., Wilmsmeier G., 2014. Port geography at the crossroads with human geography: between flows and spaces. Journal of Transport Geography. 4, 84–96
[25] Baird, A., 1995. Privatization of Trust Ports in the United Kingdom: Review and Analysis of the First Sales. Transport Policy. 2, 135-143.
[26] Tarada H., 2002. Port Construction Subsidies in Japan and the Way They Discourage Private Sector Investment in Port Development. IAME Panama 2002 Conference Proceedings.
[27] Pemberton S., 2009. Institutional Governance, Scale and Transport Policy-lessons From Tyne and Wear. Journal of Transport Geography. 8,295-308.
[28] Notteboom T., De Langen P., and Jacobs W., 2013. Institutional Plasticity and Path Dependence in Seaports: interactions between institutions, port governance reforms and port authority routines, Jouranl of Transport Geography. 27, 26-35
[29] Monios J. and Lambert B., 2012. The Heartland Intermodal Corridor: Public Private
Partnerships and the Transformation of Institutional Settings. Journal of Transport Geography. 27, 36-45.
[31] Gonalez M. M., and Trujillo L., 2008. Reforms and Infrastructure Efficiency in Spain’s Container Ports. Transportation Research Part A. 42, 243-257.
[32] Wang J.J., Ng A. K.-Y., and Olivier D., 2004.Port governance in China: a review of policies in an era of internationalizing port management practices. Transport Policy. 1, 237-250.
[33] Wiegmans B.W., and Louw E., 2011. Changing port–city relations at Amsterdam: A new phase at the interface? Journal of Transport Geography. 19,575–583.
[34] Van Hooijdonk, E., 2007. Soft Values of Seaports. A Strategy for the Restoration of Public Support for Seaports. Antwerpen: Garant Publishers.
[35] Aarts M., Daamen T., Huijs M., and de Vries W. Port-city development in Rotterdam: a true love story, http://urban-e.aq.upm.es/
[36] Liao L., andHong C., 2013. The interaction between the port and Kaohsiung city: Economy, institution and power, City. Culture and Society. 4, 21–35.
[37] Flämig H., and Hesse M., 2011.Placing dryports. Port regionalization as a planning challenge. The case of Hamburg, Germany, and the Süderelbe. Research in Transportation Economics 33, 42-50.
[38] Daamen T.A., and Vries I., 2013. Governing the European port–city interface: Institutional impacts on spatial projects between city and port. Journal of Transport Geography. 27, 4–13. [39] Hall P. V. and Jacobs W., 2012. Why are maritime ports (still) urban, and why should policy-makers care? Maritime Policy & Management. 39(2), 189-206.
[40] Den Berg R.V., and De Langen P.W., 2011. Hinterland strategies of port authorities: A case study of the port of Barcelona. Research in Transportation Economics. 33,6-14.
[41] Tan T.Y., 2007. Port cities and hinterlands: A comparative study of Singapore and Calcutta. Political Geography. 26, 851-865.
[42] Dong J.Y., 2007. Study On Fitting Logistic Curve With SPSS Software. Journal of Jingling Institute of Technology. 23(1), 22-24.
[43] Northam R. M., 1979. Urban Geography [M] .New York: John Wiley& Sons. 5- 66.
[44] Chen Y. G. and Zhou Y.X., 2005. Logistic Process of Urbanization Falls into Four Successive Phases: Revising Northam. S Curve, With New Spatial Interpretation. Economic Geography. 25(6), 818-821.
[45] De Decker P., 1999. On the genesis of an urban policy in Flanders, Belgium. Journal of Housing and the Built Environment. 14,183-190.
[46] Loopmans M., 2007. From SIF to city fund: A new direction for urban policy in Flanders, Belgium. Journal of Housand the Built Environment. 22,215-225.
[47] Van Hamme G. and Strale M., 2012. Port Gateways in Globalization: The Case of Antwerp. Regional Science Policy & Practice. 4 (1), 84-96.
[48] Van Hamme G., Strale M., 2012. Port Gateways in Globalization: The Case of Antwerp, Regional Science Policy & Practice.4, 84–96.
[49] The City of Antwerp. Agency for Employment and Economic Development, 2008.
[50] Van Hamme G., Strale M., 2012. Port Gateways in Globalization: The Case of Antwerp, Regional Science Policy & Practice.4, 84–96.
innovation networks? Journal of Transport Geography. 27, 66-75.