Munich Personal RePEc Archive
Does Financial Development Lead to
Poverty Reduction in China? Time
Series Evidence
Ho, Sin-Yu and Njindan Iyke, Bernard
University of South Africa, Deakin University
2017
1
Empirical Reassessment of Bank-based Financial Development and Economic Growth in Hong Kong
Abstract
This paper reassesses the nexus between bank-based financial development and economic growth in Hong Kong during the period 1990 – 2014. That is, it tests whether Hong Kong follows a supply-leading or a demand-following hypothesis. Empirically, economists have generally disagreed on the nexus between bank-based financial development and economic growth. Hong Kong is a typical economy which has experienced both bank-based financial expansion and economic expansion in the last three decades. It therefore serves as a quintessence for testing this overarching debate. Using the Toda-Yamamoto test for causality and two indicators of bank-based financial development – in order to report robust results – the paper finds Hong Kong to follow the supply-leading hypothesis. This implies that the banking sector is vital in driving economic growth in Hong Kong during the study period. Policymakers in this economy will only enhance economic growth further by targeting and ensuring efficient performance of bank-based financial institutions.
JEL Codes: C32; E44; G21
Keywords: Bank-based Financial Development; Economic Growth; Causality; Hong Kong
1. Introduction
Do banking systems drive economic growth? Or does economic growth drive banking systems? These questions have been prominent at least since the nineteenth century. Among the earliest economists to assess the relationships between financial systems and economies is Schumpeter (1912). In his paper, he emphasises the importance of the banking sector in aiding technological innovation and productive investment, which eventually drives economic growth. In contrast to Schumpeter (1912), Robinson (1952) asserts that financial development has no influence on economic growth. She argues, instead, that economic growth influences the development of financial markets. Robinson (1952) argues that as economies grow the need for financial services arises, thereby stimulating the growth of financial systems.
bank-2
based financial development acts as a precursor to economic growth. Several empirical studies are consistent with this view. See among others, Bittencourt (2012), Chaiechi (2012), Lee (2012), and Colombage (2009). The second is the so-called growth-led finance hypothesis, whereby economic growth acts as a precursor to bank-based financial development. This view has been supported in studies such as Hassan et al. (2011), Colombage (2009), Chakraborty (2008), and Zang and Kim (2007). The third category finds bidirectional causality between bank-based financial development and economic growth. This has been corroborated in studies such as Bangake and Eggoh (2011), Hassan et al. (2011), Wolde-Rufael (2009), Abu-Bader and Abu-Qarn (2008), and Hondroyiannis et al. (2005). The fourth category finds no causality between bank-based financial development and economic growth. Studies such as Ibrahim (2007), Chang (2002), and Shan et al. (2001) find support for this view.
Most of these studies are either based on bivariate frameworks, cross-sectional approaches, or on frameworks that suffer from small sample properties. This paper attempts to re-assess the causal linkage between bank-based financial development and economic growth in Hong Kong, using a testing technique that overcomes the afore-mentioned shortcomings of the previous studies. We achieve this aim by extracting indicators of bank-based financial development and economic growth, and by building an augmented vector autoregression (VAR) model which caters for variable omission by introducing inflation. Then, by applying the Toda-Yamamoto test, we find Hong Kong to follow the supply-leading hypothesis. This implies that the banking sector is an important source of economic growth in Hong Kong during the study period. Based on this conclusion, we argue that policymakers in this economy will only enhance economic growth further by targeting and ensuring efficient performance of bank-based financial institutions.
The rest of the paper is organised as follows. In the next section, we discuss the trends in banking development and economic growth in Hong Kong. Section 3 gives the theoretical and empirical underpinning of the finance-growth nexus. Section 4 outlines the empirical methodology and the data. Section 5 analyses the empirical results. Section 6 provides the conclusion.
2. Banking sector development and economic growth in Hong Kong
3
tremendous economic expansion during the past three decades. Today, Hong Kong together with Singapore, South Korea, and Taiwan, are known as the four Asia tigers. Hong Kong is also part of the so-called new industrialised countries of the East.
The economy of Hong Kong boasts of an advanced banking sector, which has created a wide range of financial products and services. The concentration of banking institutions in Hong Kong is one of the highest in the world. More than 70 of the world’s largest 100 banks have operations in Hong Kong [Hong Kong Monetary Authority (HKMA), 2016]. Hong Kong now has a three-tier banking system, which is made up of deposit-taking companies, restricted licensed banks, and licensed banks. The chief regulator of the banking system in Hong Kong is the Hong Kong Monetary Authority (HKMA, 2016). Altogether, there are 199 authorised institutions (i.e. the official name of depository institutions under the three-tier system), and 64 local representative offices in Hong Kong. The authorised institutions consist of 157 licensed banks, 24 restricted licensed banks and 18 deposit-taking companies (see HKMA, 2015).
Various structural reforms, events, banking consolidation, and policy initiatives have helped transformed Hong Kong’s banking system in the past three decades. The first significant reform entails shifting from a monolithic system to a three-tier banking system in 1981. A further enhancement occurred in 1990 (see Jao, 2003). Under this system, the first, second and third tiers comprise, respectively, licensed banks, restricted licensed banks and deposit-taking companies. The nature of prudential supervision varies directly with the scope of the banking activity. The strictly regulated banks (i.e. the licensed banks) are allowed to accept all types of deposits. In the case of the second and third tiers, regulation is less-strict, and deposits are confined to time deposits (see Jao, 2003).
The Hong Kong Monetary Authority was created through the merger of the Exchange Fund and the Commissioner of Banking Offices in 1993 and charged with the responsibility of ensuring banking and currency stability. In fact, it was to become the central bank of Hong Kong (see Kwan, 2003). Until the 1990’s, the domestic banking sector was a closely regulated and largely protected sector. For example, the incorporated banks licensed in and after 1978 and the overseas-incorporated restricted licensed banks authorized in and after 1990 were restricted to operate in one branch, to prevent over-crowding in the retail banking market. As such, locally incorporated banks were relatively protected from foreign competition (Hua and Randhawa, 2006). In addition, the Hong Kong Association of Banks (HKAB), under HKAB ordinance, used a set of interest rate rules to regulate interest rates on bank deposits since 1964 (Kwan, 2003).
4
condition in 1999 (see Jiang et al., 2003). In 2001, the monetary authority successfully removed all limitations on the number of branches and offices for foreign banks. In addition to this, the market-entry criteria were relaxed in 2002, permitting foreigners to invest in the local banking system (Jiang et al., 2003). As part of these market-entry initiatives, the asset-size requirement for foreign banks was reduced. The requirements for the domestically incorporated restricted licensed banks and deposit-taking companies to upgrade to licensed-bank status were also relaxed (Jiang et al., 2003). The aim of these initiatives was that by gradually eliminating market-entry barriers, the market can determine the optimal number of institutions in the banking sector (see Hua and Randhawa, 2006).
The extensive financial liberalisation initiatives, a steady technological progress, costs cutting initiatives and a steady growth of revenue led to huge bank consolidation in Hong Kong. During the 2000s, a host of mergers and acquisitions took place in the banking system. As a consequence, the number of licensed banks dropped from 31 in 2000 to 23 in 2007 (see HKMA, 2001; 2007). In 2001, the ten member banks of the Bank of China Group consolidated into the Bank of China (Hong Kong); and in July 2002, the bank got listed on the Hong Kong stock exchange (Jiang et al., 2004). Foreign banks have undertaken deals with smaller banks in Hong Kong in order to gain access to the mainland China market (see Jiang et al., 2004). In addition, the number of authorised institutions has declined by 45% (i.e. from 361 to 199 during the period 1997 to 2015) [HKMA, 1997; 2015], following the restructuring of foreign parent banks and the consolidation of overseas banks during the Asian financial crisis.
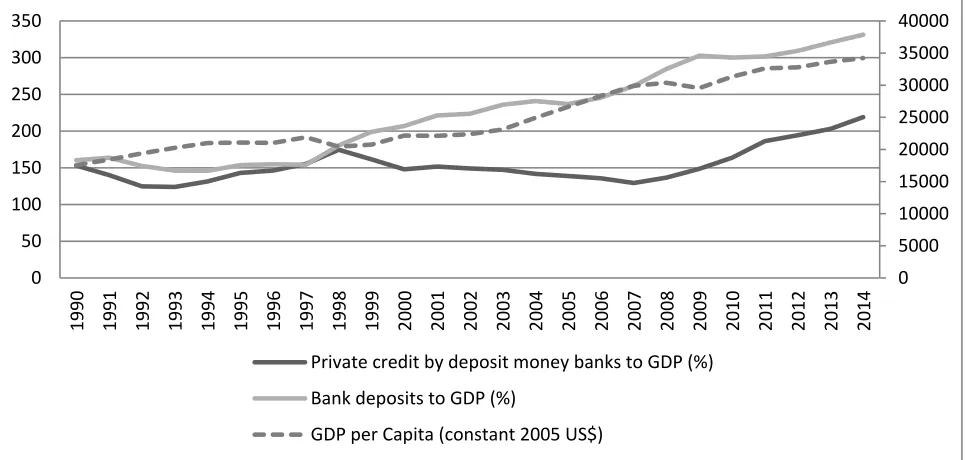
Generally, the banking system in Hong Kong has developed considerably during the past three decades. To make this point clear, let us take a look at two proxies of banking sector development, namely: Private Credit by Deposit Money Banks as a percentage of GDP (PC/GDP) and Bank Deposits as a percentage of GDP (BD/GDP). Figure 1 shows that PC/GDP first fell from 153% in 1990 to 124% in 1993, and then increased gradually to 175% in 1998. There was a downward adjustment in the PC/GDP, following the Asian financial crisis, the burst in the technology bubble, the terrorist attack in the United States, and the effect of epidemic virus; the PC/GDP dropped to 142% in 2004. After the slow recovery of the recent global financial crisis, there was a marked improvement in the banking sector development during the period of 2010 to 2014, with the highest PC/GDP value (i.e. 219%) being recorded in 2014 (Global Financial Development Database, 2016). In addition, if the banking sector development is proxy by Bank Deposits as a percentage of GDP (BD/GDP), the development of the banking system in Hong Kong looks even more impressive (see Figure 1). The BD/GDP shows a general upward trend from 160% to 331% during the period of 1990 to 2014 (Global Financial Development Database, 2016).
5
Figure 1: Bank-based financial development indicators and real GDP per capita during the
period 1990 – 2014
Source: Global Financial Development Database (2016).
3. Literature Review
The causal nexus between financial development and economic growth has remained a topical issue for several years. By and large, the theoretical and empirical literature has been divisive as to whether financial development precedes economic growth or economic growth is a precursor to financial development. According to Schumpeter (1912), financial development fosters technological innovations and economic growth through the mobilization of funds, risks management, evaluation and selection of projects, facilitation of transactions, and the monitoring of entrepreneurs. Goldsmith (1969) attributes the positive association between finance and growth to efficient capital stock usage. McKinnon and Shaw (1973) note that financial development enhances growth by enhancing the productivity of capital. To them, a well-developed financial system is necessary for the attainment of economic growth.
In contrast, other economists remain unconvinced by the role played by financial development in economic growth. Robinson (1952), for instance, notes that financial development cannot influence economic growth. To her, financial development is a by-product of economic growth. In her view, economic growth breeds the need for financial products and services. This in turn necessitates the development of financial institutions and intermediaries. Lucas (1988) agrees with this notion by asserting that the role played by the financial sector in economic growth has been overstated. He argues that the financial sector develops in response to economic growth.
Patrick (1966) attempts at reconciling these views by contending that at the early stage of economic development, financial development promotes economic growth, while at the latter stage of economic development, growth tends to promote further financial development. In other words,
0 5000 10000 15000 20000 25000 30000 35000 40000
0 50 100 150 200 250 300 350
1990 1991 1992 1993 1994 1995 1996 1997 1998 1999 2000 2001 2002 2003 2004 2005 2006 2007 2008 2009 2010 2011 2012 2013 2014
Private credit by deposit money banks to GDP (%)
Bank deposits to GDP (%)
6
he argues that there exists bidirectional causality between financial development and economic growth. In contrast, Graff (1999) argues that financial development and economic growth are not causally related. To him, what appears to be a link between the two variables is nothing but a result of a historical anomaly.
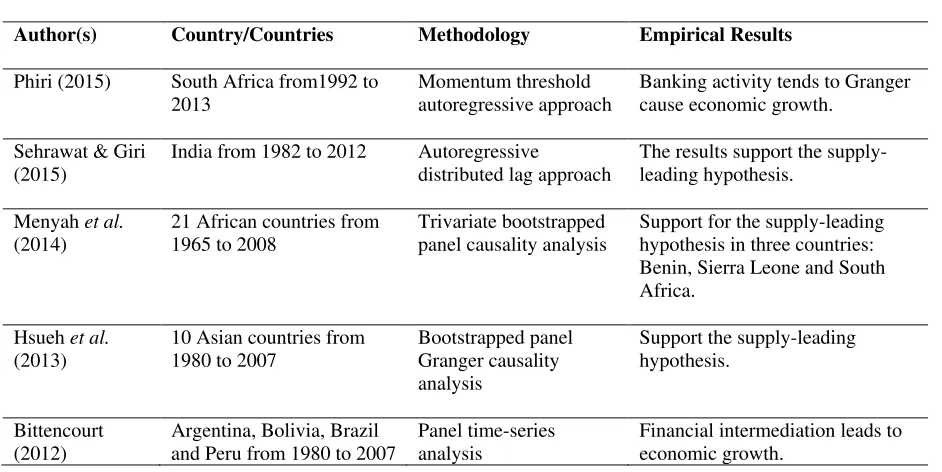
[image:7.612.76.547.485.721.2]On the empirical front, the findings in the literature can at best be classified into four broad categories. The first is the so-called finance-led growth hypothesis, whereby bank-based financial development causes economic growth. Several empirical studies are consistent with this view. See among others, Phiri (2015), Sehrawat and Giri (2015), Menyah et al. (2014), Hsueh et al. (2013), Bittencourt (2012), Chaiechi (2012),Lee (2012), Colombage (2009), Habibullah and Eng (2006), Chang and Caudill (2005), Calderón and Liu (2003), Agbetsiafa (2003), Rousseau and Wachtel (2000), Choe and Moosa (1999), Darrat (1999), Ahmed and Ansari (1998), and Jung (1986). The second is the so-called growth-led hypothesis, whereby economic growth causes bank-based financial development. This view has been supported in studies such as Menyah et al. (2014), Hassan et al. (2011), Colombage (2009), Chakraborty (2008), Zang and Kim (2007), Ang and McKibbin (2006), Liang and Teng (2006), Thangavelu et al. (2004), Waqabaca (2004), Agbetsiafa (2003), Shan et al. (2001), Demetriades and Hussein (1996), and Jung (1986), among others. The third argues for bidirectional causality between bank-based financial development and economic growth. This has been corroborated in studies such as Pradhan et al. (2014), Bangake and Eggoh (2011), Hassan et al. (2011), Wolde-Rufael (2009), Abu-Bader and Abu-Qarn (2008), Hondroyiannis et al. (2005), Calderón and Liu (2003), Shan et al. (2001), and Demetriades and Hussein (1996). The fourth argues for no causality between bank-based financial development and economic growth. This view has been supported by studies such as Menyah et al. (2014), Ibrahim (2007), Chang (2002), and Shan et al. (2001). In Table 1, we provide a detailed breakdown of the empirical studies. It is clear from Table 1 that the literature is inconclusive. The inconclusive nature of the literature necessitates our paper.
Table 1: The Empirical Studies on the Finance-Growth Linkages
Finance-led growth
Author(s) Country/Countries Methodology Empirical Results
Phiri (2015) South Africa from1992 to 2013
Momentum threshold autoregressive approach
Banking activity tends to Granger cause economic growth.
Sehrawat & Giri (2015)
India from 1982 to 2012 Autoregressive
distributed lag approach
The results support the supply-leading hypothesis.
Menyah et al.
(2014)
21 African countries from 1965 to 2008
Trivariate bootstrapped panel causality analysis
Support for the supply-leading hypothesis in three countries: Benin, Sierra Leone and South Africa.
Hsueh et al.
(2013)
10 Asian countries from 1980 to 2007
Bootstrapped panel Granger causality analysis
Support the supply-leading hypothesis.
Bittencourt (2012)
Argentina, Bolivia, Brazil and Peru from 1980 to 2007
Panel time-series analysis
7 Chaiechi (2012) South Korea, Hong Kong,
UK from 1990 to 2006
Structural VAR Support for the ‘supply leading’ hypothesis.
Lee (2012) The US, the UK, Germany, France, Japan and Korea
Time-series analyses Granger causality analysis
Four countries show that financial systems promote economic growth, except for the case of Korea.
Colombage (2009)
Canada, Japan,
Switzerland, the UK and the US from 1995 to 2006
Vector error-correction model
Financial market development causes economic growth, except for the case of Canada.
Habibullah & Eng (2006)
13 Asian developing countries from 1990 to 1998
Dynamic panel Generalized Method of-Moment
Financial market development fosters economic growth.
Chang & Caudill (2005)
Taiwan from 1962 to 1998 Vector autoregressive model
Financial development to economic growth.
Calderón & Liu (2003)
109 developing and industrial countries from 1960 to 1994
Geweke decomposition test on pooled data
Financial market development promotes economic growth.
Agbetsiafa (2003)
Eight Sub-Saharan African countries
Granger causality analysis
Financial development causes growth in Ghana, Nigeria, Senegal, South Africa, Togo and Zambia.
Rousseau & Wachtel (2000)
The UK, the US, Canada, Norway and Sweden from 1870 to 1929
Granger causality tests There is a leading role for the intermediation variables in real sector activity.
Choe & Moosa (1999)
Korea from 1970 to 1992 Causality and non-nested model selection tests
Financial development leads economic growth.
Darrat (1999) Saudi Arabia, Turkey and the United Arab Emirates from 1964 to 1993
Multivariate Granger-causality tests
Financial deepening is a necessary causal factor of economic growth.
Ahmed & Ansari (1998)
India, Pakistan and Sri Lanka from 1973 to 1991
Granger causality tests Financial sector development causes economic growth.
Jung (1986) 56 countries both
developed and developing
Vector autoregressive model
Financial development causes economic development in the developing countries.
Growth-led finance
Author(s) Country/
Countries of study
Methodology Empirical Results
Menyah et al. (2014)
21 African countries from 1965 to 2008
Trivariate bootstrapped panel causality analysis
8 Hassan et al.
(2011)
168 countries from 1980 to 2007
Panel estimations and multivariate time-series models
Support growth-led finance in Sub-Saharan Africa, and East Asia & Pacific in the short run.
Colombage (2009) Canada, Japan,
Switzerland, the UK and USA from 1995 to 2006
Vector error-correction models
Economic growth leads to the capital market development in Canada
Chakraborty (2008)
India from 1996:3 to 2005:1
Time series analysis Economic growth causes financial development in India.
Zang & Kim (2007)
Same panel data set used by Levine et al. 2000
Sims-Geweke causality tests
Economic growth precedes financial development.
Ang & McKibbin (2006)
Malaysia from 1960 to 2001
Cointegration and causality tests
Economic growth process promotes financial deepening.
Liang & Teng (2006)
China from 1952 to 2001 Multivariate vector autoregressive model
Support growth-led finance.
Thangavelu et al.
(2004)
Australia from 1960 to 1999
Vector autoregressive model and Granger causality test
Economic growth causes financial intermediation development.
Waqabaca (2004) Fiji from 1970 to 2000 Vector autoregressive model
Support growth-led finance.
Agbetsiafa (2003) Eight Sub-Saharan African countries
Error-correction model Unidirectional causality from growth to finance in Ivory Coast and Kenya.
Shan et al. (2001) Nine OECD countries and China
Granger causality procedure
One way causality from economic growth to financial development is found in Canada, China and Italy.
Demetriades & Hussein (1996)
Sixteen countries Time series techniques Economic growth leads financial development in some countries.
Jung (1986) 56 countries both developed and developing
Vector autoregressive approach
Causal direction running from economic to financial development in the developed countries.
Bi-directional
Author(s) Country/
Countries of study
Methodology Empirical Results
Pradhan et al.
(2014)
35 Asian countries from 1960 to 2011
Panel data estimation methods
Support feedback hypothesis.
Bangake & Eggoh (2011)
71 industrial and developing countries from 1960 to 2004
Panel vector error-correction models
9 Hassan et al. (2011) 168 countries from 1980
to 2007
Panel estimations and multivariate time-series models
Support feedback hypothesis for most regions in the short run except for Sub-Saharan and East Asia & Pacific.
Wolde-Rufael (2009)
Kenya from 1966 to 2005 Granger causality test Support feedback hypothesis.
Bader & Abu-Qarn (2008)
Egypt from 1960 to 2001 Trivariate vector autoregressive framework
Support feedback hypothesis.
Hondroyiannis et al.
(2005)
Greece from 1986 to1999 Vector autoregressive framework
Support feedback hypothesis in the long run.
Calderón & Liu 2003
109 developing and industrial countries from 1960 to 1994
Geweke decomposition test on pooled data
Support feedback hypothesis is found when the sample is split into developing and industrial counties.
Shan et al. (2001) Nine OECD countries and China
Granger causality procedure
Australia, Denmark, Japan, the US, and the UK show Support feedback hypothesis.
Demetriades & Hussein (1996)
Sixteen countries Time series techniques Most of the evidence Support feedback hypothesis.
No relationship
Author(s) Country/
Countries of study
Methodology Empirical Results
Menyah et al. (2014)
21 African countries from 1965 to 2008
Trivariate bootstrapped panel causality analysis
No causality in any direction between financial development and economic growth in 15 countries.
Ibrahim (2007) Malaysia from 1985 to 2003
Time series analysis An insignificant relation between finance and growth.
Chang (2002) Mainland China from 1987:1 to 1999:4
Multivariate vector autoregressive models
No causality in any direction between finance and growth.
Shan et al. (2001) Nine OECD countries and China
Granger causality procedure
No causality is found in France and New Zealand.
Source: Compiled by authors from the Empirical Literature.
4.Methodology and Data
10
4.1 Testing for Stationarity
Our first step in the empirical analysis is to assess the stationary properties of the variables. For this purpose, we utilize the ADF and DF-GLS tests to examine the stationary properties of the variables. We employ the DF-GLS test as a robust alternative the ADF test, which is known to over-reject the hypothesis of no stationarity (see Schwert, 1986; Caner and Killian, 2001). According to Elliot et al. (1996), the DF-GLS test has substantially higher power even in situations where the root of the series is nearly one. The choice of lags is crucial in stationarity testing. In this paper, we use the Modified Akaike Information Criterion (MAIC) to choose the optimal lags to be included in the auxiliary regressions. The auxiliary regressions as well as the test statistics under the ADF and DF-GLS tests are well documented in the literature. We do not focus on them in this paper.
4.2 Granger Causality Testing using the Toda-Yamamoto Test
The traditional approach for causality testing as proposed by Granger (1969) entails that we establish the integration properties of the variables under consideration. If the variables are integrated, we must examine the possibilities of cointegrating relationships, before we can carry out the test for causality. This becomes problematic because majority of the diagnostic tests for non-stationarity and cointegration are known to have low power against the alternative hypotheses of stationarity and cointegration (see Ho and Iyke, 2016, for similar explanation). In fact, Toda and Yamamoto (1995) have emphasized that the conventional approach to testing for causality – which requires one to test for stationarity and cointegration – is vulnerable to pretesting bias. In support of this view, He and Maekawa (1999), explain that if causality is tested in situations whereby one or both time series are non-stationary, the results would be spurious.
According to Toda and Yamamoto (1995), the problems associated with the conventional test for causality may be obviated by fitting an augmented VAR model, whereby the highest order of integration of the variables is added to the optimal lag of the VAR model. The associated test statistic for the causality test, following this VAR model would have a standard asymptotic distribution (Toda and Yamamoto, 1995). Following Yamada (1998), and Ho and Iyke (2016), a modified vector autoregressive model, 𝑉𝐴𝑅(𝑚 + 𝑑𝑚𝑎𝑥), for testing Granger causality using the Toda-Yamamoto technique will be of the form
𝑦𝑡 = 𝛾0+ ∑ 𝛾1𝑖𝑦𝑡−𝑖 𝑚
𝑖=1
+ ∑ 𝛾2𝑖y𝑡−𝑖 𝑚+𝑑𝑚𝑎𝑥
𝑖=𝑚+1
+ ∑ 𝜑1𝑖𝑥𝑡−𝑖 𝑚
𝑖=1
+ ∑ 𝜑2𝑖𝑥𝑡−𝑖 𝑚+𝑑𝑚𝑎𝑥
𝑖=𝑚+1
+ 𝑢1𝑡 (1)
𝑥𝑡 = Θ0+ ∑ Θ1𝑖𝑥𝑡−𝑖 𝑚
𝑖=1
+ ∑ Θ2𝑖𝑥𝑡−𝑖 𝑚+𝑑𝑚𝑎𝑥
𝑖=𝑚+1
+ ∑ δ1𝑖𝑦𝑡−𝑖 𝑚
𝑖=1
+ ∑ δ2𝑖𝑦𝑡−𝑖 𝑚+𝑑𝑚𝑎𝑥
𝑖=𝑚+1
+ 𝑢2𝑡 (2)
11
From Eq. (1), 𝑥𝑡 causes 𝑦𝑡 if 𝜑1𝑖 ≠ 0, ∀ 𝑖 = 1, 2, … , 𝑚. In a similar vein, in Eq. (2), 𝑦𝑡 causes 𝑥𝑡 if δ1𝑖 ≠ 0, ∀ 𝑖 = 1, 2, … , 𝑚. The associated test statistic of these hypotheses is chi-squared distributed. Suppose that δ1𝑖 = 0, ∀ 𝑖 = 1, 2, … , 𝑚, and let 𝛿 = 𝑣𝑒𝑐(δ1, δ2, … , δ𝑚) denote a vector of 𝑚 𝑉𝐴𝑅 coefficients. According to Toda and Yamamoto (1995), for a suitably selected 𝑍, the modified Wald-statistic for this hypothesis takes the form
𝑊 = 𝑇(𝛿̂′𝑍′(𝑍Σ̂
𝑢′𝑍′)−1𝑍𝛿̂) (3)
where 𝛿̂ is the OLS estimate of 𝛿; Σ̂𝑢 denotes a consistent estimate of the variance-covariance matrix of √𝑇(𝛿̂ − 𝛿); 𝑇 denotes the sample size. 𝑊, which is the test statistic, is chi-squared distributed with 𝑚 degrees of freedom.
4.3 Data
The period covered in this paper is from 1990 to 2014. The data are obtained from the World Bank’s Global Financial Development Database (2016) and World Development Indicators (2016). These databases are preferred because they are very reliable and have been used by previous studies. The variables employed in this paper are: (i) economic growth, measured by the annual percentage change in real GDP per capita (constant 2005 US$); (ii) bank-based financial development, measured by two proxies, namely: private credit by deposit money banks as a percentage of GDP (PC/GDP), and bank deposits as a percentage of GDP (BD/GDP), and (iii) inflation, measured by annual percentage change in consumer prices.
5. Empirical Results
5.1 Results of Stationarity Tests
[image:12.612.71.544.613.704.2]Before assessing the causal nexus between bank-based financial development and economic growth in Hong Kong, we first establish the stationarity properties of the variables. This step is necessary in order to establish the additional lag(s) (i.e. 𝑑𝑚𝑎𝑥) to be included in the augmented VAR model – which will be used to test for causality following Toda and Yamamoto (1995). In this paper, we utilise the ADF and DF-GLS tests and then we undertake the stationarity analysis by taking into account the no trend and trend options. Table 2 shows the results of the stationarity tests of the variables in their levels and first differences. The variables are stationary after first difference at the conventional levels of significance (see Table 2). Hence the additional lag(s) to be included in the augmented VAR model is 1 (i.e. 𝑑𝑚𝑎𝑥 = 1).
Table 2: Stationarity Tests of Variables in Levels and First Differences
Variable No Trend Trend
Levels – ADF Test
lnGDP -0.383 -1.594
INF -1.666 -1.158
lnPC/GDP -1.029 -2.038
lnBD/GDP 0.313 -3.683**
12
lnGDP 0.418 -1.668
INF -1.346 -1.253
lnPC/GDP -1.416 -2.346
lnBD/GDP -0.108 -2.165
First Difference – ADF Test
∆lnGDP -4.096*** -4.006**
∆INF -4.367*** -4.769***
∆lnPC/GDP -2.812* -2.903*
∆lnBD/GDP -4.689*** -4.661***
First Difference – DF-GLS Test
∆lnGDP -4.116*** -4.153***
∆INF -4.325*** -4.810***
∆lnPC/GDP -2.534** -2.965*
∆lnBD/GDP -3.281*** -3.378***
Notes:
1) *, ** and *** denote, respectively, 10%, 5% and 1% significance levels.
2) The critical values for the Dickey-Fuller GLS test are based on Table 1 of Elliot et al. (1996). 3) ∆ denotes first difference operator.
4) lnGDP = natural log of real GDP per capita, lnPC/GDP = natural log of private credit by deposit money banks as a percentage of GDP, lnBD/GDP = natural log of bank deposits as a percentage of GDP, and INF = inflation.
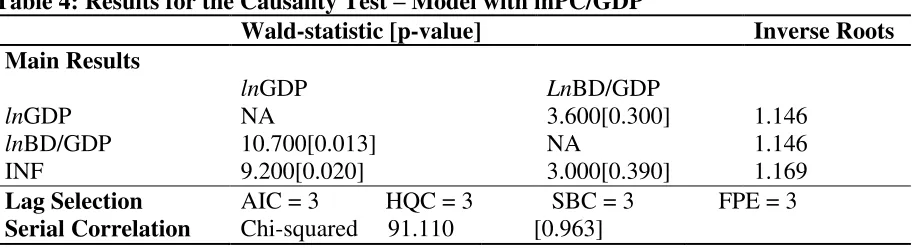
5.2 Lag Selection, Model Diagnostics, and the Results for Causality Testing
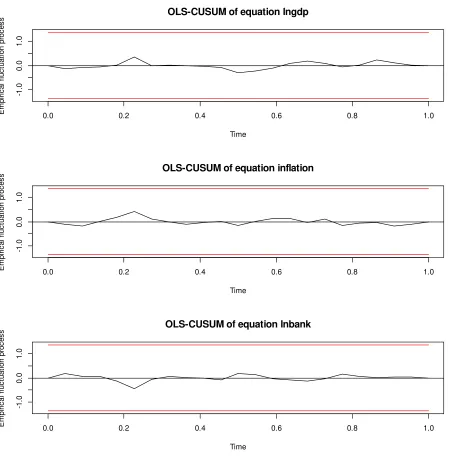
[image:13.612.72.542.68.255.2]It is important to select the appropriate lag length when performing the Toda-Yamamoto test. Here, our selection of the optimal lag length is based on the Akaike Information Criterion (AIC), the Hannan-Quinn Criterion (HQC), the Schwartz Information Criterion (SIC), and the Final Prediction Error (FPE). The optimal lag selected in our analysis is 3 (see Tables 3 and 4). Hence, we specify the two VAR models based on 3 lags. Apart from selecting the optimal lags, the best models should be free of serial correlation and be structurally stable (see Ho and Iyke, 2016). We therefore test for structural stability and serial correlation. These results are presented in Tables 3 and 4. The inverses of the roots of the characteristic equations are above one in all the cases (see Tables 3 and 4), indicating that the models are structurally stable. This is supported by Figures A.1, and A.2, which show the cumulative sum of recursive residual plots. The models are also free of serial correlation. This evidence is shown, respectively, by the chi-squared statistic of 89.739 with a p-value of 0.971 for the lnGDP, INF and lnPC/GDP model; and 91.110 and 0.963 for the lnGDP, INF and lnBD/GDP model.
Table 3: Results for the Causality Test – Model with lnPC/GDP
Wald-statistic [p-value] Inverse Roots
Main Results
lnGDP LnPC/GDP
lnGDP lnPC/GDP
NA
10.000[0.019]
5.800[0.120] NA
1.064 1.064
13
Lag Selection AIC = 3 HQC = 3 SBC = 2 FPE = 3
Serial Correlation Chi-squared 89.739 [0.971]
[image:14.612.75.531.136.260.2]Note: NA denotes non-applicable.
Table 4: Results for the Causality Test – Model with lnPC/GDP
Wald-statistic [p-value] Inverse Roots
Main Results
lnGDP LnBD/GDP
lnGDP lnBD/GDP
NA
10.700[0.013]
3.600[0.300] NA
1.146 1.146
INF 9.200[0.020] 3.000[0.390] 1.169
Lag Selection AIC = 3 HQC = 3 SBC = 3 FPE = 3
Serial Correlation Chi-squared 91.110 [0.963]
Note: NA denotes non-applicable.
Having satisfied all the requirements underlying the Toda-Yamamoto test, we estimate a 𝑉𝐴𝑅(4) for each of the two models (i.e. 𝑚 = 3 and 𝑑𝑚𝑎𝑥 = 1). Table 3 shows the causality tests between lnGDP and lnPC/GDP. From Table 3, it is evident that there is a unidirectional causal flow running from lnPC/GDP to lnGDP at 5% level of significance, as indicated by the chi-squared statistic of 10.000, with corresponding p-value of 0.019, for the lnGDP equation. Similarly, there is a unidirectional causal flow running from lnBD/GDP to lnGDP at 5% level of significance, as indicated by the chi-squared statistic of 10.700, with corresponding p-value of 0.013, for the lnGDP equation (see Table 4). From these results, bank-based financial development is a precursor to economic growth in Hong Kong. In other words, Hong Kong tends to follow the supply-leading hypothesis. This finding is consistent with the existing findings such as those of Phiri (2015), Sehrawat and Giri (2015), Menyah et al. (2014), Hsueh et al. (2013), and Bittencourt (2012). The finding implies that policymakers in Hong Kong are able to drive economic growth using bank-based financial development as a tool. Hence, one way Hong Kong can continue to sustain its tremendous advancement is to ensure that its banking system is functioning efficiently. Robust stabilizers should be built to make the banking system insusceptible to systemic and external shocks.
6. Conclusion
14
15
References
Abu-Bader, S. and Abu-Qarn, A.S. (2008). “Financial Development and Economic Growth: the Egyptian Experience”, Journal of Policy Modeling, 30: 887–898.
Agbetsiafa, D.K. (2003). “The Finance Growth Nexus: Evidence from Sub-Saharan Africa”, International Advances in Economic Research, 9 (2).
Ahmed, S. and Ansari, M. (1998). “Financial Sector Development and Economic Growth: the South Asian Experience”, Journal of Asian Economics 9 (3): 503–517.
Ang, J.B. and Mckibbin, W.J. (2007). “Financial Liberalization, Financial Sector Development and Growth: Evidence from Malaysia”, Journal of Development Economics, 84: 215–233.
Bangake, C. and Eggoh, J.C. (2011). “Further Evidence on Finance-growth Causality: A Panel Data Analysis”, Economic Systems, 35: 176–188.
Bittencourt, M. (2012). “Financial Development and Economic Growth in Latin America: Is Schumpeter Right”, Journal of Policy Modelling, 34: 341-355.
Calderón, C. and Lin, L. (2003). “The Direction of Causality between Financial Development and Economic Growth”, Journal of Development Economics, 72: 321–334.
Caner, M. and Kilian, L. (2001). “Size Distortion of Tests of the Null Hypothesis of Stationarity: Evidence and Implication for the PPP Debate”, Journal of International Money and Finance, 20: 639-657.
Chaiechi, T. (2012). “Financial development shocks and contemporaneous feedback effect on key macroeconomic indicators: A post Keynesian time series analysis”, Economic Modelling, 29(2): 487–501.
Chakraborty, I. (2008). “Does Financial Development Cause Economic Growth? The Case of India”, South Asia Economic Journal, 9: 109-139.
Chang, T. (2002). “Financial Development and Economic Growth in Mainland China: a Note on Testing Demand-following or Supply-leading Hypothesis”, Applied Economics Letters, 9(13): 869-873.
Chang, T. and Caudill, S. B. (2005). “Financial Development and Economic Growth: the Case of Taiwan”, Applied Economics, 37(12): 1329-1335.
Choe, C. and Moosa, I.A. (1999). “Financial System and Economic Growth: the Korean Experience”, World Development 27(6):1069–1082.
16
Darrat, A.F. (1999). “Are Financial Deepening and Economic Growth Causally Related? Another Look at the Evidence”, International Economic Journal 13 (3): 19–35.
Demetriades, P.O. and Hussein, K.A. (1996). “Does Financial Development Causes Economic Growth? Time Series Evidence from 16 Countries” ,Journal of Development Economics, 51: 387–411.
Elliot G., Rothenberg T., Stock J. (1996). “Efficient Tests for an Autoregressive Unit Root”, Econometrica, 64: 813–836
Global Financial Development Database (2016). [Online] Available at <
http://www.worldbank.org/en/publication/gfdr/data/global-financial-development-database >, accessed on 28 June 2016.
Goldsmith, R. W. (1969). Financial structure and development. New Haven, CT: Yale Univ. Press.
Graff, M. (1999). “Financial Development and Economic Growth—a New Empirical Analysis”, Dresden discussion paper series in Economics, Nr. 5/99 (Technische Universitat Dresden).
Granger, C. W. J. (1969). “Investigating Causal Relations by Econometric Models and Cross-spectral Methods”, Econometrica 37 (3): 424–438.
Habibullah, M.S. and Eng, Y. (2006). “Does Financial Development Cause Economic Growth? A Panel Data Dynamic Analysis for the Asian Developing Countries”, Journal of the Asia Pacific Economy 11 (4): 377−393.
Hassan, M.K., Sanchez, B. and Yu, J.S. (2011), “Financial Development and Economic Growth: New Evidence from Panel Data”, The Quarterly Review of Economics and Finance 51 (2011): 88–104.
He, Z. and Maekawa, K. (1999). “On Spurious Granger Causality”, Economic Letters, 73(3): 307–313.
Ho, S.Y. and Iyke, B.N. (2016). “On the Causal Links between the Stock Market and the Economy of Hong Kong,” Working Papers 591, Economic Research Southern Africa.
Hondroyiannis, G., Lolos, S. and Papapetrou, E. (2005). “Financial Markets and Economic Growth in Greece, 1986–1999”, Journal of International Financial Markets, Institutions and Money,15:173–188.
Hong Kong Monetary Authority. (2016). [Online] Available at
17
Hong Kong Monetary Authority Annual report. (2015). [Online] Available at
<http://www.hkma.gov.hk/media/eng/publication-and-research/annual-report/2015/18_AnnexandTables.pdf>, accessed on 2 July 2016.
Hong Kong Monetary Authority Annual report. (2007). [Online] Available at
<http://www.hkma.gov.hk/media/eng/publication-and-research/annual-report/2007/annex_tables.pdf>, accessed on 2 July 2016.
Hong Kong Monetary Authority Annual report. (2001). [Online] Available at
<http://www.hkma.gov.hk/media/eng/publication-and-research/annual-report/2001/Annex_Table.pdf>, accessed on 2 July 2016.
Hong Kong Monetary Authority Annual report. (1997). [Online] Available at
http://www.hkma.gov.hk/eng/publications-and-research/annual-report/1997/table03.shtml>, accessed on 2 July 2016.
Hua, G.L. and Randhawa, D. S. (2006). ‘The banking sectors in Hong Kong and Singapore: What has liberalization wrought? An X-efficient study’ Saw Centre for Financial Studies Working Paper:06-03.
Hsueh, S., Hu, Y., & Tu, C. (2013). “Economic growth and financial development in Asian countries: A bootstrap panel granger causality analysis”, Economic Modelling, 32(3): 294–301.
Ibrahim M. H. (2007). “The Role of the Financial Sector in Economic Development: the Malaysian Case”, International Review of Economics (2007) 54: 463-483.
Jao, Y.C. (2003). ‘Financial reform in Hong Kong’, Chapter 6 in Maximilian J.B. Hall (ed.), The International Handbook on Financial Reform, Edward Elgar Publishing, Cheltenham.
Jiang, G., Tang, N., Law, E. and Sze, A. (2003). “Determinants of Bank Profitability in
Hong Kong”, HKMA Research Memorandums, Hong Kong.
Jiang, G., Wong, J., Tang, N. and Sze, A. (2004), “Banking Sector Competition in Hong Kong
Measurement and Evolution over Time” , HKMA Research Memorandums, Hong Kong.
Jung, W. (1986). “Financial Development and Economic Growth: International Evidence,” Economic Development and Cultural Change , 34: 333–346 (January).
Krause, L. B. (1988). “Hong Kong and Singapore: Twins or Kissing Cousins”, Economic Development and Cultural Change, 36(3), S45-S66.
Kwan, S.H. (2003). “Impact of Deposit Rate Deregulation in Hong Kong on the Market Value of Commercial Banks”, Journal of Banking and Finance, 27(12): 2231-2248.
18
Liang, Q. and Teng, J.Z. (2006). “Financial Development and Economic Growth: Evidence from China”, China Economic Review, 17: 395–411.
Lucas Jr., R. E. (1988). “On the Mechanics of Economic Development” , Journal of Monetary Economics, 22: 3–42.
McKinnon, R. I. (1973). Money and Capital in Economic Development, Washington, D.C., The Brookings Institution.
Menyah, K., Nazlioglu, S., & Wolde-Rufael, Y. (2014). “Financial development, trade openness and economic growth in African countries: New insights from a panel causality approach”, Economic Modelling, 37(2): 386–394.
Meyer, D.R. (2015). The world cities of Hong Kong and Singapore: Network hubs of global finance. International Journal of Comparative Sociology doi:10.1177/0020715215608230
Patrick, H.T. (1966). “Financial Development and Economic Growth in Underdeveloped Countries”, Economic Development and Cultural Change, 14(1):174–189.
Phiri, A., (2015). “Asymmetric cointegration and causality effects between financial
development and economic growth in South Africa”, Studies in Economics and Finance, 32(4 ): 464 – 484.
Pradhan, R. P., Arvin, M. B., Norman, N. R., & Hall, J. H. (2014). “The dynamics of banking sector and stock market maturity and the performance of Asian economies”, Journal of Economic and Administrative Sciences, 30(1):16–44.
Robinson, J., (1952). The Generalisation of the General Theory in: The Rate of Interest and other Essays. McMillian, London.
Rousseau, P.L. and Wachtel, P. (2000). “Equity Markets and Growth: Cross-country Evidence on Timing and Outcomes, 1980-1995”, Journal of Business and Finance 24 (Nov.): 1933-57.
Schumpeter, J.A., (1912), Theorie derWirtschaftlichen Entwicklung [The Theory of Economic Development]. Dunker & Humblot, Leipzig. (Translated by Redvers Opie, Cambridge, MA, Harvard University Press, 1934).
Schwert, W. (1986). “Test for Unit Roots: A Monte Carlo Investigation”, Journal of Business and Economic Statistics, 7: 147-159.
Sehrawat, M. & Giri, A K. (2015). “Financial development and economic growth: empirical evidence from India”, Studies in Economics and Finance, 32(3): 340 – 356.
19
Shaw, E. S. (1973). Financial Deepening in Economic Development. New York: Oxford University Press.
Taylor, P.J. (2005). Leading world cities: Empirical evaluations of urban nodes in multiple networks. Urban Studies 42(9): 1593–1608.
Thangavelu, S. M., Jiunn, A.B. and James (2004). “Financial Development and Economic Growth in Australia: an Empirical Analysis”, Empirical Economics, 29:247–260.
Toda, H. Y. and Yamamoto T. (1995). “Statistical Inference in Vector Autoregressions with Possibly Integrated Processes”, Journal of Econometrics, 66: 225–250.
Tsang, S., 2004. A Modern History of Hong Kong, I.B. Tauris & Co Ltd, London.
Waqabaca, C. (2004). “Financial Development and Economic Growth in Fiji”, Working Paper 2004/03 (December). Economics Department, Reserve Bank of Fiji.
World Development Indicators (2016). [Online] Available at
<http://data.worldbank.org/products/wdi >, accessed on 28 June 2016.
Wolde-Rufael, Y. (2009). “Re-examining the financial development and economic growth nexus in Kenya” , Economic Modelling, 26:1140–1146.
Yamada, H. (1998). “A Note on the Causality between Exports and Productivity: an Empirical Reexamination”, Economics Letters, 61: 111-4.
Young, A. (1992). “A Tale of Two Cities: Factor Accumulation and Technical Change in Hong Kong and Singapore”, NBER Macroeconomics Annual 1992, Vol. 7:13-64.
20
[image:21.612.76.524.134.588.2]APPENDIX
Figure A.1: The cumulative sum of recursive residual plots of lnGDP, INF, and lnPC/GDP
OLS-CUSUM of equation lngdp
Time E m p ir ic a l fl u c tu a ti o n p ro c e s s
0.0 0.2 0.4 0.6 0.8 1.0
-1 .0 0 .0 1 .0
OLS-CUSUM of equation inflation
Time E m p ir ic a l fl u c tu a ti o n p ro c e s s
0.0 0.2 0.4 0.6 0.8 1.0
-1 .0 0 .0 1 .0
OLS-CUSUM of equation lnprivate
Time E m p ir ic a l fl u c tu a ti o n p ro c e s s
0.0 0.2 0.4 0.6 0.8 1.0
21
Figure A.2: The cumulative sum of recursive residual plots of lnGDP, INF, and lnBD/GDP
OLS-CUSUM of equation lngdp
Time E m p ir ic a l fl u c tu a ti o n p ro c e s s
0.0 0.2 0.4 0.6 0.8 1.0
-1 .0 0 .0 1 .0
OLS-CUSUM of equation inflation
Time E m p ir ic a l fl u c tu a ti o n p ro c e s s
0.0 0.2 0.4 0.6 0.8 1.0
-1 .0 0 .0 1 .0
OLS-CUSUM of equation lnbank
Time E m p ir ic a l fl u c tu a ti o n p ro c e s s
0.0 0.2 0.4 0.6 0.8 1.0