Proceedings of the 55th Annual Meeting of the Association for Computational Linguistics, pages 763–772 Vancouver, Canada, July 30 - August 4, 2017. c2017 Association for Computational Linguistics
Proceedings of the 55th Annual Meeting of the Association for Computational Linguistics, pages 763–772 Vancouver, Canada, July 30 - August 4, 2017. c2017 Association for Computational Linguistics
TextFlow: A Text Similarity Measure based on Continuous Sequences
Yassine Mrabet
Halil Kilicoglu
Lister Hill National Center for Biomedical Communications U.S. National Library of Medicine
8600 Rockville Pike, 20894, Bethesda, MD, USA
Dina Demner-Fushman
Abstract
Text similarity measures are used in multi-ple tasks such as plagiarism detection, in-formation ranking and recognition of para-phrases and textual entailment. While re-cent advances in deep learning highlighted further the relevance of sequential mod-els in natural language generation, existing similarity measures do not fully exploit the sequential nature of language. Exam-ples of such similarity measures include n-grams and skip-n-grams overlap which rely on distinct slices of the input texts. In this paper we present a novel text sim-ilarity measure inspired from a common representation in DNA sequence align-ment algorithms. The new measure, called
TextFlow, represents input text pairs as continuous curves and uses both the actual position of the words and sequence match-ing to compute the similarity value. Our experiments on eight different datasets show very encouraging results in para-phrase detection, textual entailment recog-nition and ranking relevance.
1 Background
The number of pages required to print the content of the World Wide Web was estimated to 305 bil-lion in a 2015 article1. While a big part of this
content consists of visual information such as pic-tures and videos, texts also continue growing at a very high pace. A recent study shows that the av-erage webpage weights 1,200 KB with plain text accounting for up to 16% of that size2.
While efficient distribution of textual data and computations are the key to deal with the
increas-1http://goo.gl/p9lt7V 2http://goo.gl/c41wpa
ing scale of textual search, similarity measures still play an important role in refining search re-sults to more specific needs such as the recognition of paraphrases and textual entailment, plagiarism detection and fine-grained ranking of information. These tasks are also often performed on dedicated document collections for domain-specific applica-tions where text similarity measures can be di-rectly applied.
Finding relevant approaches to compute text similarity motivated a lot of research in the last decades (Sahami and Heilman, 2006; Hatzivas-siloglou et al.,1999), and more recently with deep learning methods (Socher et al., 2011;Yih et al., 2011; Severyn and Moschitti, 2015). However, most of the recent advances focused on designing high performance classification methods, trained and tested for specific tasks and did not offer a standalone similarity measure that could be ap-plied (i) regardless of the application domain and (ii) without requiring training corpora.
For instance, Yih and Meek (2007) presented an approach to improve text similarity measures for web search queries with a length ranging from one word to short sequences of words. The pro-posed method is tailored to this specific task, and the training models are not expected to perform well on different kinds of data such as sentences, questions or paragraphs. In a more general study, Achananuparp et al.(2008) compared several text similarity measures for paraphrase recognition, textual entailment, and the TREC 9 question vari-ants task. In their experiments the best perfor-mance was obtained with a linear combination of semantic and lexical similarities, including a word order similarity proposed in (Li et al.,2006). This word order similarity is computed by con-structing first two vectors representing the com-mon words between two given sentences and using their respective positions in the sentences as term
weights. The similarity value is then obtained by subtracting the two vectors and taking the absolute value. While such representation takes into ac-count the actual positions of the words, it does not allow detecting sub-sequence matches and takes into account missing words only by omission.
More generally, existing standalone (or tradi-tional) text similarity measures rely on the inter-sections between token sets and/or text sizes and frequency, including measures such as the Co-sine similarity, Euclidean distance, Levenshtein (Sankoff and Kruskal, 1983), Jaccard (Jain and Dubes, 1988) and Jaro (Jaro, 1989). The se-quential nature of natural language is taken into account mostly through word n-grams and skip-grams which capture distinct slices of the analysed texts but do not preserve the order in which they appear.
In this paper, we use intuitions from a common representation in DNA sequence alignment to de-sign a new standalone similarity measure called
TextFlow(XF). The proposed measure uses at the same time the full sequence of input texts in a natural sub-sequence matching approach together with individual token matches and mismatches. Our contributions can be detailed further as fol-lows:
• A novel standalone similarity measure which:
– exploits the full sequence of words in the compared texts.
– is asymmetric in a way that allows it to provide the best performance on dif-ferent tasks (e.g., paraphrase detection, textual entailment and ranking).
– when required, it can be trained with a small set of parameters controlling the impact of sub-sequence matching, posi-tion gaps and unmatched words.
– provides consistent high performance across tasks and datasets compared to traditional similarity measures.
• A neural network architecture to train
TextFlowparameters for specific tasks.
• An empirical study on both performance
[image:2.595.328.489.64.227.2]con-sistency and standard evaluation measures, performed with eight datasets from three dif-ferent tasks.
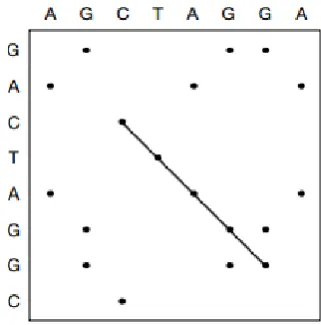
Figure 1: Dot matrix example for 2 DNA se-quences (Mount,2004)
• A new evaluation measure, called CORE, used to better show the consistency of a sys-tem at high performance using both its rank average and rank variance when compared to competing systems over a set of datasets.
2 TheTextFlowSimilarity
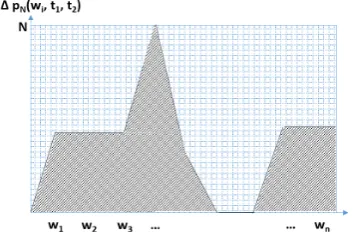
XF is inspired from a dot matrix representation commonly used in pairwise DNA sequence align-ment (cf. figure 1). We use a similar dot matrix representation for text pairs and draw a curve os-cillating around the diagonal (cf. figure2). The area under the curve is considered to be the dis-tance between the two text pairs which is then normalized with the matrix surface. For practical computation, we transform this first intuitive rep-resentation using the delta of positions as in figure 3. In this setting, the Y axis is the delta of posi-tions of a word occurring in the two texts being compared. If the word does not occur in the tar-get text, the delta is considered to be a maximum reference value (lin figure2).
Figure 2: Illustration ofTextFlowIntuition
Figure 3: PracticalTextFlowComputation
XF(X, Y) = 1− 1
nm
n
X
i=2
1
Si
Ti,i−1(X, Y)
− 1
nm
n
X
i=2
1
Si
Ri,i−1(X, Y)
(1)
With Ti,i−1(X, Y) corresponding to the
triangu-lar area in the [i − 1, i] step (cf. figure 3)
andRi,i−1(X, Y) corresponding to the
rectangu-lar component. They are expressed as:
Ti,i−1(X, Y) = |∆P(xi, X, Y)−∆P(xi−1, X, Y)|
2 (2)
and:
Ri,i−1(X, Y) =M in(∆P(xi, X, Y),∆P(xi−1, X, Y))
(3)
With:
• ∆P(xi, X, Y) the minimum difference
be-tweenxi positions in X andY. xi position
inX is multiplied by the factor |Y|X|| for nor-malization. If xi ∈/ X ∩Y, ∆P(xi, X, Y)
is set to the same reference value equal tom, (i.e., the cost of a missing word is set by de-fault to the length of the target text), and:
• Si is the length of the longest matching
se-quence betweenXandY including the word xi, ifxi∈X∩Y, or 1 otherwise.
XF computation is performed inO(nm)in the
worst case where we have to check all tokens in the target textY for all tokens in the input textX.XF is an asymmetric similarity measure. Its asymmet-ric aspect has interesting semantic applications as we show in the example below (cf. figure2). The minimum value of XF provided the best differ-entiation between positive and negative text pairs when looking for semantic equivalence (i.e., para-phrases), the maximum value was among the top three for the textual entailment example. We con-duct this comparison at a larger scale in the evalu-ation section.
We add 3 parameters to XF in order to repre-sent the importance that should be given to posi-tion deltas (Posiposi-tion factorα), missing words (sen-sitivity factorβ), and sub-sequence matching (se-quence factorγ), such that:
XFα,β,γ(X, Y) = 1−
1
βnm
n
X
i=2
α SiγT
β
i,i−1(X, Y)
− 1
βnm
n
X
i=2
α SiγR
β
i,i−1(X, Y)
(4) With:
Ti,iβ−1(X, Y) =|∆βP(xi, X, Y)−∆βP(xi−1, X, Y)| 2
(5)
Rβi,i−1(X, Y) =M in(∆βP(xi, X, Y),∆βP(xi−1, X, Y))
(6)
and:
• ∆βP(xi, X, Y) =βm, ifxi ∈/X∩Y
• α < β: forces missing words to always cost
more than matched words.
• Siγ=
1if Si = 1orxi ∈/X∩Y
γ Sif orSi >1
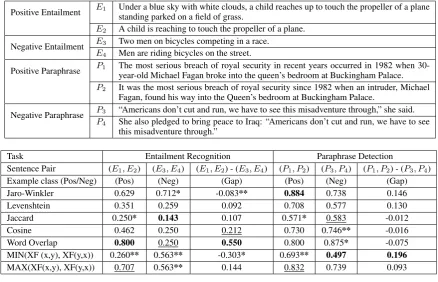
[image:3.595.93.270.293.409.2]Positive Entailment E1 Under a blue sky with white clouds, a child reaches up to touch the propeller of a plane
standing parked on a field of grass.
E2 A child is reaching to touch the propeller of a plane.
Negative Entailment E3 Two men on bicycles competing in a race.
E4 Men are riding bicycles on the street.
Positive Paraphrase P1 The most serious breach of royal security in recent years occurred in 1982 when
30-year-old Michael Fagan broke into the queen’s bedroom at Buckingham Palace.
P2 It was the most serious breach of royal security since 1982 when an intruder, Michael
Fagan, found his way into the Queen’s bedroom at Buckingham Palace.
Negative Paraphrase P3 “Americans don’t cut and run, we have to see this misadventure through,” she said.
P4 She also pledged to bring peace to Iraq: “Americans don’t cut and run, we have to see
this misadventure through.”
Task Entailment Recognition Paraphrase Detection
Sentence Pair (E1, E2) (E3, E4) (E1, E2) - (E3, E4) (P1, P2) (P3, P4) (P1, P2) - (P3, P4)
Example class (Pos/Neg) (Pos) (Neg) (Gap) (Pos) (Neg) (Gap)
Jaro-Winkler 0.629 0.712* -0.083** 0.884 0.738 0.146
Levenshtein 0.351 0.259 0.092 0.708 0.577 0.130
Jaccard 0.250* 0.143 0.107 0.571* 0.583 -0.012
Cosine 0.462 0.250 0.212 0.730 0.746** -0.016
Word Overlap 0.800 0.250 0.550 0.800 0.875* -0.075
MIN(XF (x,y), XF(y,x)) 0.260** 0.563** -0.303* 0.693** 0.497 0.196
[image:4.595.77.516.62.344.2]MAX(XF(x,y), XF(y,x)) 0.707 0.563** 0.144 0.832 0.739 0.093
Figure 4: Example sentences and similarity values. The best value per column is highlighted. The second best is underlined. Worst and second worst values are followed by one and two stars. Entailment examples are taken from SNLI (Bowman et al.,2015). Paraphrase examples are taken from MSRP4.
missing tokens as well as the normalization quan-tityβnmin equation4to keep the similarity val-ues in the [0,1] range.
2.1 Parameter Training
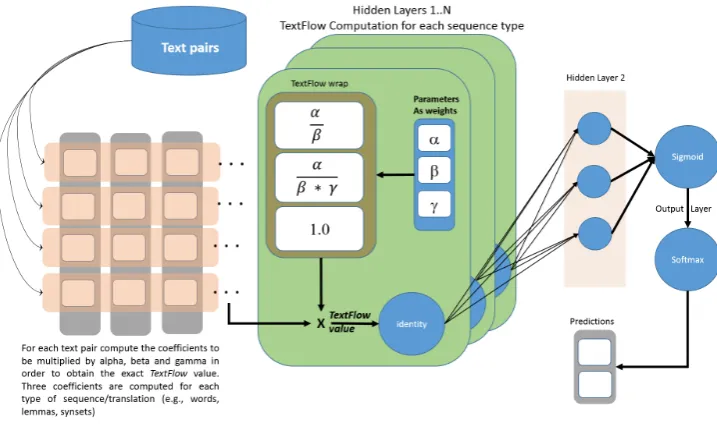
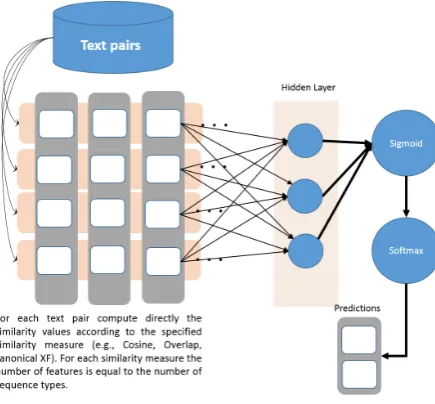
By defaultXF has canonical parameters set to 1. However, when needed,α,β, andγcan be learned on training data for a specific task. We designed a neural network to perform this task, with a hidden layer dedicated to compute the exact XF value. To do so we compute, for each input text pair, the co-efficients vector that would lead exactly to the XF value when multiplied by the vector< αβ,βγα ,1>.
Figure5) presents the training neural network con-sidering several types of sequences (or transla-tions) of the input text pairs (e.g., lemmas, words, synsets).
We use identity as activation function in the dedicated XF layer in order to have a correct com-parison with the other similarity measures, includ-ing canonical XF where the similarity value is pro-vided in the input layer (cf. figure6).
3 Evaluation
Datasets. This evaluation was performed on 8 datasets from 3 different classification tasks:
Tex-tual Entailment Recognition, Paraphrase Detec-tion, and ranking relevance. The datasets are as follows:
• RTE 1, 2, and 3: the first three datasets from the Recognizing Textual Entailment (RTE) challenge (Dagan et al.,2006). Each dataset consists of sentence pairs which are anno-tated with 2 labels: entailment, and non-entailment. They contain respectively (200, 800), (800, 800), and (800, 800) (train, test) pairs.
• Guardian: an RTE dataset collected from
78,696 Guardian articles5 published from
January 2004 onwards and consisting of 32K pairs which we split randomly in 90%/10% training/test sets. Positive examples were collected from the titles and first sentences. Negative examples were collected from the same source by selecting consecutive sen-tences and random sensen-tences.
• SNLI: a recent RTE dataset consisting of 560K training sentence pairs annotated with
Figure 5: NN architectureA1for XF Parameter Training
3 labels: entailment, neutral and contradic-tion (Bowman et al.,2015). We discarded the contradiction pairs as they do not necessarily represent dissimilar sentences and are there-fore a random noise w.r.t. our similarity mea-sure evaluation.
• MSRP: the Microsoft Research Paraphrase
corpus, consisting of 5,800 sentence pairs annotated with a binary label indicating whether the two sentences are paraphrases or not.
• Semeval-16-3B: a dataset of question-question similarity collected from Stack-Overflow (Nakov et al., 2016). The dataset contains 3,169 training pairs and 700 test pairs. Three labels are considered: ”Perfect Match”, ”Relevant” or ”Irrelevant”. We com-bined the first two into the same positive cat-egory for our evaluation.
• Semeval-14-1: a corpus of Sentences Involv-ing Compositional Knowledge (Marelli et al., 2014) consisting of 10,000 English sentence pairs annotated with both similarity scores and relevance labels.
Features. After a preprocessing step where we removed stopwords, we computed the similarity values using 7 different types of sequences con-structed, respectively, with the following value from each token:
• Word (plain text value)
• Lemma
• Part-Of-Speech (POS) tag
• WordNet Synset6OR Lemma
• WordNet Synset OR Lemma for Nouns
• WordNet Synset OR Lemma for Verbs
• WordNet Synset OR Lemma for Nouns and
Verbs.
In the last 4 types of sequences the lemma is used when there is no corresponding WordNet synset. In a first experiment we compare differ-ent aggregation functions on top of XF (minimum, maximum and average) in table 1. We used the Li-bLinear7SVM classifier for this task.
In the second part of the evaluation, we use neu-ral networks to compare the efficiency of XFc,
XFt and other similarity measures with in the
same setting. We use the neural net described in figure5for the trained versionXFtand the
equiv-alent architecture presented in figure6for all other similarity measures. For canonical XFc we use
by default the best aggregation for the task as ob-served in table3.
Task Entailment Recognition Paraphrase Detection Ranking Relevance Datasets RTE 1 RTE 2 RTE 3 Guardian SNLI MSRP Semeval16-t3B Semeval12-t17
XF MIN 55.3 53.8 60.0 77.3 58.0 72.1 77.4 77.8
XF AVG 51.4 1 57.2 62.5 84.9 62.0 72.0 77.6 79.5
[image:6.595.72.528.61.126.2]XF MAX 53.9 61.3 64.7 86.7 64.3 71.4 76.7 77.7
Table 1: Accuracy evaluation with different aggregations of XF using an SVM classifier.
Figure 6: NN Architecture A2for the equivalent evaluation of other similarity measures.
Similarity Measures. We considered nine tra-ditional similarity measures included in the Sim-metrics distribution8: Cosine, Euclidean
dis-tance, Word Overlap, Dice coefficient (Dice, 1945), Jaccard(Jain and Dubes,1988), Damerau, Jaro-Winkler (JW) (Porter et al., 1997), Leven-shtein (LEV) (Sankoff and Kruskal, 1983), and Longest Common Subsequence (LCS) (Friedman and Sideli,1992).
Implementation. XF was implemented in Java as an extension of the Simmetrics package, made available at this address9. The neural networks
were implemented in Python with TensorFlow10.
We also share the training sets used for both pa-rameter training and evaluation. The evaluation was performed on a 4-core laptop with 32GB of RAM. The initial parameters forXFt were
cho-sen with a random function.
Evaluation Measures. We use the standard ac-curacy values and F1, precision and recall for the
8https://github.com/Simmetrics/ simmetrics
9https://github.com/ymrabet/TextFlow 10https://www.tensorflow.org/
positive class (i.e., entailment, paraphrase, and ranking relevance). We also study the relative rank in performance of each similarity measure across all datasets using the average rank, the rank vari-ance and a new evaluation measure called Con-sistent peRformancE (CORE), computed as fol-lows for a system m, a set of datasets D, a set of systems S, and an evaluation measure E ∈
{F1, P recision, Recall, Accuracy}:
CORE
D,S,E(m) =
M IN
p∈S AV Gd∈D(RS(Ed(p)) +Vd∈D(RS(Ed(p)))
AV G
d∈D RS(Ed(m))
+Vd∈D RS(Ed(m))
(7)
With RS(Ed(m)) the rank of m according to
the evaluation measureEon datasetdw.r.t. com-peting systemsS. Vd∈D(RS(Ed(m)))is the rank
variance ofmover datasets. The results in tables 2, 3, and 4 demonstrate the intuition. Basically, CORE tells us how consistent a system/method is in having high performance, relatively to the set of competing systemsS. The maximum value of CORE is 1 for the best performing system
ac-cording to its rank. It also allows quantifying how consistently a system achieves high performance for the remaining systems.
TextFlow outperformed the results obtained with a combination of word order similarity and semantic similarities tested in (Achananuparp et al.,2008), with gaps of +1.0 in F1 and +6.1 ac-curacy on MSRP and +4.2 F1 and +2.7% acac-curacy on RTE 3.
4 Discussion
4.1 CanonicalText Flow
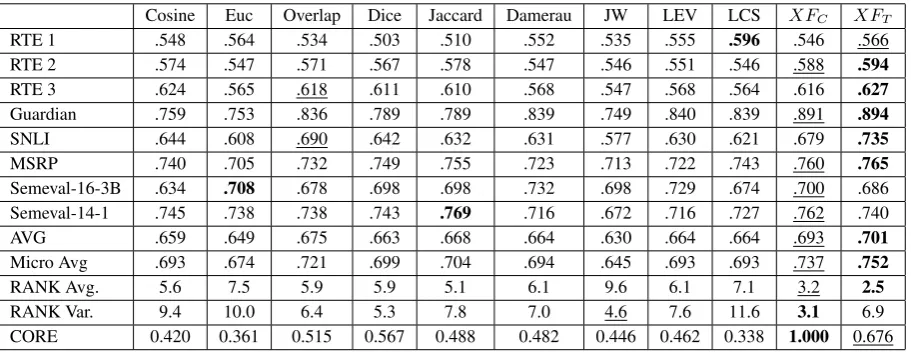
T Fchad the best average and micro-average
accu-racy on the 8 classification datasets, with a gap of +0.4 to +6.3 when compared to the state-of-the-art measures. It also reached the best precision aver-age with a gap of +1.8 to +6.3. On the F1 score level XFc achieved the second best performance
[image:6.595.78.296.165.367.2]Cosine Euc Overlap Dice Jaccard Damerau JW LEV LCS XFC XFT
RTE 1 .561 .564 .550 .504 .511 .557 .532 .561 .568 .550 .575
RTE 2 .575 .555 .598 .566 .572 .548 .541 .551 .548 .597 .612
RTE 3 .652 .562 .636 .637 .630 .567 .538 .567 .562 .627 .647
Guardian .748 .750 .820 .778 .780 .847 .726 .847 .848 .867 .876
SNLI .621 .599 .665 .612 .608 .631 .556 .630 .619 .641 .656
MSRP .719 .689 .720 .729 .731 .687 .699 .685 .717 .724 .732
Semeval-16-3B .756 .734 .769 .781 .780 .759 .751 .759 .737 .777 .782
Semeval-14-1 .790 .756 .779 .783 .786 .749 .719 .749 .757 .783 .798
AVG .678 .651 .692 .674 .675 .668 .633 .669 .670 .696 .710
Micro Avg .699 .675 .725 .700 .700 .701 .646 .701 .701 .726 .739
RANK Avg 5.1 8.2 4.5 5.6 5.5 6.9 10.1 6.7 6.7 4.1 1.2
RANK Var. 9.0 5.9 4.3 10.0 8.6 5.3 1.6 6.2 8.2 2.7 0.2
[image:7.595.67.532.314.492.2]CORE 0.104 0.103 0.167 0.094 0.104 0.121 0.125 0.113 0.098 0.215 1.000
Table 2: Accuracy values using. The best result is highlighted, the second best is underlined.
Cosine Euc Overlap Dice Jaccard Damerau JW LEV LCS XFC XFT
RTE 1 .612 .564 .636 .512 .523 .578 .513 .583 .494 .565 .599
RTE 2 .579 .590 .662 .565 .558 .549 .516 .551 .555 .616 .646
RTE 3 .705 .598 .682 .695 .682 .608 .556 .607 .603 .665 .690
Guardian .742 .749 .816 .774 .776 .849 .713 .849 .850 .862 .873
SNLI .582 .576 .641 .562 .564 .627 .479 .627 .611 .594 .585
MSRP .808 .797 .812 .814 .813 .784 .802 .783 .804 .804 .810
Semeval-16-3B .632 .462 .625 .648 .644 .544 .545 .547 .508 .633 .662
Semeval-14-1 .764 .707 .748 .753 .746 .706 .680 .706 .714 .744 .673
AVG .678 .630 .702 .665 .663 .655 .600 .656 .642 .685 .692
Micro Avg .684 .656 .716 .679 .677 .691 .608 .692 .688 .702 .687
RANK Avg 4.5 8.12 3.12 5.12 5.5 6.89 9.88 6.62 7.12 4.62 3.88
RANK Var. 9.7 4.7 4.4 14.7 6.6 8.7 1.8 9.1 8.1 2.3 11.0
CORE 0.485 0.538 0.915 0.348 0.571 0.443 0.588 0.438 0.452 1.000 0.464
Table 3: F1 scores. The best result is highlighted, the second best is underlined.
Cosine Euc Overlap Dice Jaccard Damerau JW LEV LCS XFC XFT
RTE 1 .548 .564 .534 .503 .510 .552 .535 .555 .596 .546 .566
RTE 2 .574 .547 .571 .567 .578 .547 .546 .551 .546 .588 .594
RTE 3 .624 .565 .618 .611 .610 .568 .547 .568 .564 .616 .627
Guardian .759 .753 .836 .789 .789 .839 .749 .840 .839 .891 .894
SNLI .644 .608 .690 .642 .632 .631 .577 .630 .621 .679 .735
MSRP .740 .705 .732 .749 .755 .723 .713 .722 .743 .760 .765
Semeval-16-3B .634 .708 .678 .698 .698 .732 .698 .729 .674 .700 .686
Semeval-14-1 .745 .738 .738 .743 .769 .716 .672 .716 .727 .762 .740
AVG .659 .649 .675 .663 .668 .664 .630 .664 .664 .693 .701
Micro Avg .693 .674 .721 .699 .704 .694 .645 .693 .693 .737 .752
RANK Avg. 5.6 7.5 5.9 5.9 5.1 6.1 9.6 6.1 7.1 3.2 2.5
RANK Var. 9.4 10.0 6.4 5.3 7.8 7.0 4.6 7.6 11.6 3.1 6.9
CORE 0.420 0.361 0.515 0.567 0.488 0.482 0.446 0.462 0.338 1.000 0.676
[image:7.595.73.529.536.713.2]Cosine Euc Overlap Dice Jaccard Damerau JW LEV LCS XFC XFT
RTE 1 .693 .564 .786 .521 .536 .607 .493 .614 .421 .585 .635
RTE 2 .585 .640 .787 .562 .540 .550 .490 .550 .565 .647 .707
RTE 3 .810 .634 .761 .805 .773 .654 .566 .651 .649 .724 .768
Guardian .726 .744 .797 .758 .764 .858 .681 .858 .862 .835 .853
SNLI .531 .548 .600 .499 .510 .624 .409 .625 .601 .527 .486
MSRP .890 .916 .912 .890 .881 .857 .915 .856 .876 .854 .860
Semeval-16 .631 .343 .579 .605 .597 .433 .446 .438 .408 .579 .639
SICK .784 .678 .759 .763 .724 .696 .688 .695 .701 .727 .616
AVG .706 .633 .748 .675 .665 .660 .586 .661 .635 .685 .696
Micro Avg .683 649 .720 .668 .659 .695 .587 .695 .688 .677 .645
RANK Avg. 3.9 7.1 3.5 5.5 6.4 6.1 9.0 6.1 6.6 5.9 5.4
RANK Var. 9.6 12.4 3.4 9.4 5.4 8.1 10.0 11.0 11.7 5.8 14.3
[image:8.595.75.522.60.239.2]CORE 0.516 0.355 1.000 0.464 0.588 0.486 0.365 0.405 0.378 0.591 0.353
Table 5: Recall values. The best result is highlighted, the second best is underlined.
accuracy, F1 and precision, and the second best for recall.
4.2 Trained Text Flow
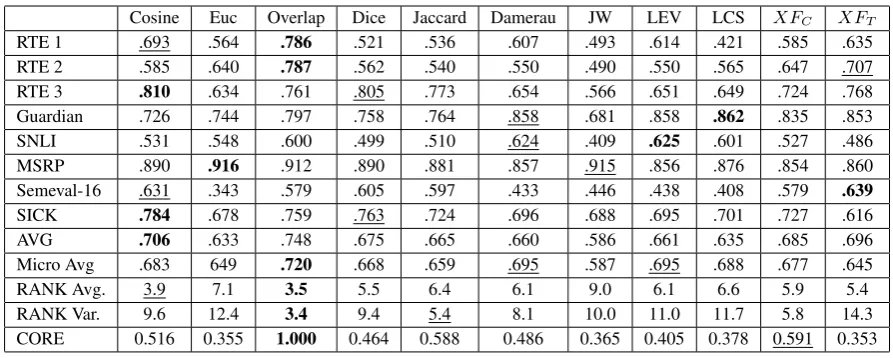
When compared to state-of-the-art measures and to canonical XF, the trained version, XFt,
obtained the best accuracy with a gap ranging from +1.4 to +7.8. XFtalso obtained the second
best F1 average with a -1.0 gap, but with clear inconsistencies according to the dataset. XFt
obtained the best precision with a gap ranging from +0.8 to +7.1. XFt did not perform well
on recall with 64.5% micro-average compared to WordOverlap with 72%. Both its recall and F1 performance can be explained by the fact that the measure was trained to optimize accuracy, and not the F1 score for the positive class; which also suggests that the approach could be adapted to F1 optimization if needed.
4.3 Synthesis
Canonical XF was more consistent than trained XF on all dimensions except accuracy, for which XFt was optimized. We argue that this
consis-tency was made possible through the asymmetry of XF which allowed it to adapt to different kinds of similarities (i.e., equivalence/paraphrase, in-ference/entailment, and mutual distance/ranking). These results also show that the actual position difference is a relevant factor for text similarity. We explain it mainly by the natural flow of lan-guage where the important entities and relations are often expressed first, in contrast with a purely logical-driven approach which has to consider, for instance, that active forms and passive forms are
equivalent in meaning. The difference in positions is also not read literally, both because of the higher impact associated to missed words and to the α parameter which allows leveraging their impact in the trained version.
4.4 Additional Experiments
In additional experiments, we comparedT Fcand
T Ft with the other similarity measures when
ap-plied to bi-grams and tri-grams instead of individ-ual tokens. The results were significantly lower on all datasets (between 3 and 10 points loss in accu-racy) for both the soa measures andTextFlow vari-ants. This result could be explained by the fact that n-grams are too rigid when a sub-sequence varies even slightly, e.g., the insertion of a new word in-side a 3-words sequence leads to a tri-gram mis-match and reduces bi-gram overlap from 100% to 50% for the considered sub-sequence. This issue is not encountered with TextFlow as it relies on the token level, and such an insertion will not cancel or reduce significantly the gains from the correct ordering of the words. It must be noted here that not all languages grant the same level of impor-tance to sequences and that additional multilingual tests have to be carried out.
In addition to binary classification output such as textual entailment and paraphrase recognition, text similarity measures can be evaluated more precisely when we consider the correlation of their values for ranking purposes.
the Microsoft Research video descriptions corpus, MSRP and the SMTeuroparl11. When compared
to the traditional similarity measures, TextFlow
had the best correlation on the first two datasets with, for instance, 0.54 and 0.46 pearson correla-tion on the lemmas sequences and the second best on the MSRP extract where the Cosine similarity had the best performance with 0.71 vs 0.68, not-ing that the Cosine similarity uses word frequen-cies when the evaluated version of TextFlow did not use word-level weights.
Including word weights is one of the promis-ing perspectives in line with this work as it could be done simply by making the deltas vary accord-ing to the weight/importance of the (un)matched word. Also, in such a setting, the impact of a sequence of N words will naturally increase or decrease according to the word weights (cf. fig-ure3). We conducted a preliminary test using the inverse document frequency of the words as ex-tracted from Wikipedia with Gensim12, which led
to an improvement of up to 2% for most datasets, with performance decreasing slightly on two of them. Other kinds of weights could also be in-cluded just as easily, such as contextual word latedness using embeddings or other semantic re-latedness factors such as WordNet distances ( Ped-ersen et al.,2004).
5 Conclusion
We presented a novel standalone similarity mea-sure that takes into account continuous word se-quences. An evaluation on eight datasets show promising results for textual entailment recogni-tion, paraphrase detection and ranking. Among the potential extensions of this work are the inclu-sion of different kinds of weights such as TF-IDF, embedding relatedness and semantic relatedness. We also intend to test other variants around the same concept, including considering the matched words and sequences to have a negative weight to balance further the weight of missing words.
Acknowledgements
This work was supported in part by the Intramural Research Program of the NIH, National Library of Medicine.
11goo.gl/NVnybD
12https://radimrehurek.com/gensim/
References
Palakorn Achananuparp, Xiaohua Hu, and Xiajiong Shen. 2008. The evaluation of sentence similarity measures. InData warehousing and knowledge dis-covery, Springer, pages 305–316.
Samuel R Bowman, Gabor Angeli, Christopher Potts, and Christopher D Manning. 2015. A large anno-tated corpus for learning natural language inference.
arXiv preprint arXiv:1508.05326.
Ido Dagan, Oren Glickman, and Bernardo Magnini. 2006. The pascal recognising textual entailment challenge. In Machine learning challenges. evalu-ating predictive uncertainty, visual object classifica-tion, and recognising tectual entailment, Springer, pages 177–190.
Lee R Dice. 1945. Measures of the amount of ecologic association between species. Ecology 26(3):297– 302.
Carol Friedman and Robert Sideli. 1992. Tolerating spelling errors during patient validation. Computers and Biomedical Research25(5):486–509.
Vasileios Hatzivassiloglou, Judith L Klavans, and Eleazar Eskin. 1999. Detecting text similarity over short passages: Exploring linguistic feature combi-nations via machine learning. InProceedings of the 1999 joint sigdat conference on empirical methods in natural language processing and very large cor-pora. Citeseer, pages 203–212.
Anil K Jain and Richard C Dubes. 1988. Algorithms for clustering data. Prentice-Hall, Inc.
Matthew A Jaro. 1989. Advances in record-linkage methodology as applied to matching the 1985 cen-sus of tampa, florida. Journal of the American Sta-tistical Association84(406):414–420.
Yuhua Li, David McLean, Zuhair A Bandar, James D O’shea, and Keeley Crockett. 2006. Sentence sim-ilarity based on semantic nets and corpus statistics.
IEEE transactions on knowledge and data engineer-ing18(8):1138–1150.
Marco Marelli, Luisa Bentivogli, Marco Baroni, Raf-faella Bernardi, Stefano Menini, and Roberto Zam-parelli. 2014. Semeval-2014 task 1: Evaluation of compositional distributional semantic models on full sentences through semantic relatedness and textual entailment.SemEval-2014.
David W Mount. 2004. Bioinformatics: sequence and genome analysis. Cold Spring Harbor Laboratory Press.
10th International Workshop on Semantic Evalu-ation, SemEval@NAACL-HLT 2016, San Diego, CA, USA, June 16-17, 2016. pages 525–545.
http://aclweb.org/anthology/S/S16/S16-1083.pdf.
Ted Pedersen, Siddharth Patwardhan, and Jason Miche-lizzi. 2004. Wordnet:: Similarity: measuring the re-latedness of concepts. InDemonstration papers at HLT-NAACL 2004. Association for Computational Linguistics, pages 38–41.
Edward H Porter, William E Winkler, et al. 1997. Ap-proximate string comparison and its effect on an ad-vanced record linkage system. InAdvanced record linkage system. US Bureau of the Census, Research Report. Citeseer.
Mehran Sahami and Timothy D Heilman. 2006. A web-based kernel function for measuring the simi-larity of short text snippets. InProceedings of the 15th international conference on World Wide Web. AcM, pages 377–386.
David Sankoff and Joseph B Kruskal. 1983. Time warps, string edits, and macromolecules: the the-ory and practice of sequence comparison. Read-ing: Addison-Wesley Publication, 1983, edited by Sankoff, David; Kruskal, Joseph B.1.
Aliaksei Severyn and Alessandro Moschitti. 2015. Learning to rank short text pairs with convolutional deep neural networks. In Proceedings of the 38th International ACM SIGIR Conference on Research and Development in Information Retrieval. ACM, pages 373–382.
Richard Socher, Eric H Huang, Jeffrey Pennington, Andrew Y Ng, and Christopher D Manning. 2011. Dynamic pooling and unfolding recursive autoen-coders for paraphrase detection. In NIPS. vol-ume 24, pages 801–809.
Wen-Tau Yih and Christopher Meek. 2007. Improving similarity measures for short segments of text. In
AAAI. volume 7, pages 1489–1494.